Financial Chart

Four Steps Chart For Business Planning Powerpoint Slides
Our professionally designed business diagram is as an effective tool for communicating business planning. It contains four steps charts with icons. Above slide is suitable to display process management steps.

Chart For Cash Flow In Global Economy Guidelines PDF
Showcasing this set of slides titled chart for cash flow in global economy guidelines pdf. The topics addressed in these templates are financial sector, business investment, services. All the content presented in this PPT design is completely editable. Download it and make adjustments in color, background, font etc. as per your unique business setting.
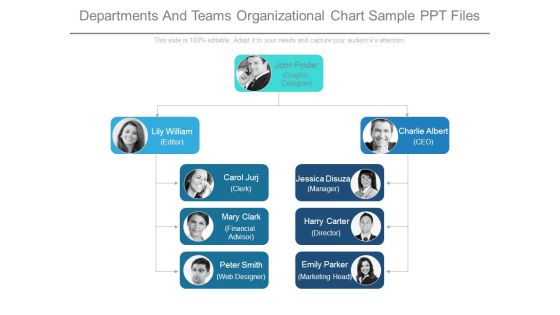
Departments And Teams Organizational Chart Sample Ppt Files
This is a departments and teams organizational chart sample ppt files. This is a three stage process. The stages in this process are john finder graphic designer, lily william editor, charlie albert ceo, carol jurj clerk, jessica disuza manager, mary clark financial advisor, harry carter director, peter smith web designer, emily parker marketing head.
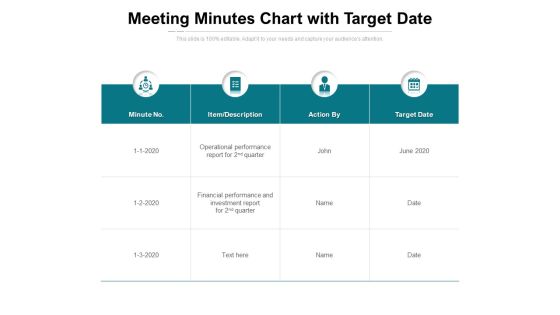
Meeting Minutes Chart With Target Date Ppt PowerPoint Presentation Portfolio
Presenting this set of slides with name meeting minutes chart with target date ppt powerpoint presentation portfolio. The topics discussed in these slides are operational performance, financial performance, investment report. This is a completely editable PowerPoint presentation and is available for immediate download. Download now and impress your audience.
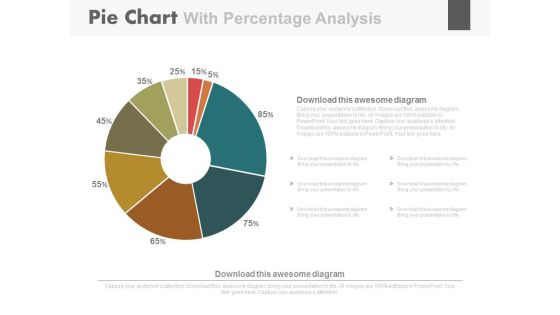
Pie Chart For Strategic Sales Plan Powerpoint Slides
This PowerPoint template has been designed with diagram of pie chart. This PPT slide can be used to prepare presentations on strategic sales plan. You can download finance PowerPoint template to prepare awesome presentations.

Target Chart For Strategic Management Process Powerpoint Slides
This PowerPoint template has been designed with four steps target chart. The PowerPoint template may be used to display strategic management process. You can download this PowerPoint slide for corporate presentations or annual meeting and business plans.
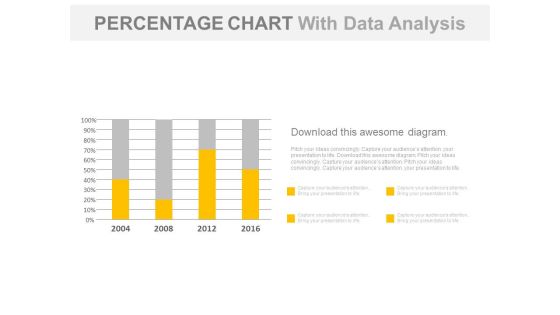
Year Based Chart With Percentage Data Analysis Powerpoint Slides
Our above business slide contains year based statistical chart. This PowerPoint template can be used to display percentage data analysis. Capture the attention of your audience with this slide.
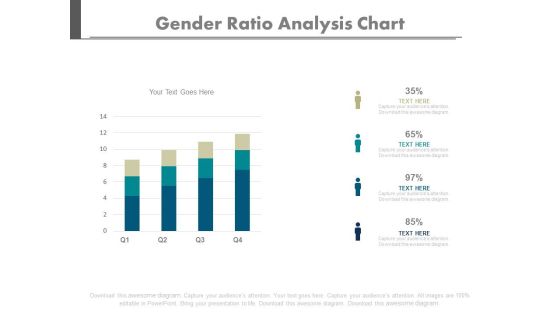
Four Bars Gender Population Ratio Chart Powerpoint Slides
Create dynamic presentations with our creative template of bar graph. This diagram may be used to present gender population. Download this template to leave permanent impression on your audience.
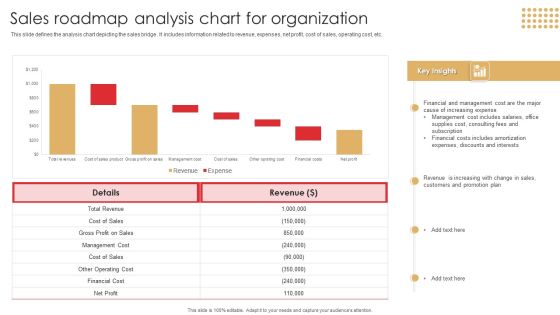
Sales Roadmap Analysis Chart For Organization Download PDF
This slide defines the analysis chart depicting the sales bridge . It includes information related to revenue, expenses, net profit, cost of sales, operating cost, etc.Showcasing this set of slides titled Sales Roadmap Analysis Chart For Organization Download PDF. The topics addressed in these templates are Management Cost, Financial Cost, Includes Amortization. All the content presented in this PPT design is completely editable. Download it and make adjustments in color, background, font etc. as per your unique business setting.

Digital Advertisement Spend Trend Chart By Industries Elements PDF
This slide depicts expenditure trends for digital advertising by top industries. It includes retail, automotive, financial services, telecom, consumer products, travel, healthcare, media, entertainment, etc. Showcasing this set of slides titled Digital Advertisement Spend Trend Chart By Industries Elements PDF. The topics addressed in these templates are Retail Sector, Total Budget, Chart By Industries. All the content presented in this PPT design is completely editable. Download it and make adjustments in color, background, font etc. as per your unique business setting.
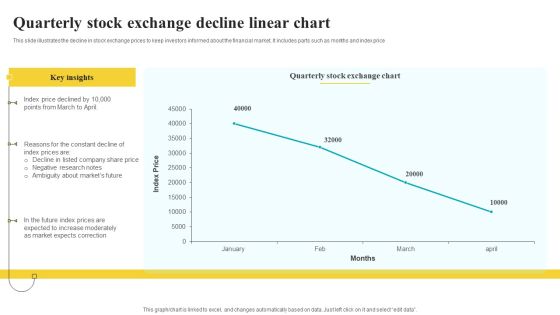
Quarterly Stock Exchange Decline Linear Chart Inspiration PDF
This slide illustrates the decline in stock exchange prices to keep investors informed about the financial market. It includes parts such as months and index price Pitch your topic with ease and precision using this Quarterly Stock Exchange Decline Linear Chart Inspiration PDF. This layout presents information on Key Insights, Exchange Chart, Correction. It is also available for immediate download and adjustment. So, changes can be made in the color, design, graphics or any other component to create a unique layout.

Business Chart Finance PowerPoint Templates And PowerPoint Themes 1012
Visually support your Microsoft office PPT Presentation with our above template illustrating a colored bar graph. This image has been professionally designed to emphasize the concept of statistics. This image has been conceived to enable you to emphatically communicate your ideas in your Business and Financial PPT presentations showing reports, ratings and reviews etc. Deliver amazing presentations to mesmerize your audience.

Column Chart Analysis Ppt Powerpoint Presentation Summary Infographics
This is a column chart analysis ppt powerpoint presentation summary infographics. This is a three stage process. The stages in this process are column chart, finance, marketing, management, analysiscolumn chart, finance, marketing, management, analysis.
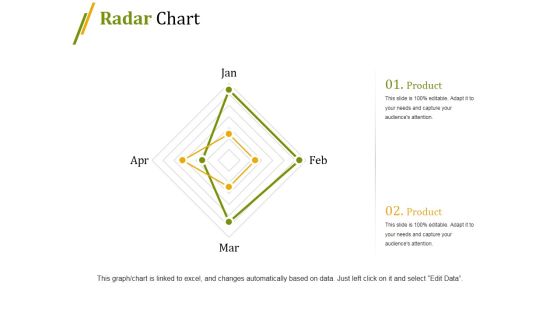
Radar Chart Ppt PowerPoint Presentation Infographic Template Professional
This is a radar chart ppt powerpoint presentation infographic template professional. This is a four stage process. The stages in this process are chart, finance, marketing, business, strategy.
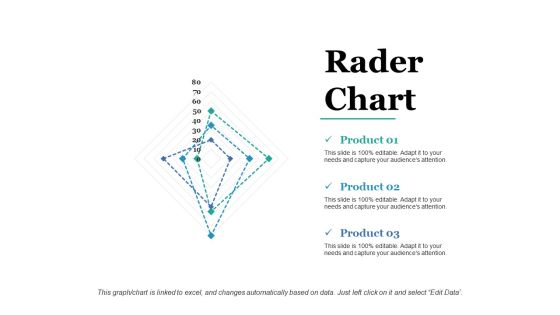
Rader Chart Ppt PowerPoint Presentation Infographic Template Graphics
This is a rader chart ppt powerpoint presentation infographic template graphics. This is a three stage process. The stages in this process are rader, chart, business, marketing, finance.

Bubble Chart Ppt PowerPoint Presentation Infographic Template Example Introduction
This is a bubble chart ppt powerpoint presentation infographic template example introduction. This is a two stage process. The stages in this process are product, bubble chart, business.
Rader Chart Ppt PowerPoint Presentation Icon Clipart Images
This is a rader chart ppt powerpoint presentation icon clipart images. This is a six stage process. The stages in this process are business, marketing, finance, planning, chart.
Stock Chart Ppt PowerPoint Presentation Icon Designs Download
This is a stock chart ppt powerpoint presentation icon designs download. This is a one stage process. The stages in this process are chart, business, marketing, finance, strategy.

Radar Chart With Markers Ppt PowerPoint Presentation Portfolio Slides
This is a radar chart with markers ppt powerpoint presentation portfolio slides. This is a three stage process. The stages in this process are radar chart, markers, product.

Filled Radar Chart Ppt PowerPoint Presentation File Information
This is a filled radar chart ppt powerpoint presentation file information. This is a two stage process. The stages in this process are chart, business, marketing, finance, strategy.

Radar Chart Ppt PowerPoint Presentation Gallery Example File
This is a radar chart ppt powerpoint presentation gallery example file. This is a three stage process. The stages in this process are radar chart, business, marketing, finance.

Radar Chart Ppt PowerPoint Presentation Summary Background Images
This is a radar chart ppt powerpoint presentation summary background images. This is a two stage process. The stages in this process are chart, business, marketing, finance, strategy.
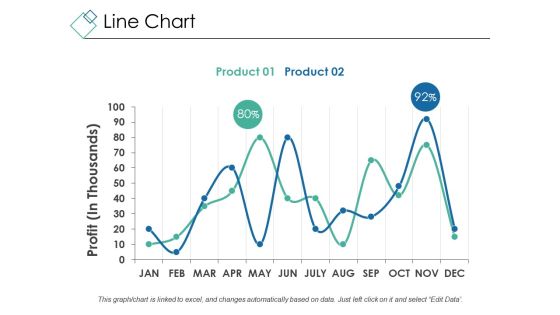
Line Chart Ppt PowerPoint Presentation Outline Design Ideas
This is a line chart ppt powerpoint presentation outline design ideas. This is a two stage process. The stages in this process are profit, percentage, chart, business, marketing.

Bubble Chart Ppt PowerPoint Presentation Styles Example Topics
This is a bubble chart ppt powerpoint presentation styles example topics. This is a two stage process. The stages in this process are profit, chart, business, marketing, finance.
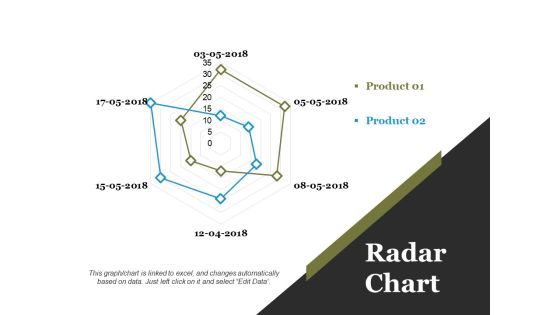
Radar Chart Ppt PowerPoint Presentation Ideas Background Images
This is a radar chart ppt powerpoint presentation ideas background images. This is a two stage process. The stages in this process are chart, business, marketing, finance, strategy.

Bubble Chart Ppt PowerPoint Presentation Summary Graphic Tips
This is a bubble chart ppt powerpoint presentation summary graphic tips. This is a three stage process. The stages in this process are chart, business, marketing, finance, strategy.
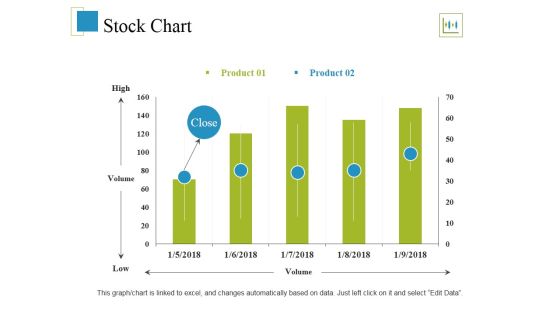
Stock Chart Ppt PowerPoint Presentation Show Design Inspiration
This is a stock chart ppt powerpoint presentation show design inspiration. This is a two stage process. The stages in this process are high, volume, low, stock chart.

Bubble Chart Product Ppt PowerPoint Presentation Professional Model
This is a bubble chart product ppt powerpoint presentation professional model. This is two stage process. The stages in this process are bubble chart, finance, business, strategy, marketing.
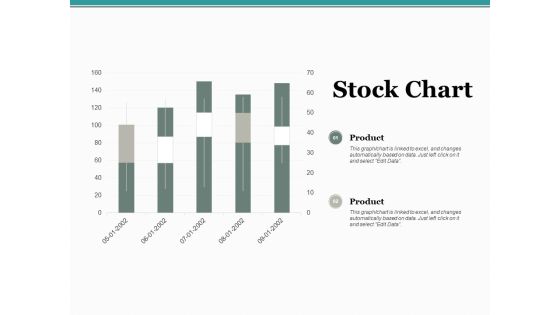
Stock Chart Ppt PowerPoint Presentation Professional Slide Download
This is a stock chart ppt powerpoint presentation professional slide download. This is a two stage process. The stages in this process are product, percentage, management, marketing, chart.
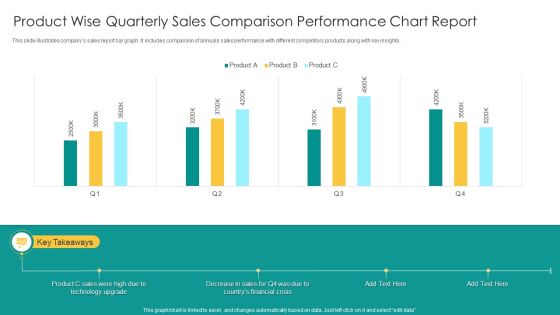
Product Wise Quarterly Sales Comparison Performance Chart Report Infographics PDF
This slide illustrates companys sales report bar graph. It includes comparison of annuals sales performance with different competitors products along with key insights. Showcasing this set of slides titled Product Wise Quarterly Sales Comparison Performance Chart Report Infographics PDF. The topics addressed in these templates are Product C Sales, Technology Upgrade, Financial Crisis. All the content presented in this PPT design is completely editable. Download it and make adjustments in color, background, font etc. as per your unique business setting.
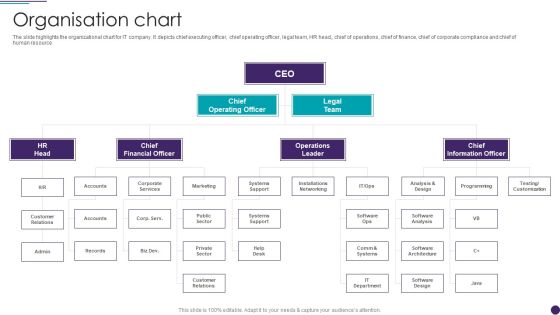
IT Services Business Profile Organisation Chart Download PDF
Presenting IT Services Business Profile Organisation Chart Download PDF to Chief O visual cues and insights. Share and navigate important information on two stages that need your due attention. This template can be used to pitch topics like Chief Operating Officer, Chief Financial Officer, Chief Information Officer. In addtion, this PPT design contains high resolution images, graphics, etc, that are easily editable and available for immediate download.

Bar Chart Marketing Ppt PowerPoint Presentation Outline Deck
This is a bar chart marketing ppt powerpoint presentation outline deck. This is a two stage process. The stages in this process are business, management, marketing, financial, sales.

Scatter Bubble Chart Ppt PowerPoint Presentation Professional Skills
This is a scatter bubble chart ppt powerpoint presentation professional skills. This is a six stage process. The stages in this process are financial, marketing, management, strategy, planning.

Bar Chart Ppt PowerPoint Presentation Infographic Template Tips
This is a bar chart ppt powerpoint presentation infographic template tips. This is a two stage process. The stages in this process are bar chart, finance, marketing, strategy, business.

Stacked Bar Chart Ppt PowerPoint Presentation Portfolio Templates
This is a stacked bar chart ppt powerpoint presentation portfolio templates. This is a three stage process. The stages in this process are stacked bar chart, product, year, business, finance.
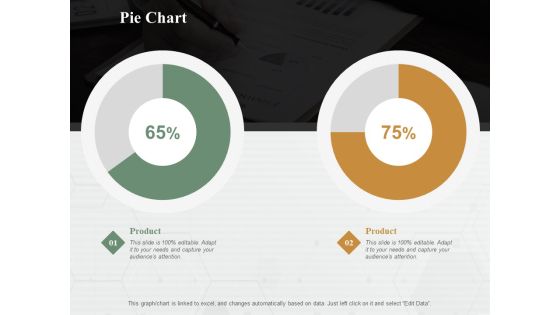
Pie Chart Finance Ppt PowerPoint Presentation Diagram Lists
This is a pie chart finance ppt powerpoint presentation diagram lists. This is a two stage process. The stages in this process are pie chart, finance, marketing, analysis, business.

Bar Chart Ppt PowerPoint Presentation Visual Aids Backgrounds
This is a bar chart ppt powerpoint presentation visual aids backgrounds. This is a two stage process. The stages in this process are bar chart, analysis, strategy, finance, business.

Bar Chart Ppt PowerPoint Presentation Model Clipart Images
This is a bar chart ppt powerpoint presentation model clipart images. This is a two stage process. The stages in this process are bar chart, finance, marketing, strategy, analysis.

Combo Chart Ppt PowerPoint Presentation Layouts Background Image
This is a combo chart ppt powerpoint presentation layouts background image. This is a three stage process. The stages in this process are bar chart, marketing, strategy, finance, planning.

Area Chart Marketing Planning Ppt PowerPoint Presentation Icon Sample
This is a area chart marketing planning ppt powerpoint presentation icon sample. This is a two stage process. The stages in this process are area chart, finance, marketing, analysis, investment.

Area Chart Ppt PowerPoint Presentation Infographic Template Inspiration
This is a area chart ppt powerpoint presentation infographic template inspiration. This is a two stage process. The stages in this process are area chart, marketing, strategy, finance, planning.

Radar Chart Ppt PowerPoint Presentation Portfolio Design Templates
This is a radar chart ppt powerpoint presentation portfolio design templates. This is a two stage process. The stages in this process are radar chart, product, finance, marketing, strategy, business.
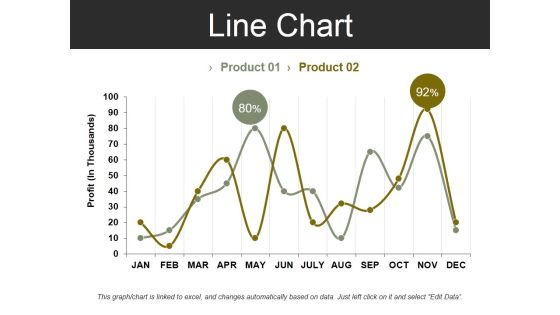
Line Chart Template 2 Ppt PowerPoint Presentation Summary Design Inspiration
This is a line chart template 2 ppt powerpoint presentation summary design inspiration. This is a two stage process. The stages in this process are profit, business, marketing, finance, chart.
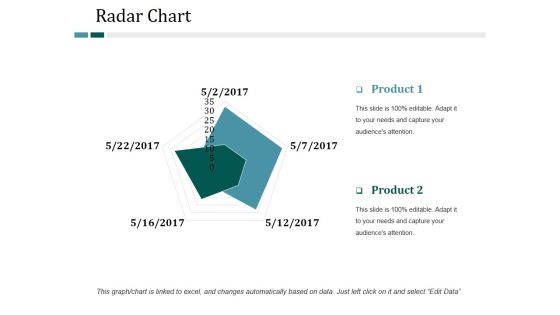
Radar Chart Ppt PowerPoint Presentation Infographic Template Backgrounds
This is a radar chart ppt powerpoint presentation infographic template backgrounds. This is a two stage process. The stages in this process are radar chart, finance, marketing, strategy, business.

Column Chart Ppt PowerPoint Presentation Infographic Template Slides
This is a column chart ppt powerpoint presentation infographic template slides. This is a two stage process. The stages in this process are column chart, finance, marketing, strategy, business.
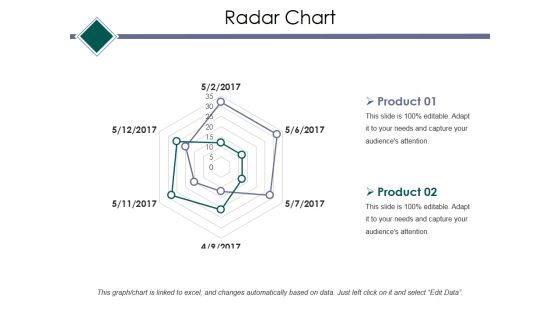
Radar Chart Ppt PowerPoint Presentation Infographic Template Example Topics
This is a radar chart ppt powerpoint presentation infographic template example topics. This is a two stage process. The stages in this process are radar chart, finance, marketing, strategy, business.

Bubble Chart Ppt PowerPoint Presentation Infographic Template Example 2015
This is a bubble chart ppt powerpoint presentation infographic template example 2015. This is a two stage process. The stages in this process are analysis, strategy, finance, business, bubble chart.

Stacked Chart Ppt PowerPoint Presentation Gallery Infographic Template
This is a stacked chart ppt powerpoint presentation gallery infographic template. This is a one stage process. The stages in this process are stacked chart, finance, analysis, marketing, business.

Combo Chart Ppt PowerPoint Presentation Infographic Template Visuals
This is a combo chart ppt powerpoint presentation infographic template visuals. This is a three stage process. The stages in this process are business, finance, strategy, analysis, combo chart.
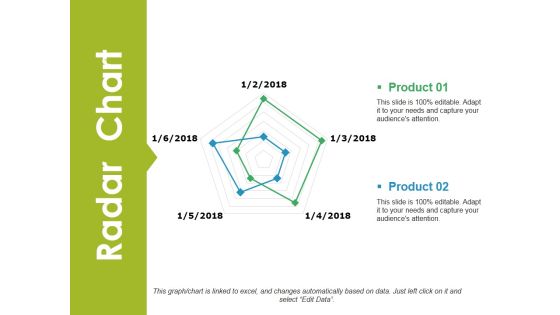
Radar Chart Ppt PowerPoint Presentation Infographic Template Tips
This is a radar chart ppt powerpoint presentation infographic template tips. This is a two stage process. The stages in this process are radar chart, business, finance, analysis, strategy.

Radar Chart Ppt PowerPoint Presentation Infographic Template Outline
This is a radar chart ppt powerpoint presentation infographic template outline. This is a two stage process. The stages in this process are radar chart, finance, analysis, management, business.

Area Chart Ppt PowerPoint Presentation Portfolio Graphics Template
This is a area chart ppt powerpoint presentation portfolio graphics template. This is a two stage process. The stages in this process are area chart, finance, analysis, business, marketing.

Combo Chart Ppt PowerPoint Presentation Layouts Design Templates
This is a combo chart ppt powerpoint presentation layouts design templates. This is a two stage process. The stages in this process are combo chart, finance, marketing, strategy, analysis, business.

Column Chart Ppt PowerPoint Presentation Infographic Template Designs Download
This is a column chart ppt powerpoint presentation infographic template designs download. This is a two stage process. The stages in this process are column chart, analysis, finance, marketing, strategy, business.
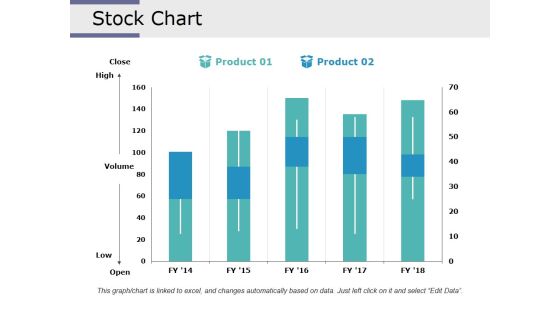
Stock Chart Ppt PowerPoint Presentation Infographic Template Design Inspiration
This is a stock chart ppt powerpoint presentation infographic template design inspiration. This is a two stage process. The stages in this process are stock chart, finance, analysis, business, marketing.

Combo Chart Ppt PowerPoint Presentation Infographic Template Slide Portrait
This is a combo chart ppt powerpoint presentation infographic template slide portrait. This is a three stage process. The stages in this process are combo chart, finance, marketing, strategy, business, growth.
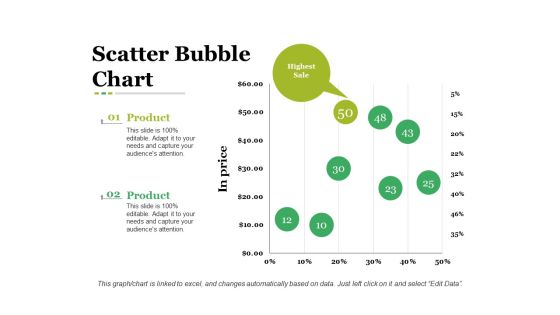
Scatter Bubble Chart Ppt PowerPoint Presentation Infographic Template Graphic Images
This is a scatter bubble chart ppt powerpoint presentation infographic template graphic images. This is a two stage process. The stages in this process are business, in price, bubble chart, marketing, strategy.
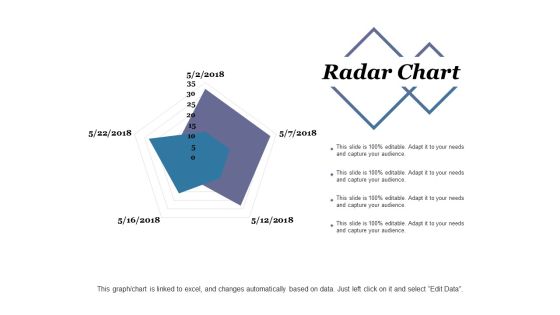
Radar Chart Ppt PowerPoint Presentation Infographic Template Sample
This is a radar chart ppt powerpoint presentation infographic template sample. This is a two stage process. The stages in this process are radar chart, finance, marketing, strategy, analysis.

Control Chart Template Ppt PowerPoint Presentation Slides Smartart
This is a control chart template ppt powerpoint presentation slides smartart. This is a two stage process. The stages in this process are anatomy of a control chart, upper control limit, add text to point, process change, lower control limit.

Pareto Chart Template 2 Ppt PowerPoint Presentation Outline Model
This is a pareto chart template 2 ppt powerpoint presentation outline model. This is a eight stage process. The stages in this process are pareto chart, finance, marketing, strategy, analysis.
 Home
Home