Financial Chart
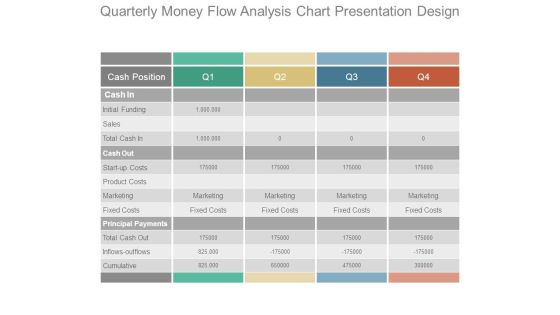
Quarterly Money Flow Analysis Chart Presentation Design
This is a quarterly money flow analysis chart presentation design. This is a four stage process. The stages in this process are cash position, cash in, initial funding, sales, total cash in, cash out, start up costs, product costs, marketing, fixed costs, principal payments, total cash out, inflows outflows, cumulative.
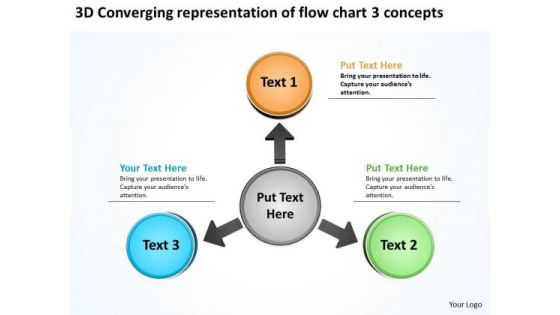
Converging Representation Of Flow Chart 3 Concepts Charts And Diagrams PowerPoint Templates
We present our converging representation of flow chart 3 concepts Charts and Diagrams PowerPoint templates.Download our Circle Charts PowerPoint Templates because the mind is always whirring with new ideas. Download our Arrows PowerPoint Templates because this template helps you to motivate each and every one of your group to give it his very best. Download our Business PowerPoint Templates because the fruits of your labour are beginning to show.Enlighten them on the great plans you have for their enjoyment. Use our Shapes PowerPoint Templates because this diagram is designed to help your audience to develop their thoughts along the way. Download our Flow Charts PowerPoint Templates because Our PowerPoint Templates and Slides are topically designed to provide an attractive backdrop to any subject.Use these PowerPoint slides for presentations relating to 3d, abstract, aim, arrow, arrow sign, background, career, chart, circle, color, concept, curve, design, development, financial, flowing, forward, gain, graph, green, group, higher, illustration, increase, isolated, motion, moving up, onwards, path, positivity, prediction, progress, red, sales, series, shape, sign, success, symbol, target, turn, twisted, up, upload, upward, way, white, winner. The prominent colors used in the PowerPoint template are Orange, Green, Blue. Customers tell us our converging representation of flow chart 3 concepts Charts and Diagrams PowerPoint templates are Classic. PowerPoint presentation experts tell us our arrow PowerPoint templates and PPT Slides are Spectacular. People tell us our converging representation of flow chart 3 concepts Charts and Diagrams PowerPoint templates are Spectacular. People tell us our arrow PowerPoint templates and PPT Slides are Nostalgic. Customers tell us our converging representation of flow chart 3 concepts Charts and Diagrams PowerPoint templates are Spectacular. People tell us our chart PowerPoint templates and PPT Slides are Upbeat.

PowerPoint Templates Circular Flow Chart Ppt Theme
Flowchart is a simple mapping tool that shows the sequence of actions within a process. Flowchart is widely used in business, education and economic presentations to help the audience visualize the content better, or to find flaws in a process.

PowerPoint Templates Circular Flow Chart Ppt Themes
Flowchart is a simple mapping tool that shows the sequence of actions within a process. Flowchart is widely used in business, education and economic presentations to help the audience visualize the content better, or to find flaws in a process.
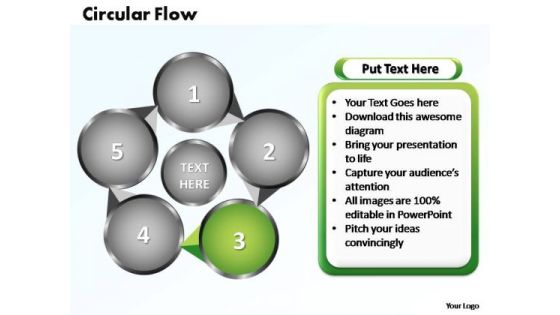
PowerPoint Templates Circular Flow Chart Ppt Design
Flowchart is a simple mapping tool that shows the sequence of actions within a process. Flowchart is widely used in business, education and economic presentations to help the audience visualize the content better, or to find flaws in a process.

PowerPoint Templates Circular Flow Chart Ppt Designs
Flowchart is a simple mapping tool that shows the sequence of actions within a process. Flowchart is widely used in business, education and economic presentations to help the audience visualize the content better, or to find flaws in a process.

PowerPoint Templates Circular Flow Chart Ppt Layouts
Flowchart is a simple mapping tool that shows the sequence of actions within a process. Flowchart is widely used in business, education and economic presentations to help the audience visualize the content better, or to find flaws in a process.
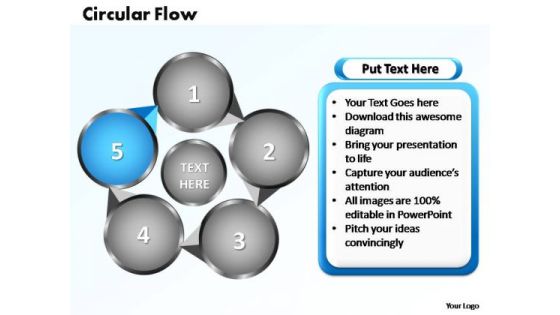
PowerPoint Templates Circular Flow Chart Ppt Slide
Flowchart is a simple mapping tool that shows the sequence of actions within a process. Flowchart is widely used in business, education and economic presentations to help the audience visualize the content better, or to find flaws in a process.
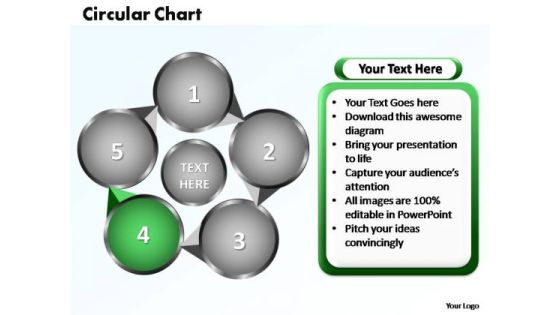
PowerPoint Templates Circular Flow Chart Ppt Slides
Flowchart is a simple mapping tool that shows the sequence of actions within a process. Flowchart is widely used in business, education and economic presentations to help the audience visualize the content better, or to find flaws in a process.
Chart Arrow Business PowerPoint Template 0610
Press the Button to get a Boost to Your Success! Glassy Golden Button with punching out Chart.

Business Data Analysis Chart Comparing Multiple Entities PowerPoint Templates
Analyze Ailments On Our business data analysis chart comparing multiple entities Powerpoint Templates. Bring Out The Thinking Doctor In You. Dock Your Thoughts With Our Financial Analysis . They Will Launch Them Into Orbit.

Corporate Bank Project Timeline Gantt Chart Infographics PDF
This slide shows the gantt chart for the corporate financial institution project timetable which assist in tracking the overall project on time Showcasing this set of slides titled Corporate Bank Project Timeline Gantt Chart Infographics PDF. The topics addressed in these templates are Chart, Corporate, Project. All the content presented in this PPT design is completely editable. Download it and make adjustments in color, background, font etc. as per your unique business setting.
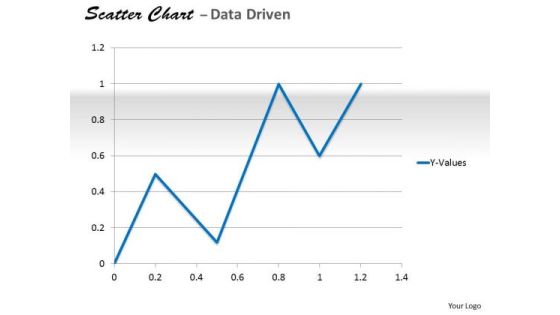
Data Analysis In Excel Analyzing Of Relationship Chart PowerPoint Templates
Delight Them With Our data analysis in excel analyzing of relationship chart Powerpoint Templates .
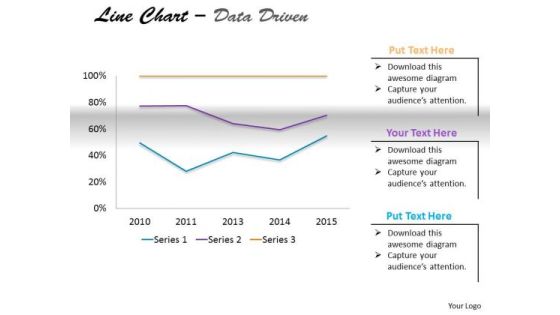
Multivariate Data Analysis Driven Market Line Chart PowerPoint Slides Templates
Delight Them With Our multivariate data analysis driven market line chart powerpoint slides Templates .
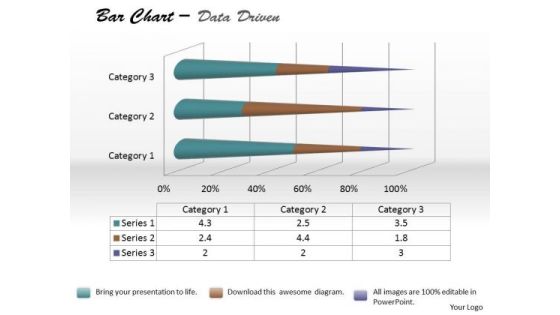
Data Analysis Bar Chart For Foreign Trade PowerPoint Templates
Be The Doer With Our data analysis bar chart for foreign trade Powerpoint Templates. Put Your Thoughts Into Practice.

Data Analysis Techniques 3d Grouped Bar Chart PowerPoint Templates
Place The Orders With Your Thoughts. Our data analysis techniques 3d grouped bar chart Powerpoint Templates Know The Drill.
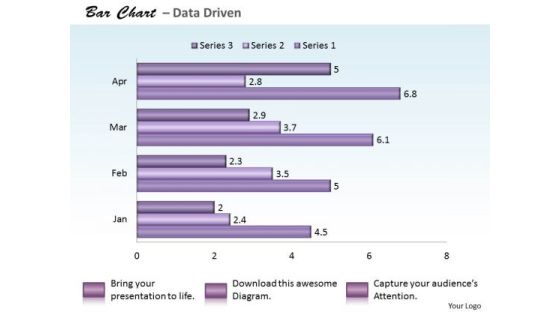
Quantitative Data Analysis Bar Chart For PowerPoint Templates
Reduce The Drag With Our quantitative data analysis bar chart for Powerpoint Templates . Give More Lift To Your Thoughts.
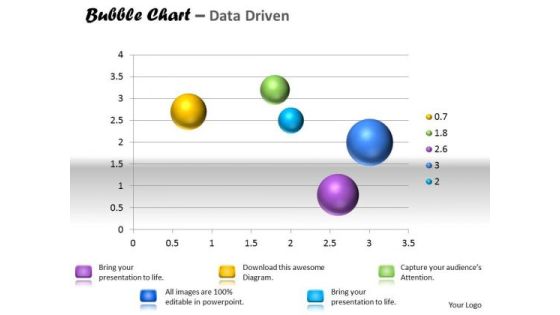
Data Analysis Template Interactive Bubble Chart PowerPoint Templates
Our data analysis template interactive bubble chart Powerpoint Templates Are A Wonder Drug. They Help Cure Almost Any Malaise.

Business Data Analysis Chart For Project PowerPoint Templates
Document Your Views On Our business data analysis chart for project Powerpoint Templates. They Will Create A Strong Impression.

Data Analysis Excel Business Tool Scatter Chart PowerPoint Templates
Dominate Proceedings With Your Ideas. Our data analysis excel business tool scatter chart Powerpoint Templates Will Empower Your Thoughts.
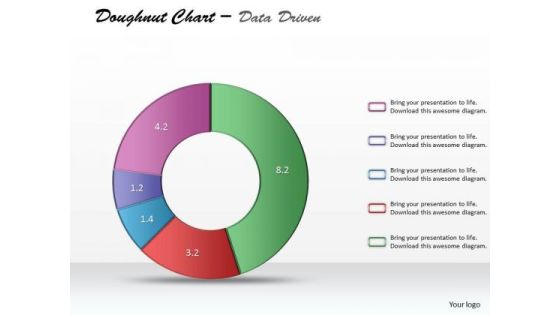
Data Analysis Excel Categorical Statistics Doughnut Chart PowerPoint Templates
Establish Your Dominion With Our data analysis excel categorical statistics doughnut chart Powerpoint Templates. Rule The Stage With Your Thoughts.
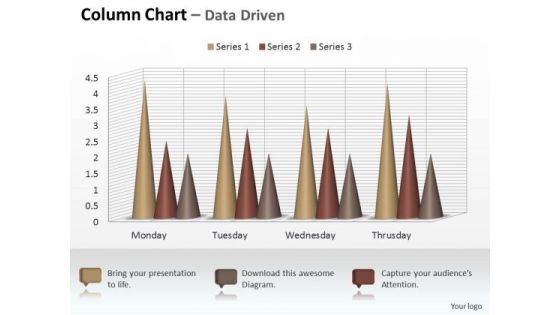
Marketing Data Analysis 3d Sets Of Column Chart PowerPoint Templates
Your Listeners Will Never Doodle. Our marketing data analysis 3d sets of column chart Powerpoint Templates Will Hold Their Concentration.
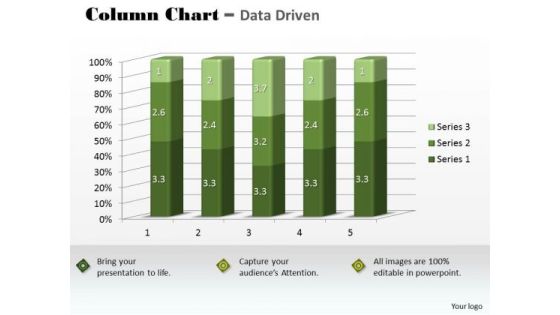
Marketing Data Analysis 3d Statistical Quality Control Chart PowerPoint Templates
Our marketing data analysis 3d statistical quality control chart Powerpoint Templates Abhor Doodling. They Never Let The Interest Flag.
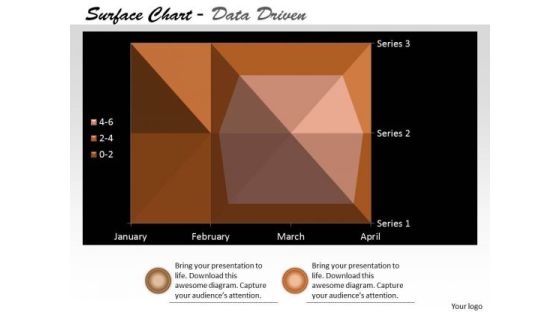
Multivariate Data Analysis Surface Chart Plots Trends PowerPoint Templates
Our multivariate data analysis surface chart plots trends Powerpoint Templates Heighten Concentration. Your Audience Will Be On The Edge.

Data Analysis Techniques 3d Effective Display Chart PowerPoint Templates
Dribble Away With Our data analysis techniques 3d effective display chart Powerpoint Templates . Score A Goal With Your Ideas.
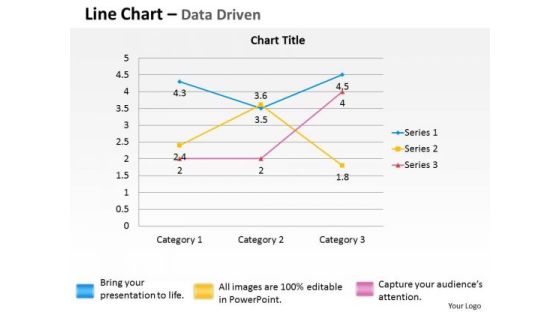
Quantitative Data Analysis Driven Economic Line Chart PowerPoint Slides Templates
Break The Deadlock With Our quantitative data analysis driven economic line chart powerpoint slides Templates . Let The Words Start To Flow.

Data Analysis Programs 3d Bar Chart To Dispaly PowerPoint Templates
Lower The Drawbridge With Our data analysis programs 3d bar chart to dispaly Powerpoint Templates . Capture The Minds Of Your Audience.

Data Analysis Template Forex Market Bar Chart PowerPoint Templates
Attract A Crowd With Our data analysis template forex market bar chart Powerpoint Templates . They Will Drop It All And Come To Hear You.
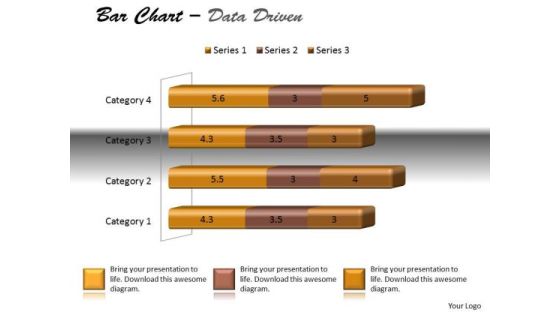
Data Analysis Techniques 3d Bar Chart For Modification PowerPoint Templates
Dreams Generate Thoughts, Thoughts Generate Ideas. Give Them Life With Our data analysis techniques 3d bar chart for modification Powerpoint Templates .
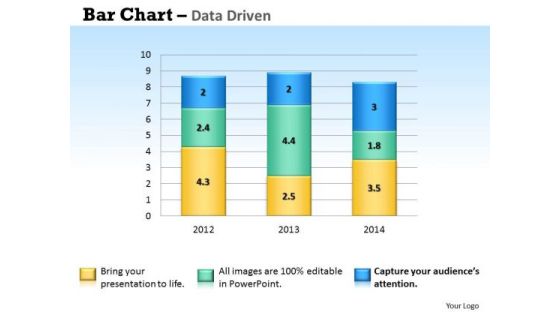
Microsoft Excel Data Analysis Bar Chart To Handle PowerPoint Templates
Our microsoft excel data analysis bar chart to handle Powerpoint Templates And Your Ideas Make A Great Doubles Pair. Play The Net With Assured Hands.
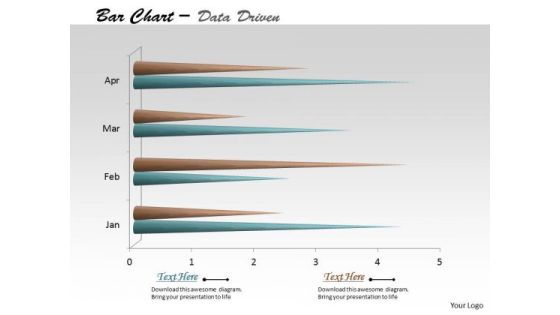
Multivariate Data Analysis Time Based Bar Chart PowerPoint Templates
Edit Your Work With Our multivariate data analysis time based bar chart Powerpoint Templates . They Will Help You Give The Final Form.

Quantitative Data Analysis Bar Chart For Different Categories PowerPoint Templates
Make Some Dough With Our quantitative data analysis bar chart for different categories Powerpoint Templates . Your Assets Will Rise Significantly.

Multivariate Data Analysis Numeric Values Surface Chart PowerPoint Templates
Your Grasp Of Economics Is Well Known. Help Your Audience Comprehend Issues With Our multivariate data analysis numeric values surface chart Powerpoint Templates .

Data Analysis In Excel Of Stock Chart PowerPoint Templates
Plan Your Storyboard With Our data analysis in excel of stock chart Powerpoint Templates . Give An Outline To The Solutions You Have.
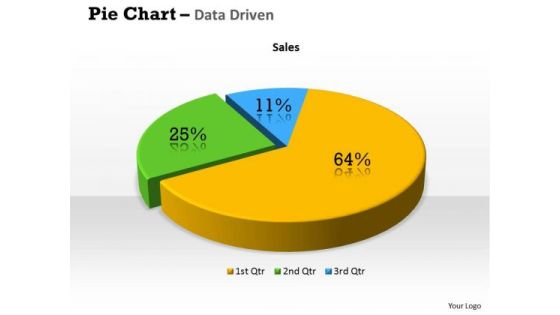
Quantitative Data Analysis 3d Percentage Ratio Pie Chart PowerPoint Templates
Plan Your Storyboard With Our quantitative data analysis 3d percentage ratio pie chart Powerpoint Templates . Give An Outline To The Solutions You Have.

Data Analysis Template Driven Visualization Area Chart PowerPoint Slides Templates
Draw On The Energy Of Our data analysis template driven visualization area chart powerpoint slides Templates . Your Thoughts Will Perk Up.
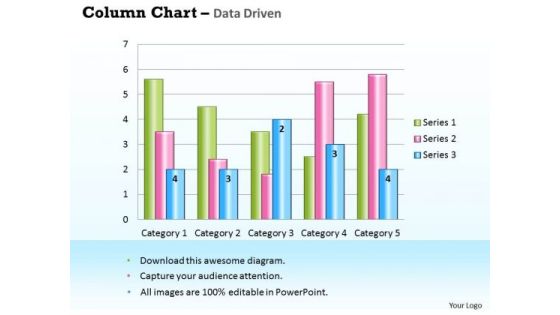
Business Data Analysis Chart For Case Studies PowerPoint Templates
Get Out Of The Dock With Our business data analysis chart for case studies Powerpoint Templates. Your Mind Will Be Set Free.
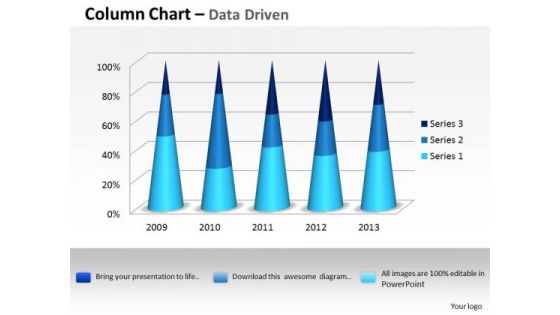
Data Analysis Excel 3d Process Variation Column Chart PowerPoint Templates
Put In A Dollop Of Our data analysis excel 3d process variation column chart Powerpoint Templates. Give Your Thoughts A Distinctive Flavor.

Data Analysis Excel Bubble Chart For Business Tasks PowerPoint Templates
Doll Up Your Thoughts With Our data analysis excel bubble chart for business tasks Powerpoint Templates. They Will Make A Pretty Picture.
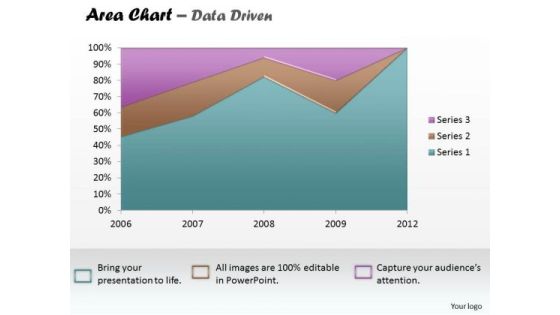
Data Analysis Excel Business Reporting Area Chart PowerPoint Templates
Establish The Dominance Of Your Ideas. Our data analysis excel business reporting area chart Powerpoint Templates Will Put Them On Top.

Data Analysis In Excel 3d Classification Of Chart PowerPoint Templates
With Our data analysis in excel 3d classification of chart Powerpoint Templates You Will Be Doubly Sure. They Possess That Stamp Of Authority.
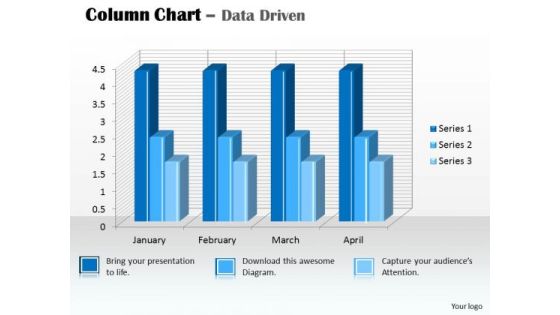
Data Analysis In Excel 3d Column Chart For PowerPoint Templates
Our data analysis in excel 3d column chart for Powerpoint Templates And Your Ideas Make A Great Doubles Pair. Play The Net With Assured Hands.

Data Analysis Techniques 3d In Segments Pie Chart PowerPoint Templates
Drink To The Success Of Your Campaign. Our data analysis techniques 3d in segments pie chart Powerpoint Templates Will Raise A Toast.
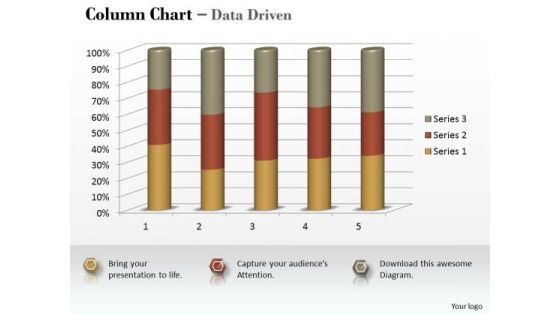
Marketing Data Analysis 3d Statistical Process Column Chart PowerPoint Templates
Be A Donor Of Great Ideas. Display Your Charity On Our marketing data analysis 3d statistical process column chart Powerpoint Templates .

Marketing Data Analysis 3d Statistical Process Control Chart PowerPoint Templates
Open Up Doors That Lead To Success. Our marketing data analysis 3d statistical process control chart Powerpoint Templates Provide The Handles.

Combo Chart Ppt PowerPoint Presentation Icon Format Ideas
This is a combo chart ppt powerpoint presentation icon format ideas. This is a three stage process. The stages in this process are bar, marketing, strategy, planning, growth.

Comparison Chart For Strategic Planning Analysis Ppt PowerPoint Presentation Example
This is a comparison chart for strategic planning analysis ppt powerpoint presentation example. This is a two stage process. The stages in this process are business, finance, marketing, strategy, success.

Bar Chart Ppt PowerPoint Presentation Infographic Template Skills
This is a bar chart ppt powerpoint presentation infographic template skills. This is a nine stage process. The stages in this process are sales in percentage, finance, business, marketing, strategy, success.

Volume High Low Close Chart Ppt PowerPoint Presentation Show Outfit
This is a volume high low close chart ppt powerpoint presentation show outfit. This is a five stage process. The stages in this process are business, strategy, marketing, success, finance, growth.
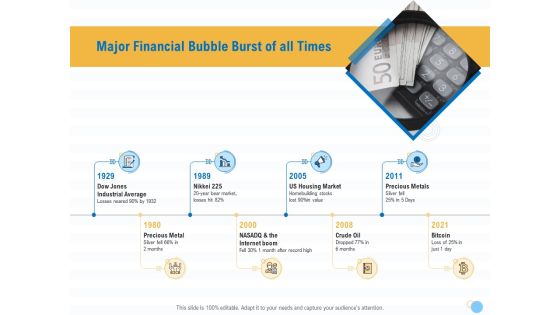
Great Recession In United States Major Financial Bubble Burst Of All Times Ppt Infographic Template Diagrams PDF
Presenting great recession in united states major financial bubble burst of all times ppt infographic template diagrams pdf to provide visual cues and insights. Share and navigate important information on eight stages that need your due attention. This template can be used to pitch topics like major financial bubble burst of all times. In addtion, this PPT design contains high resolution images, graphics, etc, that are easily editable and available for immediate download.
Dollar Sign With Arrow And Man For Financial Gain Vector Icon Ppt PowerPoint Presentation Gallery Styles PDF
Presenting this set of slides with name dollar sign with arrow and man for financial gain vector icon ppt powerpoint presentation gallery styles pdf. This is a three stage process. The stages in this process are dollar sign with arrow and man for financial gain vector icon. This is a completely editable PowerPoint presentation and is available for immediate download. Download now and impress your audience.
Five Steps In Linear Flow With Icons Sales Strategies And Financial Projections Ppt Powerpoint Presentation Ideas Information
This is a five steps in linear flow with icons sales strategies and financial projections ppt powerpoint presentation ideas information. This is a five stage process. The stages in this process are 7 point infographic, 7 steps infographic, 7 stages infographic.
Four Steps In Linear Flow With Icons Sales Strategies And Financial Projections Ppt Powerpoint Presentation Portfolio Deck
This is a four steps in linear flow with icons sales strategies and financial projections ppt powerpoint presentation portfolio deck. This is a four stage process. The stages in this process are 7 point infographic, 7 steps infographic, 7 stages infographic.
Nine Steps In Linear Flow With Icons Sales Strategies And Financial Projections Ppt Powerpoint Presentation Ideas Images
This is a nine steps in linear flow with icons sales strategies and financial projections ppt powerpoint presentation ideas images. This is a nine stage process. The stages in this process are 7 point infographic, 7 steps infographic, 7 stages infographic.
Seven Steps In Linear Flow With Icons Sales Strategies And Financial Projections Ppt Powerpoint Presentation Styles Graphics Example
This is a seven steps in linear flow with icons sales strategies and financial projections ppt powerpoint presentation styles graphics example. This is a seven stage process. The stages in this process are 7 point infographic, 7 steps infographic, 7 stages infographic.

Business Diagram Colored Column Chart For Result Analysis PowerPoint Slide
This Power Point diagram has been designed with graphic of column chart. It contains diagram of bar char depicting annual business progress report. Use this diagram to build professional presentations for your viewers.
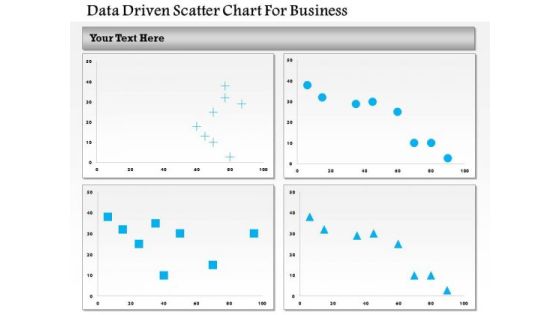
Business Diagram Data Driven Scatter Chart For Business PowerPoint Slide
This business diagram has been designed with four comparative charts. This slide suitable for data representation. You can also use this slide to present business analysis and reports. Use this diagram to present your views in a wonderful manner.

Business Diagram Laptop With Data Driven Area Chart PowerPoint Slide
This diagram has been designed with laptop and data driven area chart. Download this diagram to give your presentations more effective look. It helps in clearly conveying your message to clients and audience.

Business Diagram Flask With Data Driven Chart PowerPoint Slide
This data driven diagram has been designed with flask graphics. Download this diagram to give your presentations more effective look. It helps in clearly conveying your message to clients and audience.

Funding Pitch Deck To Obtain Long Term Debt From Banks Business Statistics Related To Operations And Financial Statements Graphics PDF
This slide provides information about some of the company financial and operational details such as Revenue, Worldwide Monthly Users, Global Market Share, Data Centers, number of consumers globally etc. This is a funding pitch deck to obtain long term debt from banks business statistics related to operations and financial statements graphics pdf template with various stages. Focus and dispense information on one stage using this creative set, that comes with editable features. It contains large content boxes to add your information on topics like revenue, social media, net income, global market share, data centres worldwide. You can also showcase facts, figures, and other relevant content using this PPT layout. Grab it now.
 Home
Home