Financial Chart

Financial Chart Ppt PowerPoint Presentation Outline Show
This is a financial chart ppt powerpoint presentation outline show. This is three stage process. The stages in this process are financial, minimum, medium, maximum.

Area Chart Financial Chart Ppt PowerPoint Presentation Design Ideas
This is a area chart financial chart ppt powerpoint presentation design ideas. This is two stage process. The stages in this process are finance, marketing, business, strategy, area chart.
Financial Chart Analysis Ppt PowerPoint Presentation Icon Vector Cpb
This is a financial chart analysis ppt powerpoint presentation icon vector cpb. This is a four stage process. The stages in this process are financial chart analysis.

Clustered Bar Financial Chart Ppt PowerPoint Presentation File Design Ideas
This is a clustered bar financial chart ppt powerpoint presentation file design ideas. This is a three stage process. The stages in this process are column chart, financial, business, marketing, planning, strategy.
Four Steps Financial Chart With Icons Powerpoint Slides
This business slide illustrates four steps financial chart. This PowerPoint template helps to exhibit process flow steps. Use this PowerPoint slide to build an exclusive presentation.

Mba Models And Frameworks Business Financial Chart Diagram Sales Diagram
Open Up Doors That Lead To Success. Our MBA Models And Frameworks Business Financial Chart Diagram Sales Diagram Powerpoint Templates Provide The Handles. Opportunity Will Come Knocking At Your Door. Welcome It With Our MBA Models And Frameworks Business Financial Chart Diagram Sales Diagram Powerpoint Templates.
Financial Chart For Investment Portfolio Management Vector Icon Rules PDF
Persuade your audience using this financial chart for investment portfolio management vector icon rules pdf. This PPT design covers three stages, thus making it a great tool to use. It also caters to a variety of topics including financial chart for investment portfolio management vector icon. Download this PPT design now to present a convincing pitch that not only emphasizes the topic but also showcases your presentation skills.
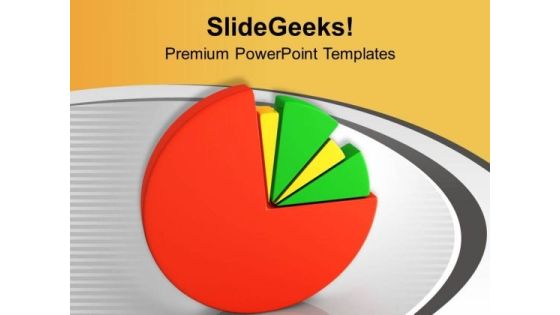
Financial Chart Representation PowerPoint Templates Ppt Backgrounds For Slides 0513
Our Financial Chart Representation PowerPoint Templates PPT Backgrounds For Slides will will follow the drill. They accomplish the task assigned to them. Do the drill with our Pie charts PowerPoint Templates. Your ideas will march ahead. Place the orders with your thoughts. Our Business PowerPoint Templates know the drill.
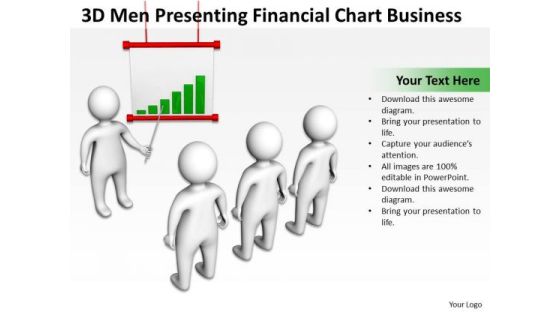
Business Model Diagram Examples Financial Chart PowerPoint Theme Slides
We present our business model diagram examples financial chart powerpoint theme Slides.Present our Business PowerPoint Templates because Our PowerPoint Templates and Slides will let you Hit the target. Go the full distance with ease and elan. Download and present our Finance PowerPoint Templates because You should Press the right buttons with our PowerPoint Templates and Slides. They will take your ideas down the perfect channel. Present our People PowerPoint Templates because You can Be the puppeteer with our PowerPoint Templates and Slides as your strings. Lead your team through the steps of your script. Use our Leadership PowerPoint Templates because You should Press the right buttons with our PowerPoint Templates and Slides. They will take your ideas down the perfect channel. Present our Success PowerPoint Templates because Our PowerPoint Templates and Slides have the Brilliant backdrops. Guaranteed to illuminate the minds of your audience.Use these PowerPoint slides for presentations relating to 3d, board, business, businessman, character, chart, communication, computer, concept, consultant, cooperation, cute, dialogue, discussion, empty, expert, expertise, figure, figurine, finance, financial, flipchart, graphic, group, growth, guy, human, icon, idea, leader, leadership, manager, meeting, men, paper, people, person, plan, pointing, present, profit, puppet, speaker, speech, team, teamwork, whiteboard. The prominent colors used in the PowerPoint template are Green, Red, White. Professionals tell us our business model diagram examples financial chart powerpoint theme Slides are second to none. Use our business PowerPoint templates and PPT Slides will make the presenter successul in his career/life. Use our business model diagram examples financial chart powerpoint theme Slides effectively help you save your valuable time. Customers tell us our concept PowerPoint templates and PPT Slides are designed to make your presentations professional. Presenters tell us our business model diagram examples financial chart powerpoint theme Slides will help you be quick off the draw. Just enter your specific text and see your points hit home. People tell us our character PowerPoint templates and PPT Slides are visually appealing.

Hiring Agency Profile With Financial Charts Ppt Model Example PDF
This graph or chart is linked to excel, and changes automatically based on data. Just left click on it and select edit data. Pitch your topic with ease and precision using this hiring agency profile with financial charts ppt model example pdf. This layout presents information on revenue, operating income, operating margin, satisfaction rate. It is also available for immediate download and adjustment. So, changes can be made in the color, design, graphics or any other component to create a unique layout.
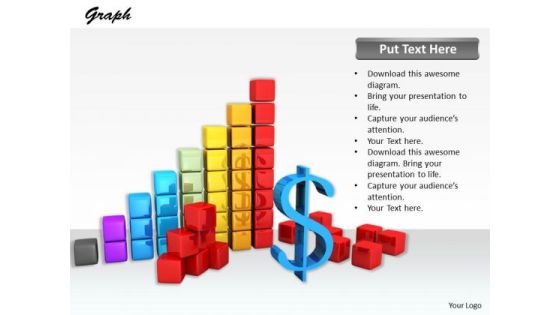
Stock Photo Design Of Financial Charts And Reports PowerPoint Slide
This image slide has been professionally designed to give complete look to your business presentations. This image is designed with graphics of business reports and charts. Use this image in marketing and sales related presentations.

Financial Growth Chart Ppt Background Designs
This is a financial growth chart ppt background designs. This is a five stage process. The stages in this process are financial growth.\n\n\n\n\n\n\n\n\n\n\n\n\n\n\n\n\n\n
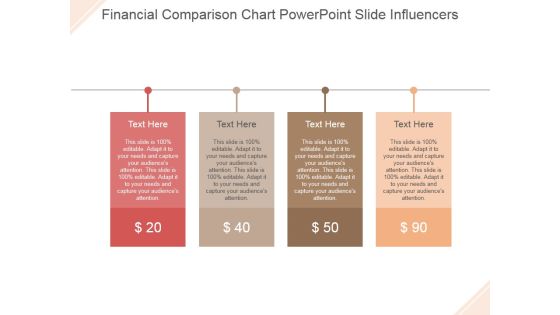
Financial Comparison Chart Ppt PowerPoint Presentation Styles
This is a financial comparison chart ppt powerpoint presentation styles. This is a four stage process. The stage in this process are dollar, business, symbol, finance, management.

Coverage Financial Ratios Chart For 5 Financial Years Themes PDF
This slide illustrates graph for coverage ratios that are interest coverage ratio, debt service coverage ratio and asset coverage ratio. It showcases comparison for a period of 5 years that can help company to measure ability to service its debt and meet its financial obligations Showcasing this set of slides titled coverage financial ratios chart for 5 financial years themes pdf. The topics addressed in these templates are coverage financial ratios chart for 5 financial years. All the content presented in this PPT design is completely editable. Download it and make adjustments in color, background, font etc. as per your unique business setting.

Financial Chart For Current And Quick Financial Ratios Comparison Brochure PDF
This slide showcases current and quick ratio graph that can help to evaluate companys liquidity and and assess the company abilities to pay off debt. It also showcases comparison of ratio with previous financial year Pitch your topic with ease and precision using this financial chart for current and quick financial ratios comparison brochure pdf. This layout presents information on financial chart for current and quick financial ratios comparison. It is also available for immediate download and adjustment. So, changes can be made in the color, design, graphics or any other component to create a unique layout.

Financial Chart Showing Year Over Year Analysis Ppt PowerPoint Presentation Styles Design Ideas
Presenting this set of slides with name financial chart showing year over year analysis ppt powerpoint presentation styles design ideas. The topics discussed in these slide is financial chart showing year over year analysis. This is a completely editable PowerPoint presentation and is available for immediate download. Download now and impress your audience.

Business Goal Icon With A Financial Chart Ppt PowerPoint Presentation Model Ideas PDF
Presenting business goal icon with a financial chart ppt powerpoint presentation model ideas pdf to dispense important information. This template comprises three stages. It also presents valuable insights into the topics including business goal icon with a financial chart. This is a completely customizable PowerPoint theme that can be put to use immediately. So, download it and address the topic impactfully.

Financial Chart Showing Business Life Cycle Ppt PowerPoint Presentation Gallery Designs PDF
Introducing our financial chart showing business life cycle ppt powerpoint presentation gallery designs pdf set of slides. The topics discussed in these slides are sales, profits, business. This is an immediately available PowerPoint presentation that can be conveniently customized. Download it and convince your audience.

Business Presentation Shows Financial Chart Of Year PowerPoint Templates Ppt Backgrounds For Slides
Our Business Presentation Shows Financial Chart Of Year PowerPoint Templates PPT Backgrounds For Slides help in a duel of wits. They get your ideas to come out on top. Our finance PowerPoint Templates play a dual role. They aid and abet you in your endeavour. Win any duel with our business PowerPoint Templates. Your thoughts will be faster on the draw.

Business Presentation Shows Financial Chart PowerPoint Templates Ppt Backgrounds For Slides 0513
Our Business Presentation Shows Financial Chart PowerPoint Templates PPT Backgrounds For Slides help in a duel of wits. They get your ideas to come out on top. Our finance PowerPoint Templates play a dual role. They aid and abet you in your endeavour. Win any duel with our business PowerPoint Templates. Your thoughts will be faster on the draw.

Businessmen Presenting Financial Chart PowerPoint Templates Ppt Backgrounds For Slides 0613
Open Up Doors That Lead To Success. Our Businessmen Presenting Financial Chart Power Point Templates PPT Backgrounds For Slides Provide The Handles. Opportunity Will Come Knocking At Your Door. Welcome It With Our Leadership Power Point Templates. Our Business Power Point Templates Abhor Doodling. They Never Let The Interest Flag.
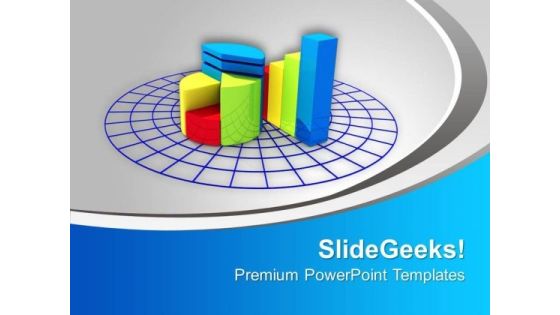
Multicolored Financial Chart Marketing PowerPoint Templates Ppt Backgrounds For Slides 0313
We present our Multicolored Financial Chart Marketing PowerPoint Templates PPT Backgrounds For Slides 0313.Use our Finance PowerPoint Templates because It will mark the footprints of your journey. Illustrate how they will lead you to your desired destination. Present our Marketing PowerPoint Templates because You have a driving passion to excel in your field. Our PowerPoint Templates and Slides will prove ideal vehicles for your ideas. Download our Signs PowerPoint Templates because Our PowerPoint Templates and Slides will bullet point your ideas. See them fall into place one by one. Download and present our Shapes PowerPoint Templates because Our PowerPoint Templates and Slides will bullet point your ideas. See them fall into place one by one. Use our Business PowerPoint Templates because It will let you Set new benchmarks with our PowerPoint Templates and Slides. They will keep your prospects well above par.Use these PowerPoint slides for presentations relating to Multicolored Chart, signs, finance, marketing, business, shapes. The prominent colors used in the PowerPoint template are Green, Blue, Red.

Financial Charts And Graphs For Statistical Analysis Ppt Powerpoint Presentation Show Layout
This is a financial charts and graphs for statistical analysis ppt powerpoint presentation show layout. This is a four stage process. The stages in this process are business metrics, business kpi, business dashboard.
Financial Charts Data Analysis Vector Icon Ppt PowerPoint Presentation Visual Aids Summary Cpb
This is a financial charts data analysis vector icon ppt powerpoint presentation visual aids summary cpb. This is a three stage process. The stages in this process are data analysis, analytics architecture, analytics framework.

Financial Marketing Organization Chart Presentation Ideas
This is a financial marketing organization chart presentation ideas. This is a five stage process. The stages in this process are financial system, financial institutions, financial markets, financial instruments, financial services.\n\n

Column Chart Financial Ppt PowerPoint Presentation Information
This is a column chart financial ppt powerpoint presentation information. This is a three stage process. The stages in this process are business, management, marketing, percentage, product.
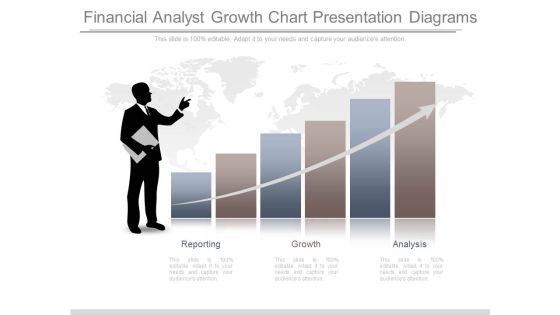
Financial Analyst Growth Chart Presentation Diagrams
This is a financial analyst growth chart presentation diagrams. This is a three stage process. The stages in this process are reporting, growth, analysis.

Advisor Financial Marketing Plan Chart Presentation Ideas
This is a advisor financial marketing plan chart presentation ideas. This is a two stage process. The stages in this process are product service price, feature, benefit.

Business Profile Of It Company With Financial Charts Ppt PowerPoint Presentation Model Ideas PDF
Deliver and pitch your topic in the best possible manner with this business profile of it company with financial charts ppt powerpoint presentation model ideas pdf. Use them to share invaluable insights on the company reported strong financials in last five years, operating income, net income and impress your audience. This template can be altered and modified as per your expectations. So, grab it now.

Financial Marketing Solutions Chart Presentation Ideas
This is a financial marketing solutions chart presentation ideas. This is a eight stage process. The stages in this process are direct deposits, e commerce, prepaid cards, bill payments, money orders, small loans, mobile transaction, international money transfer.
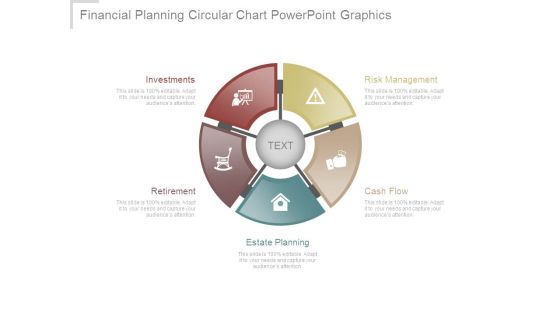
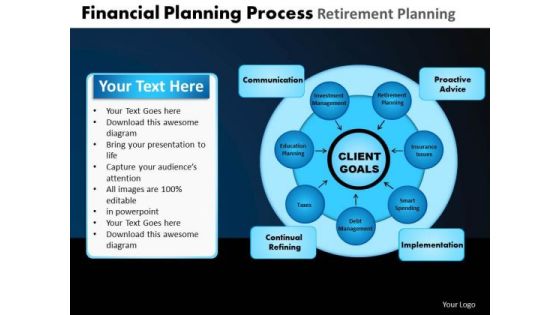
Financial Planning Circular Chart Powerpoint Graphics
This is a financial planning circular chart powerpoint graphics. This is a five stage process. The stages in this process are risk management, cash flow, estate planning, retirement, investments.

Financial Logistics Pyramid Chart Presentation Ideas
This is a financial logistics pyramid chart presentation ideas. This is a five stage process. The stages in this process are advice, risk management, liquidity management, cash flow management, payments and receivables.

Financial Investments Pie Chart Design Powerpoint Show
This is a financial investments pie chart design powerpoint show. This is a eight stage process. The stages in this process are stocks, real estate, mutual funds, precious metal, bonds, art, collectibles, antiques.

Financial Analysis Progressive Chart Powerpoint Slide Download
This is a financial analysis progressive chart powerpoint slide download. This is a three stage process. The stages in this process are 3 point 4 percent dollar 832 point 5m, 7 point 5 percent dollar 435 point 2 m, 10 point 1 percent dollar 721 point 8m.
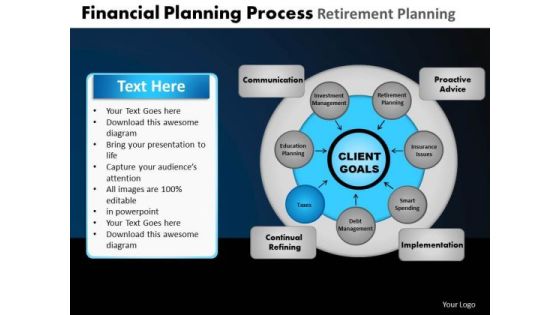
PowerPoint Slides Chart Financial Planning Ppt Template
PowerPoint Slides Chart Financial Planning PPT Template-These high quality powerpoint pre-designed slides and powerpoint templates have been carefully created by our professional team to help you impress your audience. All slides have been created and are 100% editable in powerpoint. Each and every property of any graphic - color, size, orientation, shading, outline etc. can be modified to help you build an effective powerpoint presentation. Any text can be entered at any point in the powerpoint template or slide. Simply DOWNLOAD, TYPE and PRESENT!
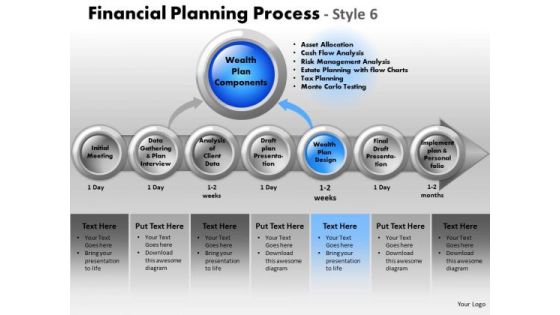
PowerPoint Backgrounds Chart Financial Planning Ppt Layout
PowerPoint Backgrounds Chart Financial Planning PPT Layout-These high quality powerpoint pre-designed slides and powerpoint templates have been carefully created by our professional team to help you impress your audience. All slides have been created and are 100% editable in powerpoint. Each and every property of any graphic - color, size, orientation, shading, outline etc. can be modified to help you build an effective powerpoint presentation. Any text can be entered at any point in the powerpoint template or slide. Simply DOWNLOAD, TYPE and PRESENT!
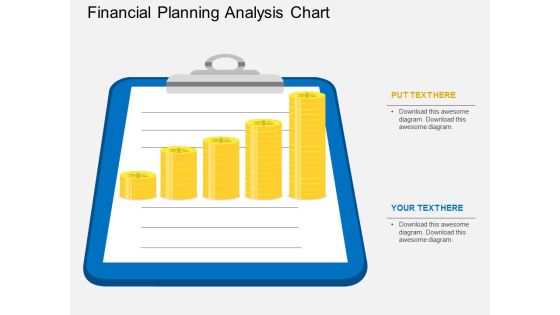
Financial Planning Analysis Chart Powerpoint Template
This PowerPoint slide contains graphics of note pad with gold coins. This professional slide may be used to display financial planning, report and analysis. Adjust the above diagram in your business presentations to give professional impact.

Financial Pie Chart Marketing PowerPoint Templates And PowerPoint Themes 0912
Financial pie Chart Marketing PowerPoint Templates And PowerPoint Themes 0912-Microsoft Powerpoint Templates and Background with pie chart

Operational Flow Of Financial Services Chart Example Of Ppt
This is a operational flow of financial services chart example of ppt. This is a five stage process. The stages in this process are customer, mobile, atm, employees, high finance trading.
Woman Showing Financial Modelling Chart Vector Icon Diagrams PDF
Persuade your audience using this woman showing financial modelling chart vector icon diagrams pdf. This PPT design covers three stages, thus making it a great tool to use. It also caters to a variety of topics including woman showing financial modelling chart vector icon. Download this PPT design now to present a convincing pitch that not only emphasizes the topic but also showcases your presentation skills.

Debt To Equity Financial Ratios Chart Comparison Download PDF
This slide illustrates debt to equity ratio graph that can help to evaluate total debt and financial liabilities against the total shareholders equity. It showcases comparison for a period of last four quarters Pitch your topic with ease and precision using this debt to equity financial ratios chart comparison download pdf. This layout presents information on debt to equity financial ratios chart comparison. It is also available for immediate download and adjustment. So, changes can be made in the color, design, graphics or any other component to create a unique layout.
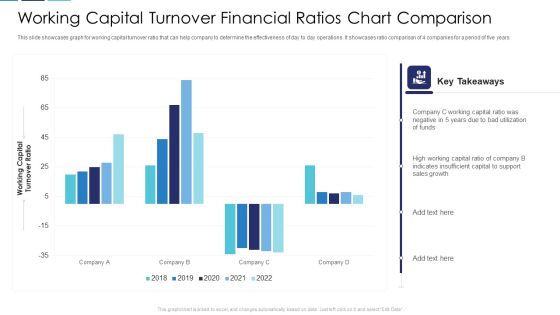
Working Capital Turnover Financial Ratios Chart Comparison Clipart PDF
This slide showcases graph for working capital turnover ratio that can help company to determine the effectiveness of day to day operations. It showcases ratio comparison of 4 companies for a period of five years Pitch your topic with ease and precision using this working capital turnover financial ratios chart comparison clipart pdf. This layout presents information on working capital turnover financial ratios chart comparison. It is also available for immediate download and adjustment. So, changes can be made in the color, design, graphics or any other component to create a unique layout.

Dividend Payout Financial Ratios Chart Comparison Themes PDF
This slide showcases dividend payout ratio graph that can help organization to determine the percentage of the companys earnings that is paid out to shareholders by way of dividend. It showcases comparison for a period of 8 years Showcasing this set of slides titled dividend payout financial ratios chart comparison themes pdf. The topics addressed in these templates are dividend payout financial ratios chart comparison. All the content presented in this PPT design is completely editable. Download it and make adjustments in color, background, font etc. as per your unique business setting.

Price To Earning Financial Ratios Chart Comparison Slides PDF
This slide illustrates P or E ratio graph that can help company to measures its current share price relative to its per-share earnings. It showcases comparison for last 5 years Showcasing this set of slides titled price to earning financial ratios chart comparison slides pdf. The topics addressed in these templates are price to earning financial ratios chart comparison. All the content presented in this PPT design is completely editable. Download it and make adjustments in color, background, font etc. as per your unique business setting.

Company Turnover Financial Ratios Chart Comparison Icons PDF
This slide illustrates graph for turnover ratios that are accounts receivable, inventory turnover, accounts payable turnover, fixed asset turnover and total assets turnover ratio. It showcases comparison of three companies. Pitch your topic with ease and precision using this company turnover financial ratios chart comparison icons pdf. This layout presents information on company turnover financial ratios chart comparison. It is also available for immediate download and adjustment. So, changes can be made in the color, design, graphics or any other component to create a unique layout.

Inventory Turnover Financial Ratios Chart Conversion Portrait PDF
This slide illustrates graph for inventory turnover ratio that can help company to analyze efficiency of inventory management. It showcases ratio graph comparison of 4 companies for a period of last 6 years Pitch your topic with ease and precision using this inventory turnover financial ratios chart conversion portrait pdf. This layout presents information on inventory turnover financial ratios chart conversion. It is also available for immediate download and adjustment. So, changes can be made in the color, design, graphics or any other component to create a unique layout.
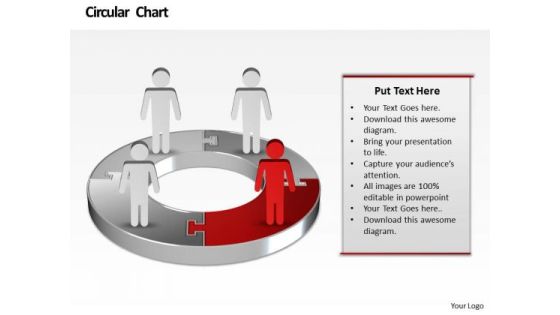
Ppt Illustration Of Financial Pie Chart Marketing Presentation PowerPoint Templates
PPT illustration of financial pie chart marketing presentation powerpoint Templates-You have the people in place, selected the team leaders and all are raring to go. You have the plans ready for them to absorb and understand. Educate your team with your thoughts and logic. -PPT illustration of financial pie chart marketing presentation powerpoint Templates-Abstract, Access, Arrow, Background, Business, Chart, Circle, Concept, Conceptual, Connection, Corporate, Creative, Cycle, Design, Different, Element, Empty, Form, Frame, Graphic, Group, Idea, Illustration, Part, Piece, Place, Process, Red, Shapes, Solution, Special, Speech, Strategy, Symbol

Business Diagram Three Circular Financial Pie Chart PowerPoint Template
This power point template has been designed with graphic of three circular pie chart. This pie chart is suitable for financial data representation. Use this PPt for your business and finance related presentations.

Financial Ratios Chart Ppt PowerPoint Presentation Complete Deck With Slides
Pitch yourself both in house and outside by utilizing this complete deck. This financial ratios chart ppt powerpoint presentation complete deck with slides focuses on key fundamentals of the topic, displayed using different slides. With a total of fifteen slides, this template is the best tool you can use to persuade your audience. It will not only help you create great presentations but also induce strategic thinking because of its well researched content and graphics. You can easily personalize any of the elements to suit your unique business setting. Additionally, it can be saved in PNG, JPG, and PDF formats to save your time and resources.

Financial Arrows Chart Business PowerPoint Backgrounds And Templates 1210
Microsoft PowerPoint Template and Background with fine image 3d of financial business graph
Financial Pie Chart Business PowerPoint Themes And PowerPoint Slides 0411
Microsoft PowerPoint Theme and Slide with pie chart

Financial Pie Chart Success PowerPoint Themes And PowerPoint Slides 0411
Microsoft PowerPoint Theme and Slide with pie chart banner
Financial Pie Chart Business PowerPoint Templates And PowerPoint Backgrounds 0411
Microsoft PowerPoint Template and Background with pie chart

Financial Pie Chart Success PowerPoint Templates And PowerPoint Backgrounds 0411
Microsoft PowerPoint Template and Background with pie chart banner
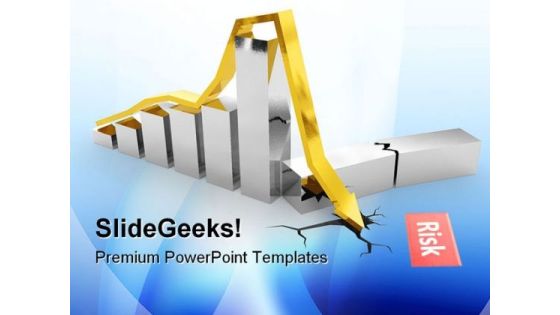
Financial Crisis Chart Business PowerPoint Templates And PowerPoint Backgrounds 0811
Microsoft PowerPoint Template and Background with steel crisis chart with golden arrow dropped into crack
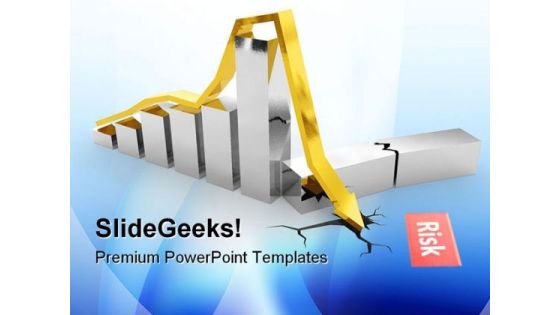
Financial Crisis Chart Business PowerPoint Themes And PowerPoint Slides 0811
Microsoft PowerPoint Theme and Slide with steel crisis chart with golden arrow dropped into crack in white surface

Chart For Financial Percentage Analysis Powerpoint Slides
This PowerPoint template has been designed with financial chart with dollar icon. This PPT slide may be used to display dollar value analysis chart. Download this slide to build unique presentation.
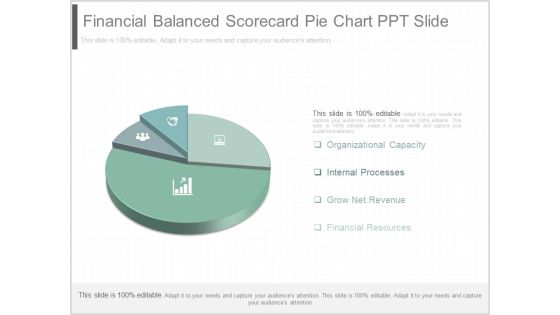
Financial Balanced Scorecard Pie Chart Ppt Slide
This is a financial balanced scorecard pie chart ppt slide. This is a four stage process. The stages in this process are organizational capacity, internal processes, grow net revenue, financial resources.

Financial Public Relations Arrows Chart Powerpoint Templates
This is a financial public relations arrows chart powerpoint templates. This is a five stage process. The stages in this process are investor relations, consumer relations, government relations, public relations, internal communications, crisis communications.

Agile Org Chart It Financial Mockup PDF
Deliver an awe inspiring pitch with this creative agile org chart it financial mockup pdf bundle. Topics like minimum, medium, maximum can be discussed with this completely editable template. It is available for immediate download depending on the needs and requirements of the user.

Financial Growth Analysis Circular Chart Powerpoint Slides
Visually support your presentation with our above template containing graphics of circular chart. This diagram slide helps to display financial growth analysis. Etch your views in the brains of your audience with this diagram slide.

Column Chart For Financial Analysis Powerpoint Slides
This PowerPoint template has been designed with graphics of column chart with percentage values. You may use this business slide design for topics like financial analysis and planning. This PPT slide is powerful tool to describe your ideas.

Financials Summary Comparison Chart Powerpoint Show
This is a financials summary comparison chart powerpoint show. This is a three stage process. The stages in this process are revenue, cost of sales, gross profit, customer acquisition cost, other operating cost expense, operating profit, change in cash, ending cash, employees.

Bar Chart Financial Ppt PowerPoint Presentation Pictures Files
This is a bar chart financial ppt powerpoint presentation pictures files. This is a five stage process. The stages in this process are finance, marketing, management, investment, analysis.

Area Chart Financial Ppt PowerPoint Presentation Styles Templates
This is a area chart financial ppt powerpoint presentation styles templates. This is a two stage process. The stages in this process are finance, marketing, management, investment, analysis.

Area Chart Financial Ppt PowerPoint Presentation Layouts Slide
This is a area chart financial ppt powerpoint presentation layouts slide. This is a three stage process. The stages in this process are finance, marketing, management, investment, analysis.

Area Chart Financial Ppt PowerPoint Presentation Inspiration Topics
This is a area chart financial ppt powerpoint presentation inspiration topics. This is a three stage process. The stages in this process are finance, marketing, management, investment, analysis.

Area Chart Financial Ppt PowerPoint Presentation Model Background
This is a area chart financial ppt powerpoint presentation model background. This is a two stage process. The stages in this process are finance, marketing, management, investment, analysis.

Combo Chart Financial Ppt PowerPoint Presentation Layouts Layouts
This is a combo chart financial ppt powerpoint presentation layouts layouts. This is a three stage process. The stages in this process are finance, marketing, management, investment, analysis.

Area Chart Financial Ppt PowerPoint Presentation Outline Information
This is a area chart financial ppt powerpoint presentation outline information. This is a three stage process. The stages in this process are percentage, product, business, management, marketing.

Scatter Chart Financial Ppt PowerPoint Presentation Model Deck
This is a scatter chart financial ppt powerpoint presentation model deck. This is a one stage process. The stages in this process are business, management, marketing, percentage, product.

Financial Budget Spend Chart For Company Operations Icon Pictures PDF
Presenting Financial Budget Spend Chart For Company Operations Icon Pictures PDF to dispense important information. This template comprises Three stages. It also presents valuable insights into the topics including Financial Budget Spend, Chart For Company, Operations Icon. This is a completely customizable PowerPoint theme that can be put to use immediately. So, download it and address the topic impactfully.
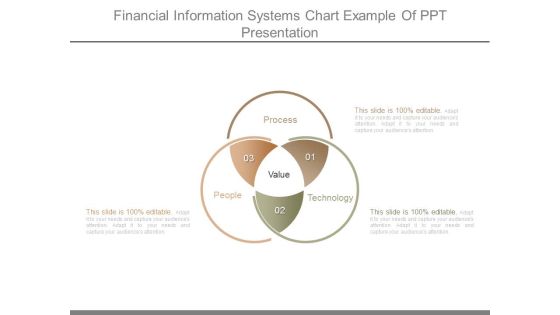
Financial Information Systems Chart Example Of Ppt Presentation
This is a financial information systems chart example of ppt presentation. This is a three stage process. The stages in this process are process, people, value, technology.

Column Chart Financial Ppt PowerPoint Presentation Outline Design Templates
This is a column chart financial ppt powerpoint presentation outline design templates. This is a two stage process. The stages in this process are financial, business, marketing, planning, strategy.

Income Statement Financial Waterfall Model Chart Elements PDF
The following slide exhibits waterfall chart to visualize adjustments made to initial value. It presents information related to gross profit, salaries, tax, other income, etc. Showcasing this set of slides titled Income Statement Financial Waterfall Model Chart Elements PDF. The topics addressed in these templates are Income, Statement Financial, Model Chart. All the content presented in this PPT design is completely editable. Download it and make adjustments in color, background, font etc. as per your unique business setting.

Area Chart Financial Ppt PowerPoint Presentation Outline Professional
This is a area chart financial ppt powerpoint presentation outline professional. This is a four stage process. The stages in this process are product, sales in percentage, financial year.
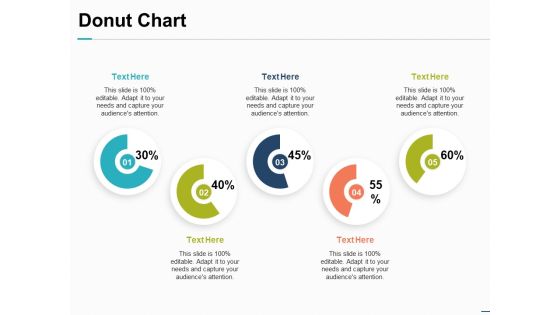
Donut Chart Financial Investment Ppt PowerPoint Presentation Inspiration Introduction
This is a donut chart financial investment ppt powerpoint presentation inspiration introduction. This is a five stage process. The stages in this process are finance, marketing, management, investment, analysis.

Circular Chart Financial Analysis Team Management Ppt PowerPoint Presentation Guide
This is a circular chart financial analysis team management ppt powerpoint presentation guide. This is a four stage process. The stages in this process are puzzle, teamwork, business, marketing, analysis.

Fixed Asset Turnover Financial Ratios Comparison Chart Structure PDF
This slide showcases graph for fixed asset turnover ratio that can help to identify how efficiently a company is a generating sales with its machinery and equipment. It showcases comparison of ratio of three companies for a period of 5 financial years Showcasing this set of slides titled fixed asset turnover financial ratios comparison chart structure pdf. The topics addressed in these templates are fixed asset turnover financial ratios comparison chart. All the content presented in this PPT design is completely editable. Download it and make adjustments in color, background, font etc. as per your unique business setting.

BPO For Managing Enterprise Financial Transactions Bar Chart Topics PDF
Presenting this set of slides with name bpo for managing enterprise financial transactions bar chart topics pdf. The topics discussed in these slide is bar chart. This is a completely editable PowerPoint presentation and is available for immediate download. Download now and impress your audience.

Outsource Bookkeeping Service Manage Financial Transactions Bar Chart Inspiration PDF
Presenting this set of slides with name outsource bookkeeping service manage financial transactions bar chart inspiration pdf. The topics discussed in these slide is bar chart. This is a completely editable PowerPoint presentation and is available for immediate download. Download now and impress your audience.
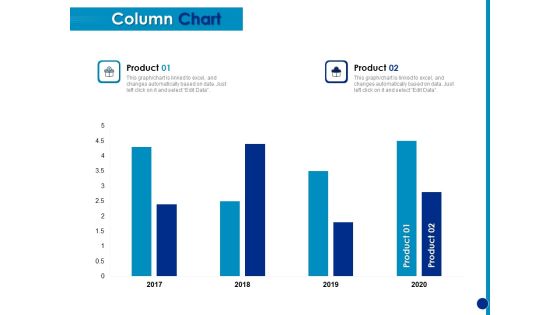
Generating Financial Support Column Chart Ppt Ideas Mockup PDF
Presenting this set of slides with name generating financial support column chart ppt ideas mockup pdf. The topics discussed in these slide is column chart. This is a completely editable PowerPoint presentation and is available for immediate download. Download now and impress your audience.

BPO For Managing Enterprise Financial Transactions Area Chart Brochure PDF
Presenting this set of slides with name bpo for managing enterprise financial transactions area chart brochure pdf. The topics discussed in these slide is area chart. This is a completely editable PowerPoint presentation and is available for immediate download. Download now and impress your audience.
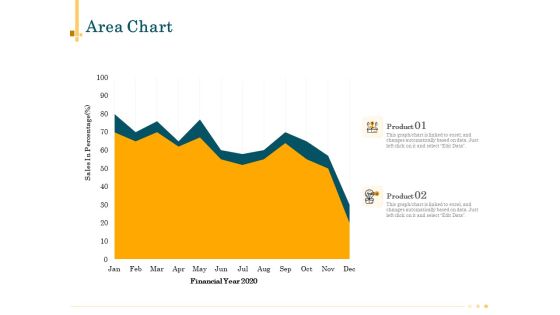
Outsource Bookkeeping Service Manage Financial Transactions Area Chart Sample PDF
Presenting this set of slides with name outsource bookkeeping service manage financial transactions area chart sample pdf. The topics discussed in these slide is area chart. This is a completely editable PowerPoint presentation and is available for immediate download. Download now and impress your audience.

Area Chart Financial Year Ppt PowerPoint Presentation Styles Mockup
Presenting this set of slides with name area chart financial year ppt powerpoint presentation styles mockup. The topics discussed in these slides are finance, marketing, management, investment, analysis. This is a completely editable PowerPoint presentation and is available for immediate download. Download now and impress your audience.

Financial Management Workflow Chart Ppt PowerPoint Presentation Infographics Mockup PDF
Presenting this set of slides with name financial management workflow chart ppt powerpoint presentation infographics mockup pdf. This is a nine stage process. The stages in this process are build advance financial controls, control analysis review, indent report remediate and review incidents, remediate and review results, import pre build models, import pre build models, collect configuration data, manage control. This is a completely editable PowerPoint presentation and is available for immediate download. Download now and impress your audience.

Business Chart Financial PowerPoint Templates And PowerPoint Backgrounds 0411
Microsoft PowerPoint Template and Background with business graph at chart is going up for success

Four Circles Chart Financial Growth Steps Powerpoint Slides
Our professionally designed business diagram is as an effective tool for communicating cyclic processes. It contains circular graphics with icons. Above slide is suitable to display process management steps.

Financial Waterfall Chart For Data Visualization Ppt PowerPoint Presentation Ideas Elements
This is a financial waterfall chart for data visualization ppt powerpoint presentation ideas elements. This is a five stage process. The stages in this process are sales waterfall, waterfall chart, business.
Manager Analyzing Trends From Financial Modelling Chart Vector Icon Portrait PDF
Persuade your audience using this manager analyzing trends from financial modelling chart vector icon portrait pdf. This PPT design covers three stages, thus making it a great tool to use. It also caters to a variety of topics including manager analyzing trends from financial modelling chart vector icon. Download this PPT design now to present a convincing pitch that not only emphasizes the topic but also showcases your presentation skills.

Company Profitability Financial Ratios Chart Comparison With Industry Average Download PDF
This slide illustrates graph for profitability ratio that can help to evaluate how efficiently a company generates profit and value for shareholders. It showcases ratio comparison of four companies with industry average Showcasing this set of slides titled company profitability financial ratios chart comparison with industry average download pdf. The topics addressed in these templates are company profitability financial ratios chart comparison with industry average. All the content presented in this PPT design is completely editable. Download it and make adjustments in color, background, font etc. as per your unique business setting.

Financial Pie Chart For Marketing PowerPoint Templates Ppt Backgrounds For Slides 0513
Transfer the dossier onto our Financial Pie Chart For Marketing PowerPoint Templates PPT Backgrounds For Slides. Share your views on an open platform. Double the impact with our marketing PowerPoint Templates. Your thoughts will have an imposing effect. Knead the dough with our pie charts PowerPoint Templates. Your thoughts will come up well.

Financial Growth Chart For Business PowerPoint Templates Ppt Backgrounds For Slides 0713
Double your chances with our Financial Growth Chart For Business PowerPoint Templates PPT Backgrounds For Slides. The value of your thoughts will increase two-fold. Charm the audience with your thoughts. Add our Pie Charts PowerPoint Templates and they will be dotty for you. Double up our Business PowerPoint Templates with your thoughts. They will make an awesome pair.

Financial Growth Chart With Fluctuation PowerPoint Templates Ppt Backgrounds For Slides 0513
Transfer the dossier onto our Financial Growth Chart With Fluctuation PowerPoint Templates PPT Backgrounds For Slides. Share your views on an open platform. Double the impact with our money PowerPoint Templates. Your thoughts will have an imposing effect. Knead the dough with our finance PowerPoint Templates. Your thoughts will come up well.
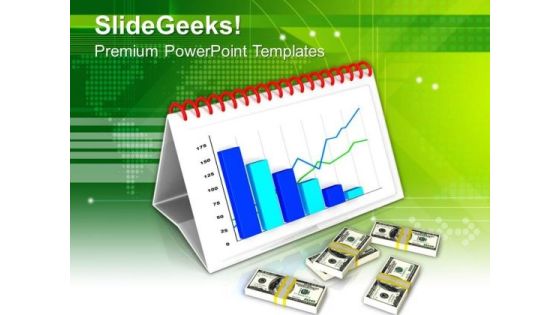
Monthly Financial Growth Chart PowerPoint Templates Ppt Backgrounds For Slides 0713
Give them a dose of your ability. It will go down well with our Monthly Financial Growth Chart PowerPoint Templates PPT Backgrounds For Slides. Connect the dots with our Business PowerPoint Templates. Watch the whole picture clearly emerge. Dot your thoughts with our Money PowerPoint Templates. Give your demeanour that Propah look.

Company Event Sponsorship Financial Planning Chart Ppt PowerPoint Presentation File Example Introduction PDF
Showcasing this set of slides titled company event sponsorship financial planning chart ppt powerpoint presentation file example introduction pdf. The topics addressed in these templates are income, sales, expenses. All the content presented in this PPT design is completely editable. Download it and make adjustments in color, background, font etc. as per your unique business setting.
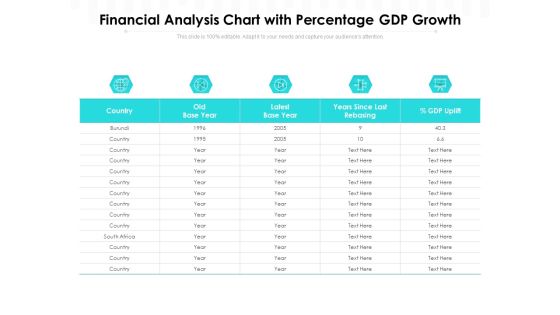
Financial Analysis Chart With Percentage GDP Growth Ppt PowerPoint Presentation Show Microsoft PDF
Presenting this set of slides with name financial analysis chart with percentage gdp growth ppt powerpoint presentation show microsoft pdf. The topics discussed in these slides are country, old base year, latest base year, years since last rebasing, gdp uplift. This is a completely editable PowerPoint presentation and is available for immediate download. Download now and impress your audience.

Financial Pie Chart Business Marketing Strategy PowerPoint Templates Ppt Backgrounds For Slides 0313
We present our Financial Pie Chart Business Marketing Strategy PowerPoint Templates PPT Backgrounds For Slides 0313.Download and present our Marketing PowerPoint Templates because Our PowerPoint Templates and Slides will generate and maintain the level of interest you desire. They will create the impression you want to imprint on your audience. Download and present our Business PowerPoint Templates because Our PowerPoint Templates and Slides will steer your racing mind. Hit the right buttons and spur on your audience. Download and present our Pie Charts PowerPoint Templates because Timeline crunches are a fact of life. Meet all deadlines using our PowerPoint Templates and Slides. Use our Marketing PowerPoint Templates because Watching this your Audience will Grab their eyeballs, they wont even blink. Present our Success PowerPoint Templates because Your success is our commitment. Our PowerPoint Templates and Slides will ensure you reach your goal.Use these PowerPoint slides for presentations relating to Business financial pie chart, marketing, business, pie charts, marketing, success. The prominent colors used in the PowerPoint template are Red, Green, Blue light.

Men In Business On Financial Pie Chart Growth PowerPoint Templates Ppt Backgrounds For Slides
We present our men in business on financial pie chart growth PowerPoint templates PPT backgrounds for slides.Download and present our People PowerPoint Templates because Our PowerPoint Templates and Slides offer you the needful to organise your thoughts. Use them to list out your views in a logical sequence. Download and present our Finance PowerPoint Templates because You can Zap them with our PowerPoint Templates and Slides. See them reel under the impact. Present our Business PowerPoint Templates because You can Create a matrix with our PowerPoint Templates and Slides. Feel the strength of your ideas click into place. Download and present our Marketing PowerPoint Templates because Our PowerPoint Templates and Slides will let your team Walk through your plans. See their energy levels rise as you show them the way. Download and present our Success PowerPoint Templates because You can Bait your audience with our PowerPoint Templates and Slides. They will bite the hook of your ideas in large numbers.Use these PowerPoint slides for presentations relating to 3d, business, character, chart, colorful, concept, data, diagram, document, figure, finance, financial, four, global, graphic, growth, human, icon, idea, information, investment, isolated, leadership, man, market, marketing, number, part, people, person, pie, plan, presentation, progress, report icon, results, rise, shape, shiny, sign, small, solution, statistic, up, white. The prominent colors used in the PowerPoint template are Blue, Gray, Black. PowerPoint presentation experts tell us our men in business on financial pie chart growth PowerPoint templates PPT backgrounds for slides are specially created by a professional team with vast experience. They diligently strive to come up with the right vehicle for your brilliant Ideas. People tell us our character PowerPoint templates and PPT Slides are effectively colour coded to prioritise your plans They automatically highlight the sequence of events you desire. We assure you our men in business on financial pie chart growth PowerPoint templates PPT backgrounds for slides effectively help you save your valuable time. We assure you our diagram PowerPoint templates and PPT Slides will save the presenter time. Presenters tell us our men in business on financial pie chart growth PowerPoint templates PPT backgrounds for slides will save the presenter time. Use our colorful PowerPoint templates and PPT Slides are the best it can get when it comes to presenting.
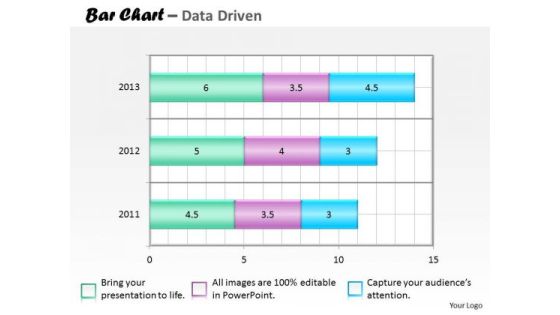
Financial Data Analysis Bar Chart For Collection Of PowerPoint Templates
Our financial data analysis bar chart for collection of Powerpoint Templates Team Are A Dogged Lot. They Keep At It Till They Get It Right.

Quantitative Data Analysis Bar Chart For Financial Markets PowerPoint Templates
Draft It Out On Our quantitative data analysis bar chart for financial markets Powerpoint Templates . Give The Final Touches With Your Ideas.
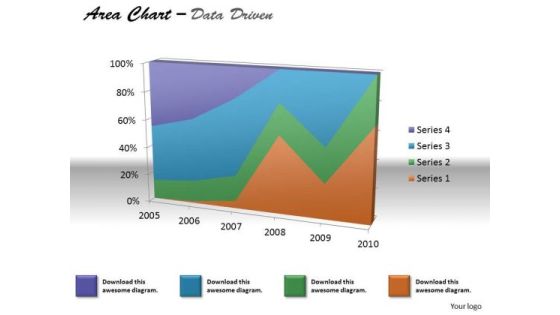
Financial Data Analysis Area Chart For Various Values PowerPoint Templates
Document The Process On Our financial data analysis area chart for various values Powerpoint Templates . Make A Record Of Every Detail.

Financial Data Analysis Area Chart For Showing Trends PowerPoint Templates
Document Your Views On Our financial data analysis area chart for showing trends Powerpoint Templates . They Will Create A Strong Impression.

Pie Chart For Financial Ratio Analysis PowerPoint Template
Deliver amazing presentations with our above template showing pie chart. You may download this slide to display financial ratio analysis. Capture the attention of your audience using this diagram.
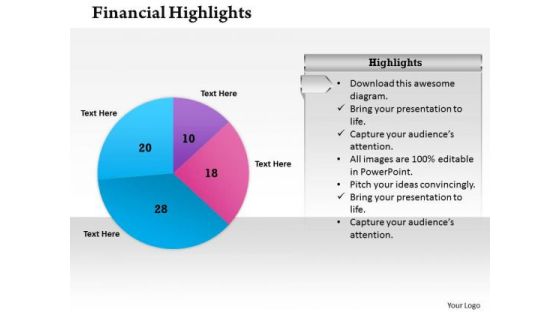
Sales Diagram Pie Chart For Financial Result Business Diagram
Knock On The Door To Success With Our Sales Diagram Pie Chart For Financial Result Business Diagram Powerpoint Templates. Be Assured Of Gaining Entry. Give Them A Dose Of Your Ability. It Will Go Down Well With Our Sales Diagram Pie Chart For Financial Result Business Diagram Powerpoint Templates.
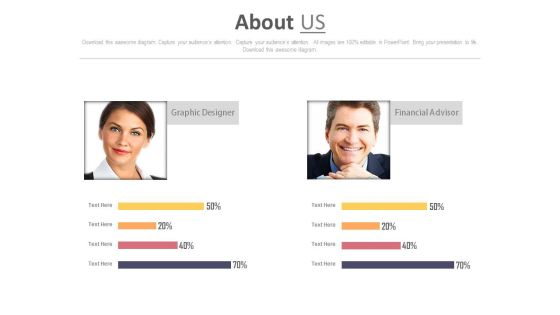
Graphic Designer And Financial Advisor Skill Assessment Chart Powerpoint Slides
The PowerPoint template has been designed with graphic designer and financial advisor skill assessment chart. Use this about us page to tell the story of your company.

Pie Gear Chart For Financial Ratio Analysis Powerpoint Templates
This PPT slide displays diagram of pie gear chart. This PowerPoint template has been designed to exhibit financial ratio analysis. You can present your opinions using this impressive slide

Pie Chart For Financial Ratio Analysis PowerPoint Templates
Create visually amazing presentations with this slide of pie chart. This PPT slide of pie chart for financial ratio analysis. Add this diagram in your presentations to visually support your content.
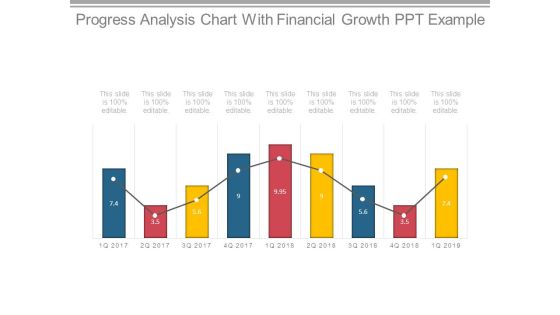
Progress Analysis Chart With Financial Growth Ppt Example
This is a progress analysis chart with financial growth ppt example. This is a nine stage process. The stages in this process are chart, years, business, growth, marketing, management.
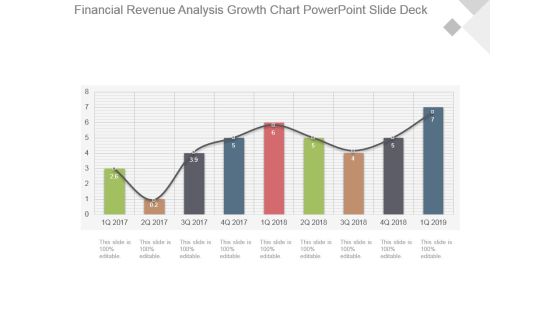
Financial Revenue Analysis Growth Chart Powerpoint Slide Deck
This is a financial revenue analysis growth chart powerpoint slide deck. This is a nine stage process. The stages in this process are growth, success, business, marketing, bar graph.

Financial Planning Steps Infographic Chart Ppt Samples Download
This is a financial planning steps infographic chart ppt samples download. This is a five stage process. The stages in this process are investments, retirement, estate planning, risk management, cash flow.
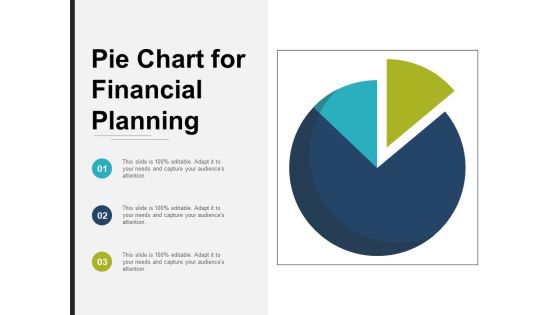
Pie Chart For Financial Planning Ppt PowerPoint Presentation Professional Aids
This is a pie chart for financial planning ppt powerpoint presentation professional aids. This is a three stage process. The stages in this process are sectioned circle, segmented circle, partitioned circle.
Financial Planning With Investment Chart Vector Icon Inspiration PDF
Persuade your audience using this financial planning with investment chart vector icon inspiration pdf. This PPT design covers three stages, thus making it a great tool to use. It also caters to a variety of topics including financial planning with investment chart vector icon. Download this PPT design now to present a convincing pitch that not only emphasizes the topic but also showcases your presentation skills.
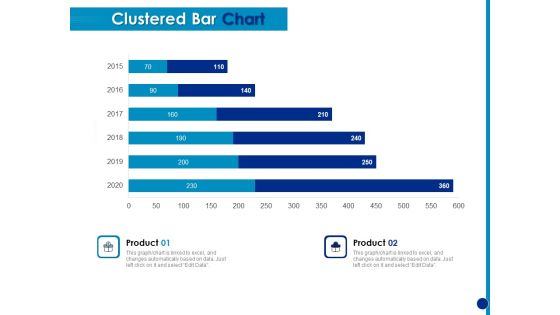
Generating Financial Support Clustered Bar Chart Ppt Portfolio Structure PDF
Presenting this set of slides with name generating financial support clustered bar chart ppt portfolio structure pdf. The topics discussed in these slide is clustered bar chart. This is a completely editable PowerPoint presentation and is available for immediate download. Download now and impress your audience.
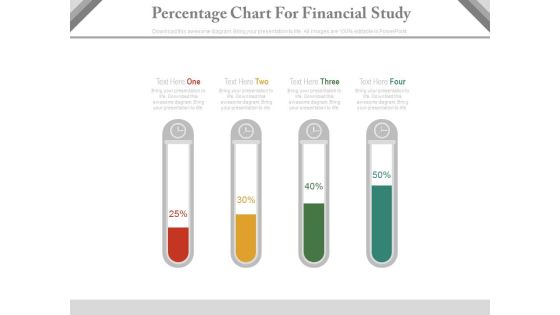
Test Tubes Percentage Chart For Financial Analysis Powerpoint Slides
This PPT slide contains test tubes percentage chart. You may download this PowerPoint template for financial analysis in your presentations. Make outstanding business presentation with this template.

Cash flow And Financial Independence Process Flow Chart Ppt Sample
This is a cash flow and financial independence process flow chart ppt sample. This is a five stage process. The stages in this process are risk management, business and benefits, cash flow and financial independence, investment planning, tax strategies, legacy and estate.

Pie Chart For Financial Ratio Analysis Powerpoint Slides
This PPT slide contains graphics of eight stage pie chart. Download this PowerPoint template slide for financial ratio analysis. This diagram is editable you can edit text, color, shade and style as per you need.

Financial Growth Examples Flow Chart Diagram Powerpoint Slide Graphics
This is a financial growth examples flow chart diagram powerpoint slide graphics. This is a six stage process. The stages in this process are increase in productivity, economic growth and development, increase in flow of goods and services in economy, consumption rises, size of market increase, inducement to invest for firms.

Audit For Financial Investment Management Organizational Chart Professional PDF
This is a audit for financial investment management organizational chart professional pdf template with various stages. Focus and dispense information on three stages using this creative set, that comes with editable features. It contains large content boxes to add your information on topics like marketing communication manager, business development manager, marketing director. You can also showcase facts, figures, and other relevant content using this PPT layout. Grab it now.

Five Steps Linear Chart For Financial Growth Powerpoint Slides
This PowerPoint template has been designed with five steps linear chart. This PPT slide may be used to display financial planning and growth. Download this slide to build unique presentation.
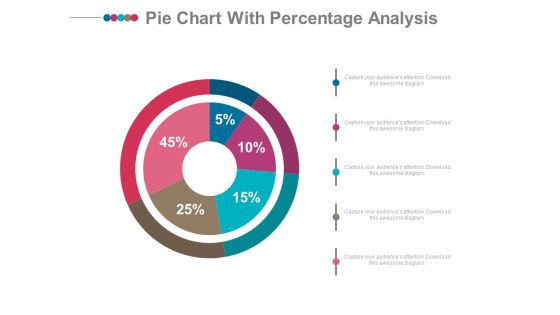
Pie Chart With Financial Data Comparison Powerpoint Slides
Emphatically define your message with our above template which contains graphics of pie chart. This PowerPoint template may be used to display financial data comparison. Grab the attention of your listeners with this slide.

Business Diagram Matrix Chart For Financial Review Presentation Template
Our above business diagram has been designed with graphics of matrix chart. This slide is suitable to present financial review. Use this business diagram to present your work in a more smart and precise manner.

Accounting Flow Chart With Financial Reporting Procedure Clipart PDF
This slide consists of a diagrammatical representation of financial accounting process followed by finance personnel. The elements are preparation of source documents, journal vouchers, general ledger, collect account balances, adjust trial balances etc. Showcasing this set of slides titled Accounting Flow Chart With Financial Reporting Procedure Clipart PDF. The topics addressed in these templates are Source Document, Prepare Journal, Journal Voucher . All the content presented in this PPT design is completely editable. Download it and make adjustments in color, background, font etc. as per your unique business setting.

Pie Chart For Financial Planning And Evaluation Powerpoint Slides
This PowerPoint template has been designed with diagram of pie chart. This PPT slide can be used to prepare presentations for financial planning and evaluation. You can download finance PowerPoint template to prepare awesome presentations.

Circular Steps Chart With Financial Icons Powerpoint Slides
This business slide contains circular steps infographic diagram. This diagram is suitable to present financial planning steps. Enlighten others on the process with this innovative PowerPoint template.
Sequential Chart With Financial Management Icons Powerpoint Template
This PowerPoint template has been designed with sequential chart with icons. This business slide may be used to display financial management steps. Present your views and ideas with this impressive design.

Seven Staged Circle Process Chart For Financial Planning Powerpoint Template
Our above PPT slide contains process chart with icons. This PowerPoint template may be used to display strategic planning methodology. This template is designed to attract the attention of your audience.

Circle Chart For Financial Planning Process PowerPoint Slides
This PowerPoint template has been created by professionals keeping in mind the need of light slides with more information. The slide uses minimalistic yet impactful visuals to explain a 4 step process. The reducing size of the circles can be creatively used to show that the process or the steps are getting an organization or a business firm closer to its targets or goals. There is ample space available to write text describe the steps involved in the process. This can be an ideal presentation for a company to show its financial plan or sales strategy to its investors or clients to gain their confidence. The icons and colors of the slide are customizable and can be edited to match the theme of the slide or the topic of the presentation.
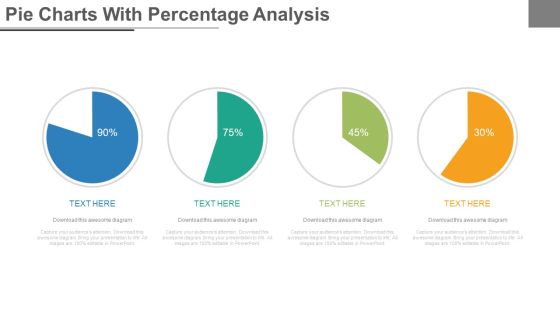
Four Steps Pie Charts For Financial Analysis Powerpoint Slides
Four pie charts have been displayed in this business slide. This PowerPoint template helps to exhibit financial ratio analysis. Use this diagram slide to build an exclusive presentation.

Pie Charts For Financial Ratio Analysis Powerpoint Slides
This PowerPoint template has been designed with diagram of pie charts. This PPT slide can be used to prepare presentations for profit growth report and also for financial data analysis. You can download finance PowerPoint template to prepare awesome presentations.
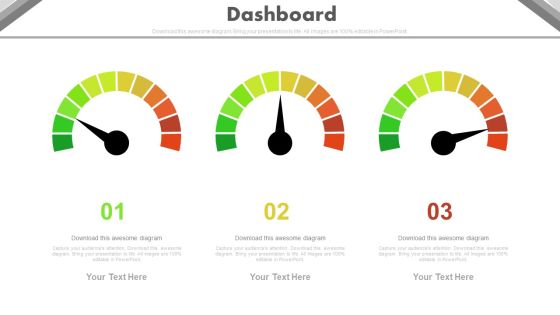
Three Steps Dashboard Charts For Financial Review Powerpoint Slides
This PowerPoint template has been designed with three dashboards. Use this PPT slide to depict financial review and plan. This professional diagram slide will help you express your views to target audience.
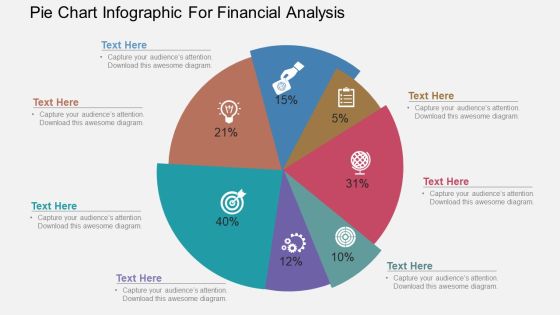
Pie Chart Infographic For Financial Analysis Powerpoint Template
Our above PowerPoint template has been designed with pie chart infographic. This slide is suitable to present financial analysis. Use this business diagram to present your work in a more smart and precise manner.

Bar Chart Icon For Financial Ratios Comparison Elements PDF
Presenting bar chart icon for financial ratios comparison elements pdf to dispense important information. This template comprises four stages. It also presents valuable insights into the topics including bar chart icon for financial ratios comparison. This is a completely customizable PowerPoint theme that can be put to use immediately. So, download it and address the topic impactfully.

Concentric Chart With Five Financial Steps Powerpoint Slides
This PowerPoint slide contains diagram of concentric chart with five financial steps This professional slide helps to exhibit financial planning for business. Use this PowerPoint template to make impressive presentations.
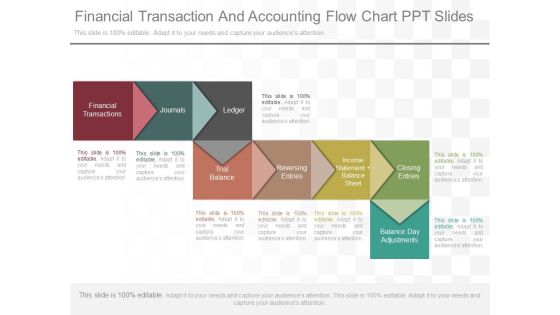
Financial Transaction And Accounting Flow Chart Ppt Slides
This is a financial transaction and accounting flow chart ppt slides. This is a eight stage process. The stages in this process are financial transactions, journals, ledger, trial balance, reversing entries, income statement balance sheet, closing entries, balance day adjustments.
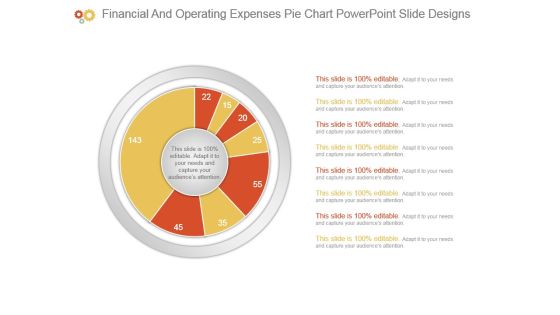
Financial And Operating Expenses Pie Chart Powerpoint Slide Designs
This is a financial and operating expenses pie chart powerpoint slide designs. This is a eight stage process. The stages in this process are business, diagram, marketing, management, presentation.

Financial Reporting And Analysis Pie Chart Ppt PowerPoint Presentation Guidelines
This is a financial reporting and analysis pie chart ppt powerpoint presentation guidelines. This is a four stage process. The stages in this process are process, percentage, business, marketing, finance.
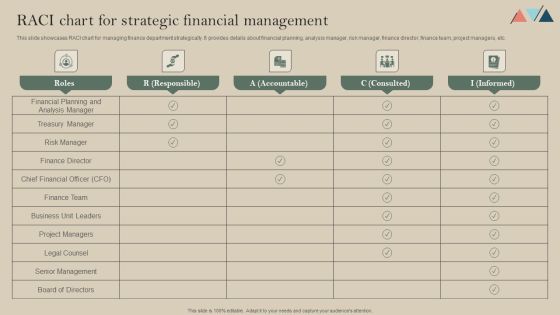
RACI Chart For Strategic Financial Management Diagrams PDF
This slide showcases RACI chart for managing finance department strategically. It provides details about financial planning, analysis manager, risk manager, finance director, finance team, project managers, etc. Here you can discover an assortment of the finest PowerPoint and Google Slides templates. With these templates, you can create presentations for a variety of purposes while simultaneously providing your audience with an eye-catching visual experience. Download RACI Chart For Strategic Financial Management Diagrams PDF to deliver an impeccable presentation. These templates will make your job of preparing presentations much quicker, yet still, maintain a high level of quality. Slidegeeks has experienced researchers who prepare these templates and write high-quality content for you. Later on, you can personalize the content by editing the RACI Chart For Strategic Financial Management Diagrams PDF.

Financial Planning Chart Showing Difference Between Actual And Estimated Figures Ppt PowerPoint Presentation Show Infographic Template PDF
Presenting this set of slides with name financial planning chart showing difference between actual and estimated figures ppt powerpoint presentation show infographic template pdf. The topics discussed in these slides are estimated, actual, difference, miscellaneous payments, transportation. This is a completely editable PowerPoint presentation and is available for immediate download. Download now and impress your audience.
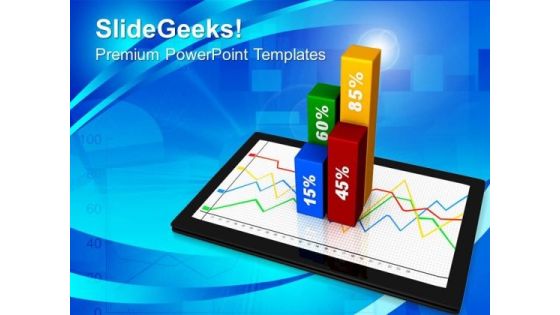
Financial And Business Chart Tablet PowerPoint Templates And PowerPoint Themes 0812
Financial And Business Chart Tablet PowerPoint Templates And PowerPoint Themes 0812-Microsoft Powerpoint Templates and Background with financial and business chart on tablet screen
Financial Plan Analysis Chart Vector Icon Ppt PowerPoint Presentation Ideas Inspiration PDF
Showcasing this set of slides titled financial plan analysis chart vector icon ppt powerpoint presentation ideas inspiration pdf. The topics addressed in these templates are financial plan analysis chart vector icon. All the content presented in this PPT design is completely editable. Download it and make adjustments in color, background, font etc. as per your unique business setting.
Vector Showing Financial Ratio Evaluation Chart Icon Ppt PowerPoint Presentation Gallery Inspiration PDF
Persuade your audience using this vector showing financial ratio evaluation chart icon ppt powerpoint presentation gallery inspiration pdf. This PPT design covers three stages, thus making it a great tool to use. It also caters to a variety of topics including vector showing financial ratio evaluation chart icon. Download this PPT design now to present a convincing pitch that not only emphasizes the topic but also showcases your presentation skills.
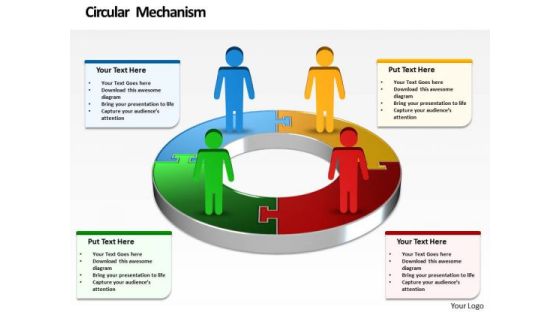
Ppt Symbol Business Men Standing On Financial Colorful Pie Chart PowerPoint Templates
PPT symbol business men standing on financial colorful pie chart PowerPoint Templates-Use this Business based PowerPoint Diagram to represent the Business issues Graphically. It indicates arrange, block out, blueprint, cast, delineate, design, devise, draft, graph , lay out, outline, plot, project, shape, sketch etc.-PPT symbol business men standing on financial colorful pie chart PowerPoint Templates-Adult, Art, Background, Business, Career, Chart, Communication, Concept, Conference, Corporate, Creative, Design, Economy, Executive, Finance, Group, Growth, Idea, Illustration, Leadership, Meeting, New, Occupation, Office, People, Person, Progress, Silhouette, Space, Speaking, Standing, Success

Business Financial Control Workflow Chart Ppt PowerPoint Presentation Show Gallery PDF
Presenting this set of slides with name business financial control workflow chart ppt powerpoint presentation show gallery pdf. This is a seven stage process. The stages in this process are assistant director, chief financial accountant, capital accountant, accounts assistant. This is a completely editable PowerPoint presentation and is available for immediate download. Download now and impress your audience.

Web Banking For Financial Transactions Line Chart Ppt Summary Portfolio PDF
Presenting this set of slides with name web banking for financial transactions line chart ppt summary portfolio pdf. The topics discussed in these slide is line chart. This is a completely editable PowerPoint presentation and is available for immediate download. Download now and impress your audience.

Financial Organizational Hierarchy Chart With Risk Levels Ppt PowerPoint Presentation Gallery Graphics Template PDF
Presenting financial organizational hierarchy chart with risk levels ppt powerpoint presentation gallery graphics template pdf to dispense important information. This template comprises three stages. It also presents valuable insights into the topics including growth, investments, wealth. This is a completely customizable PowerPoint theme that can be put to use immediately. So, download it and address the topic impactfully.

Comparative Financial Statement Analysis Chart Ppt PowerPoint Presentation Model Master Slide
Presenting this set of slides with name comparative financial statement analysis chart ppt powerpoint presentation model master slide. The topics discussed in these slides are current assets, current liabilities, equivalents, investments, inventories. This is a completely editable PowerPoint presentation and is available for immediate download. Download now and impress your audience.
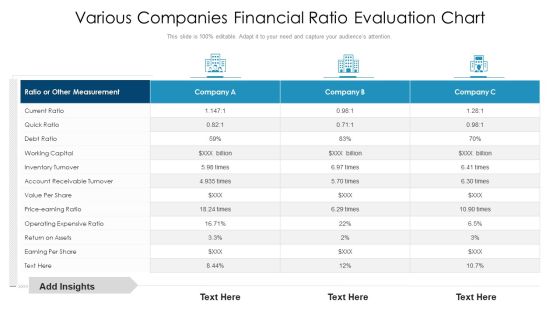
Various Companies Financial Ratio Evaluation Chart Ppt PowerPoint Presentation File Background Designs PDF
Showcasing this set of slides titled various companies financial ratio evaluation chart ppt powerpoint presentation file background designs pdf. The topics addressed in these templates are measurement, inventory turnover, debt ratio. All the content presented in this PPT design is completely editable. Download it and make adjustments in color, background, font etc. as per your unique business setting.
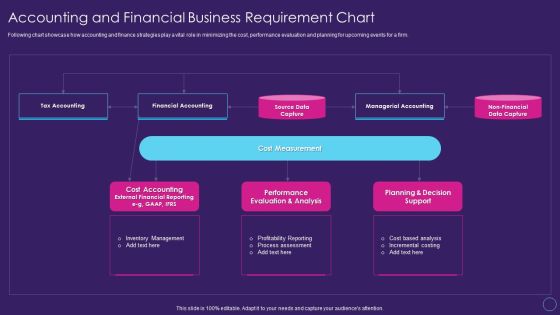
Digital Transformation Toolkit Accounting Finance Accounting And Financial Business Requirement Chart Guidelines PDF
In this slide, we are tabulating the process that effectively analyze financial and accounting needs of business including operational excellence, liquidity and profitability etc. Deliver an awe inspiring pitch with this creative digital transformation toolkit accounting finance accounting and financial business requirement chart guidelines pdf bundle. Topics like business expenditure, cost minimization, merger integration process can be discussed with this completely editable template. It is available for immediate download depending on the needs and requirements of the user.

Financial Diagram Business Chart PowerPoint Templates Ppt Backgrounds For Slides 0313
We present our Financial Diagram Business Chart PowerPoint Templates PPT Backgrounds For Slides 0313.Download and present our Money PowerPoint Templates because You should Bet on your luck with our PowerPoint Templates and Slides. Be assured that you will hit the jackpot. Use our Finance PowerPoint Templates because Our PowerPoint Templates and Slides will let you Hit the right notes. Watch your audience start singing to your tune. Download and present our Pie Charts PowerPoint Templates because Our PowerPoint Templates and Slides are created by a hardworking bunch of busybees. Always flitting around with solutions gauranteed to please. Use our Marketing PowerPoint Templates because You have gained great respect for your brilliant ideas. Use our PowerPoint Templates and Slides to strengthen and enhance your reputation. Present our Shapes PowerPoint Templates because you should Experience excellence with our PowerPoint Templates and Slides. They will take your breath away.Use these PowerPoint slides for presentations relating to Financial growth pie chart with dollar, money, finance, pie charts, shapes, marketing. The prominent colors used in the PowerPoint template are Pink, Yellow, Blue.
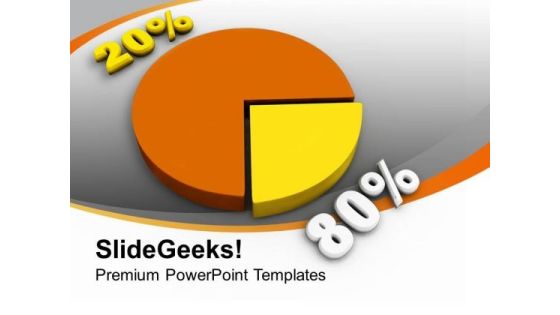
Statistical Pie Chart Financial Business PowerPoint Templates Ppt Backgrounds For Slides 0213
We present our Statistical Pie Chart Financial Business PowerPoint Templates PPT Backgrounds For Slides 0213.Present our Business PowerPoint Templates because You can Channelise the thoughts of your team with our PowerPoint Templates and Slides. Urge them to focus on the goals you have set. Present our Marketing PowerPoint Templates because Our PowerPoint Templates and Slides offer you the needful to organise your thoughts. Use them to list out your views in a logical sequence. Use our Pie charts PowerPoint Templates because It will get your audience in sync. Download our Future PowerPoint Templates because Our PowerPoint Templates and Slides are aesthetically designed to attract attention. We gaurantee that they will grab all the eyeballs you need. Download our Finance PowerPoint Templates because Our PowerPoint Templates and Slides are the chords of your song. String them along and provide the lilt to your views.Use these PowerPoint slides for presentations relating to Business statistics financial success concept, business, marketing, future, finance, pie charts. The prominent colors used in the PowerPoint template are Yellow, Orange, White.

Web Banking For Financial Transactions Gantt Chart Ppt Slides Graphics Download PDF
Manage your complex projects and organize them simultaneously with this detailed Gantt Chart PowerPoint Template. Track your milestones, tasks, phases, activities, subtasks amongst other constituents that will give you an updated visual of your project. Reflect your planning horizon and capture your release plan in one view with this Gantt Chart PowerPoint presentation template. You can plot various dependencies directly on this Timeline PowerPoint Presentation Layout to see which tasks are still in the pipeline and how the delays in them are impacting the schedules and deadlines of the project. Apart from this, you can also share this updated visual with your team members and stakeholders, thus making it a resourceful tool to be incorporated in your business structure. Not only this but also the editable layout of this slide helps you to add your data and statistics at your convenience.

Global Financial Economy Pie Chart PowerPoint Templates Ppt Backgrounds For Slides 0513
With our globe powerpoint templates you will be doubly sure. They possess that stamp of authority. Our earth powerpoint templates do it in double quick time. Speed up the process in a tangible way.

Financials Base Plan Table Chart Ppt Slide Templates
This is a financials base plan table chart ppt slide templates. This is a five stage process. The stages in this process are kpi, revenue, cost of sales, gross profit, customer acquisition cost, other operating cost expense, operating profit, change in cash, ending cash, employees ftes.
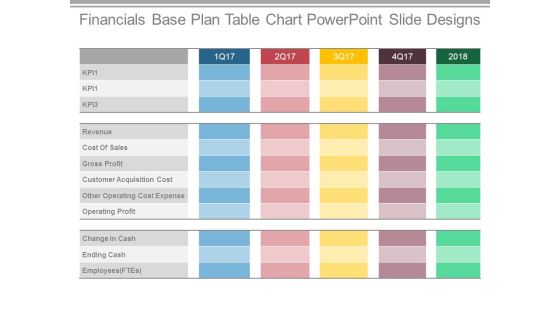
Financials Base Plan Table Chart Powerpoint Slide Designs
This is a financials base plan table chart powerpoint slide designs. This is a five stage process. The stages in this process are revenue, cost of sales, gross profit, customer acquisition cost, other operating cost expense, operating profit, change in cash, ending cash.
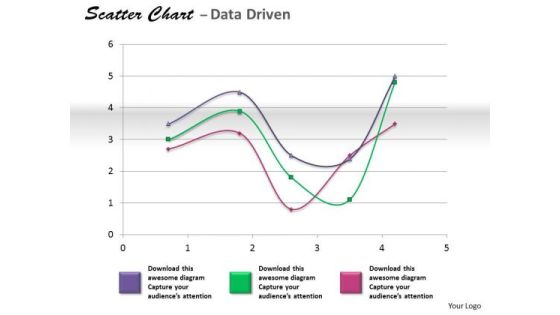
Financial Data Analysis Coordinate With Scatter Chart PowerPoint Templates
Get The Doers Into Action. Activate Them With Our financial data analysis coordinate with scatter chart Powerpoint Templates .

Financial Data Analysis Currency Trading Bar Chart PowerPoint Templates
Put In A Dollop Of Our financial data analysis currency trading bar chart Powerpoint Templates . Give Your Thoughts A Distinctive Flavor.

Chart Comparison Icon For Financial Ratios Template PDF
Persuade your audience using this chart comparison icon for financial ratios template pdf. This PPT design covers three stages, thus making it a great tool to use. It also caters to a variety of topics including chart comparison icon for financial ratios. Download this PPT design now to present a convincing pitch that not only emphasizes the topic but also showcases your presentation skills.
Linear Diamond Chart With Icons For Financial Progress Powerpoint Template
This PowerPoint template has been designed with linear diamond chart with icons. This diagram helps to exhibit financial progress. Present your views using this innovative slide and be assured of leaving a lasting impression.
Five Mountain Chart With Icons For Financial Analysis Powerpoint Slides
Our above PPT slide contains five mountains with icons and financial values. This PowerPoint template helps to exhibit financial analysis for business growth. Use this diagram to impart more clarity to subject and to create more sound impact on viewers.
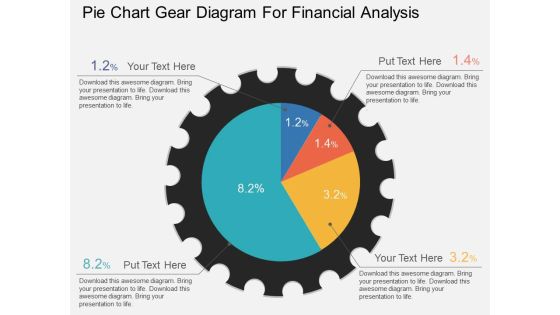
Pie Chart Gear Diagram For Financial Analysis Powerpoint Template
This PowerPoint template has been designed with graphic of pie chart gear diagram. This PPT slide can be used to display financial analysis. Download this PPT diagram slide to make your presentations more effective.

Puzzle Pie Chart With Team For Financial Analysis Powerpoint Slides
This PPT slide contains graphics of puzzle pie chart with team icons. You may use this PowerPoint template to display team strategy and success. Download this professional slide design to deliver amazing presentations.
Financial Reports And Charts On Computer Screen Vector Icon Microsoft PDF
Presenting financial reports and charts on computer screen vector icon microsoft pdf to dispense important information. This template comprises three stages. It also presents valuable insights into the topics including financial reports and charts on computer screen vector icon. This is a completely customizable PowerPoint theme that can be put to use immediately. So, download it and address the topic impactfully.
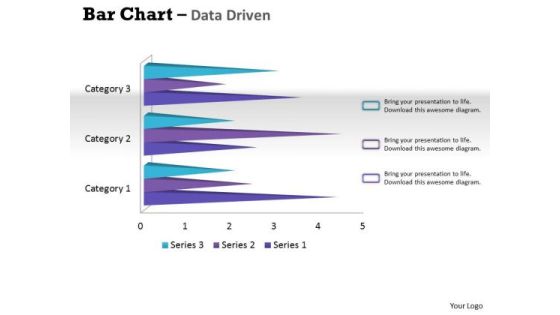
Data Analysis Techniques 3d Bar Chart For Financial Solutions PowerPoint Templates
Make Your Dreams A Reality With Our data analysis techniques 3d bar chart for financial solutions Powerpoint Templates . Your Ideas Will Begin To Take Shape.
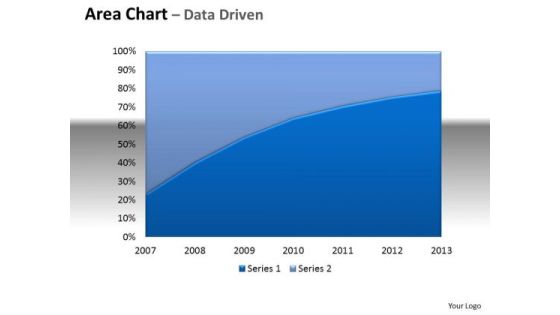
Financial Data Analysis Area Chart With Plotted Line Center PowerPoint Templates
Be The Doer With Our financial data analysis area chart with plotted line center Powerpoint Templates . Put Your Thoughts Into Practice.

Chart For Financial Trends Analysis Ppt PowerPoint Presentation Inspiration Background Image
Presenting this set of slides with name chart for financial trends analysis ppt powerpoint presentation inspiration background image. The topics discussed in these slides are revenue trend, bar chart, financial. This is a completely editable PowerPoint presentation and is available for immediate download. Download now and impress your audience.

Quarterly Sales Growth Chart For Financial Report Ppt PowerPoint Presentation Ideas Infographics
Presenting this set of slides with name quarterly sales growth chart for financial report ppt powerpoint presentation ideas infographics. The topics discussed in these slides are revenue trend, bar chart, financial. This is a completely editable PowerPoint presentation and is available for immediate download. Download now and impress your audience.
Financial Target Icon With Chart And Dollar Symbol Ppt Infographics Rules PDF
Presenting financial target icon with chart and dollar symbol ppt infographics rules pdf to dispense important information. This template comprises three stages. It also presents valuable insights into the topics including financial target icon with chart and dollar symbol. This is a completely customizable PowerPoint theme that can be put to use immediately. So, download it and address the topic impactfully.

Chart Showing Financial Projection With Various Segments Ppt Professional Icon PDF
Showcasing this set of slides titled chart showing financial projection with various segments ppt professional icon pdf. The topics addressed in these templates are chart showing financial projection with various segments. All the content presented in this PPT design is completely editable. Download it and make adjustments in color, background, font etc. as per your unique business setting.
Financial Report With Bar Chart Vector Icon Ppt PowerPoint Presentation Infographics Objects PDF
Presenting this set of slides with name financial report with bar chart vector icon ppt powerpoint presentation infographics objects pdf. This is a three stage process. The stages in this process are financial report with bar chart vector icon. This is a completely editable PowerPoint presentation and is available for immediate download. Download now and impress your audience.
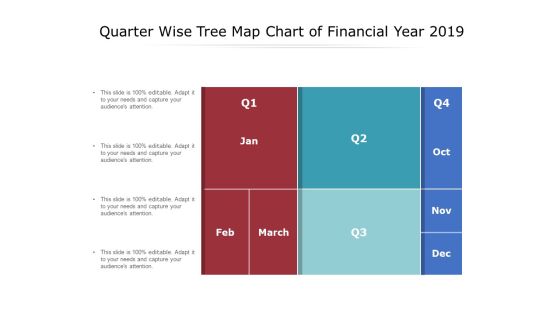
Quarter Wise Tree Map Chart Of Financial Year 2019 Ppt PowerPoint Presentation Ideas Themes
Showcasing this set of slides titled quarter wise tree map chart of financial year 2019 ppt powerpoint presentation ideas themes. The topics addressed in these templates are quarter wise tree map chart of financial year 2019. All the content presented in this PPT design is completely editable. Download it and make adjustments in color, background, font etc. as per your unique business setting.
Organization Growth Chart With Financial Advisor Icon Ppt PowerPoint Presentation File Icon PDF
Presenting this set of slides with name organization growth chart with financial advisor icon ppt powerpoint presentation file icon pdf. This is a three stage process. The stages in this process are organization growth chart with financial advisor icon. This is a completely editable PowerPoint presentation and is available for immediate download. Download now and impress your audience.

Pie Chart For Financial Planning And Distribution Ppt PowerPoint Presentation File Deck
Presenting this set of slides with name pie chart for financial planning and distribution ppt powerpoint presentation file deck. The topics discussed in these slides are pie chart, finance, donut chart. This is a completely editable PowerPoint presentation and is available for immediate download. Download now and impress your audience.
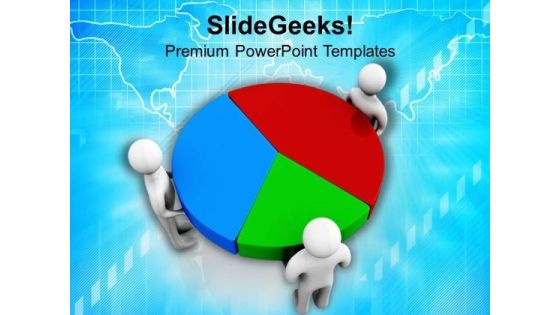
Pie Chart Of Financial Result PowerPoint Templates Ppt Backgrounds For Slides 0713
Motivate the disheartened with our Pie Chart Of Financial Result PowerPoint Templates PPT Backgrounds For Slides. Inspire them with the goodness in you. Discover decisive moments with our Marketing PowerPoint Templates. They help make that crucial difference. Our Pie charts PowerPoint Templates will help make your dreams come true. Your thoughts will weave the magic for you.

Bar Chart Showing Financial Highlights Of Company Ppt PowerPoint Presentation File Styles PDF
Presenting this set of slides with name bar chart showing financial highlights of company ppt powerpoint presentation file styles pdf. The topics discussed in these slides are sales, gross margin, net profit. This is a completely editable PowerPoint presentation and is available for immediate download. Download now and impress your audience.
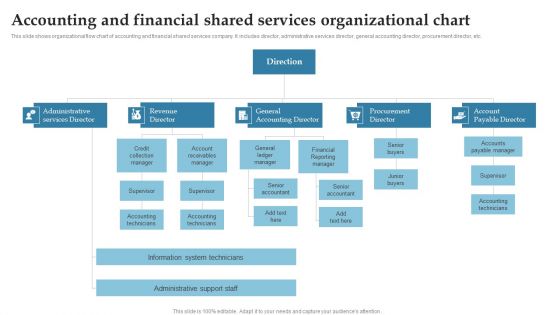
Accounting And Financial Shared Services Organizational Chart Ppt Styles Example PDF
This slide shows organizational flow chart of accounting and financial shared services company. It includes director, administrative services director, general accounting director, procurement director, etc. Persuade your audience using this Accounting And Financial Shared Services Organizational Chart Ppt Styles Example PDF. This PPT design covers seven stages, thus making it a great tool to use. It also caters to a variety of topics including Revenue Director, General Accounting Director, Procurement Director, Account Payable Director. Download this PPT design now to present a convincing pitch that not only emphasizes the topic but also showcases your presentation skills.
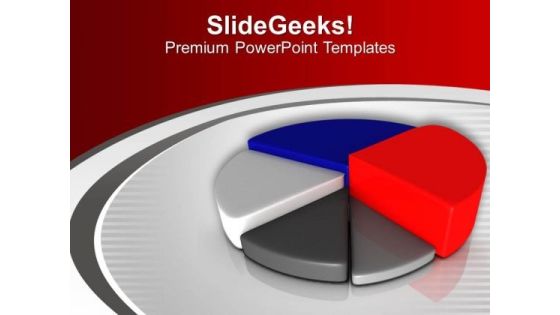
Pie Chart For Financial Growth PowerPoint Templates Ppt Backgrounds For Slides 0613
Our Pie Chart For Financial Growth PowerPoint Templates PPT Backgrounds For Slides leave no one in doubt. Provide a certainty to your views. Some of your team maybe a little doubtful. Assure them with certainty through our Finance PowerPoint Templates. Our Business PowerPoint Templates and your ideas make a great doubles pair. Play the net with assured hands.
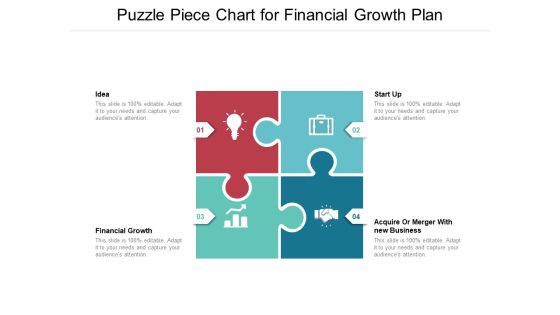
Puzzle Piece Chart For Financial Growth Plan Ppt PowerPoint Presentation Summary Infographic Template PDF
Presenting this set of slides with name puzzle piece chart for financial growth plan ppt powerpoint presentation summary infographic template pdf. This is a four stage process. The stages in this process are financial growth, idea, start up, acquire or merger with new business. This is a completely editable PowerPoint presentation and is available for immediate download. Download now and impress your audience.

 Home
Home
