Financial Chart
Money Chart Ppt Icon For Ppt Templates And Slides C
Microsoft PowerPoint Template and Background with financial diagram consisting of golden
Money Chart Ppt Icon For Ppt Templates And Slides Cc
Microsoft PowerPoint Template and Background with financial diagram consisting of golden
Money Chart Ppt Icon For Ppt Templates And Slides F
Microsoft PowerPoint Template and Background with financial diagram consisting of golden
Money Chart Ppt Icon For Ppt Templates And Slides R
Microsoft PowerPoint Template and Background with financial diagram consisting of golden
Money Chart Ppt Icon For Ppt Templates And Slides S
Microsoft PowerPoint Template and Background with financial diagram consisting of golden

Money Chart Finance PowerPoint Templates And PowerPoint Backgrounds 0611
Microsoft PowerPoint Template and Background with financial diagram consisting of conceptual golden coins

Growth Chart Success Business PowerPoint Templates And PowerPoint Backgrounds 0611
Microsoft PowerPoint Template and Background with financial growth red arrow rising

Colorful Illustration Using Arrows Flow Chart PowerPoint Slides
We present our colorful illustration using arrows flow chart PowerPoint Slides.Use our Marketing PowerPoint Templates because, This is an impressive template to unravel your recipe for a mouth watering result. Use our Arrows PowerPoint Templates because,you can Organize your thoughts and illuminate your ideas accordingly. Use our Shapes PowerPoint Templates because,The Gear Train is a basic element of living and daily business. Use our Business PowerPoint Templates because, It will demonstrate the strength of character under severe stress. Shine the torch ahead and bring the light to shine on all Use our Targets PowerPoint Templates because,We all know that alphabetical order is a time honoured concept.Use these PowerPoint slides for presentations relating to Arrow, background, banner, business, chart, colorful, diagram, advertising, direction, element, financial, flow, gradient, illustration, isolated, marketing mirrored, placeholderm, presentation, process, success, steps. The prominent colors used in the PowerPoint template are Green, Gray, White

Colorful Illustration Using Arrows Meeting Process Flow Chart PowerPoint Templates
We present our colorful illustration using arrows meeting process flow chart PowerPoint templates.Use our Marketing PowerPoint Templates because, Customer satisfaction is a mantra of the marketplace. Building a loyal client base is an essential element of your business Use our Arrows PowerPoint Templates because, Business ethics is an essential element in your growth. Use our Shapes PowerPoint Templates because,you can Break it all down to Key Result Areas. Use our Business PowerPoint Templates because, It will demonstrate the strength of character under severe stress. Shine the torch ahead and bring the light to shine on all Use our Targets PowerPoint Templates because,It Draws the universal impact to highlight the similarities with your organizational structure and plans.Use these PowerPoint slides for presentations relating to Arrow, background, banner, business, chart, colorful, diagram, advertising, direction, element, financial, flow, gradient, illustration, isolated, marketing mirrored, placeholderm, presentation, process, success, steps. The prominent colors used in the PowerPoint template are Red, Gray, White

Colorful Illustration Using Arrows Flow Chart Creator Free PowerPoint Templates
We present our colorful illustration using arrows flow chart creator free PowerPoint templates.Use our Marketing PowerPoint Templates because,You have imbibed from this fountain of ideas and developed some worthwhile views. Use our Arrows PowerPoint Templates because,You have the right arrows in your quiver. Use our Shapes PowerPoint Templates because, It gives you really bright ideas. Use our Business PowerPoint Templates because, The majestic Tiger lord of all it surveys.It exudes power even when it is in repose Use our Targets PowerPoint Templates because,this template will explain the value of its wellness to human life.Use these PowerPoint slides for presentations relating to Arrow, background, banner, business, chart, colorful, diagram, advertising, direction, element, financial, flow, gradient, illustration, isolated, marketing mirrored, placeholderm, presentation, process, success, steps. The prominent colors used in the PowerPoint template are Red, Gray, White
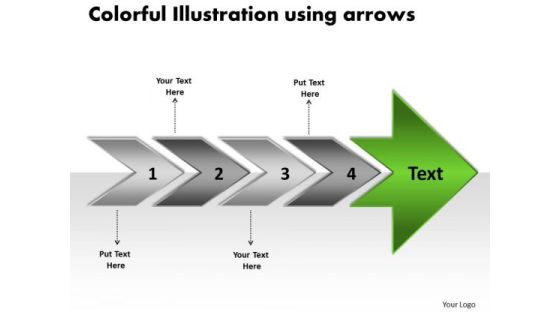
Colorful Illustration Using Arrows Online Flow Chart Maker PowerPoint Templates
We present our colorful illustration using arrows online flow chart maker PowerPoint templates.Use our Marketing PowerPoint Templates because, Customer satisfaction is a mantra of the marketplace. Building a loyal client base is an essential element of your business Use our Arrows PowerPoint Templates because,These slides are the triggers of our growth. Use our Shapes PowerPoint Templates because, This is an impressive template to unravel your recipe for a mouth watering result. Use our Business PowerPoint Templates because, You can Lead your flock steadily to greater heights. Look around at the vast potential of achievement around you Use our Targets PowerPoint Templates because,They are the tools that helped most of us evolve.Use these PowerPoint slides for presentations relating to Arrow, background, banner, business, chart, colorful, diagram, advertising, direction, element, financial, flow, gradient, illustration, isolated, marketing mirrored, placeholderm, presentation, process, success, steps. The prominent colors used in the PowerPoint template are Green, Gray, White
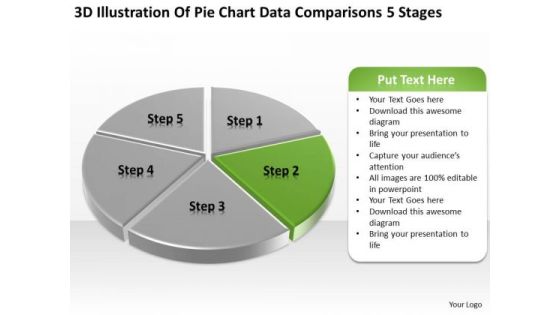
Pie Chart Data Comparisons 5 Stages Business Plan PowerPoint Templates
We present our pie chart data comparisons 5 stages business plan PowerPoint templates.Download and present our Marketing PowerPoint Templates because Our PowerPoint Templates and Slides offer you the widest possible range of options. Use our Finance PowerPoint Templates because You should Ascend the ladder of success with ease. Our PowerPoint Templates and Slides will provide strong and sturdy steps. Download and present our Business PowerPoint Templates because You should Throw the gauntlet with our PowerPoint Templates and Slides. They are created to take up any challenge. Present our Sales PowerPoint Templates because Our PowerPoint Templates and Slides help you pinpoint your timelines. Highlight the reasons for your deadlines with their use. Present our Success PowerPoint Templates because It will Raise the bar of your Thoughts. They are programmed to take you to the next level.Use these PowerPoint slides for presentations relating to Analysis, Analyzing, Brands, Business, Chart, Colorful, Commerce, Compare, Comparison, Data, Economical, Finance, Financial, Grow, Growth, Market, Market Share, Marketing, Measure, Pen, Pie, Pie Chart, Presentation, Profit, Revenue, Sales, Sales Chat, Sales Increase, Share, Statistical, Success, Successful. The prominent colors used in the PowerPoint template are Green, Gray, White.
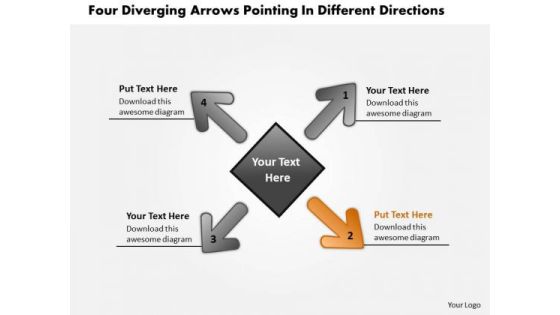
Diverging Arrows Pointing Different Directions Circular Process Chart PowerPoint Slides
We present our diverging arrows pointing different directions Circular Process Chart PowerPoint Slides.Present our Arrows PowerPoint Templates because you have an idea of which you are sure. Present our Process and flows PowerPoint Templates because this diagram helps in examine each brilliant thought in thorough detail highlighting all the pros and cons as minutely as possible. Download and present our Business PowerPoint Templates because project your ideas to you colleagues and complete the full picture. Present our Flow charts PowerPoint Templates because you have churned your mind and come up with effective ways and means to further refine it. Use our Signs PowerPoint Templates because forward thinking is the way to go.Use these PowerPoint slides for presentations relating to Arrow, brochure, business,businessman, button, chart, circle,company, cyclic, data, demonstration,diagram, financial, five,glossy, goal, graph, illustration, info,information, investment, man, manage,marketing, model, navigation, option,part, people, person, pie, presentation,process, result, section, segmented. The prominent colors used in the PowerPoint template are Green, White, Black. People tell us our diverging arrows pointing different directions Circular Process Chart PowerPoint Slides will save the presenter time. Professionals tell us our company PowerPoint templates and PPT Slides are Detailed. We assure you our diverging arrows pointing different directions Circular Process Chart PowerPoint Slides will make you look like a winner. PowerPoint presentation experts tell us our business PowerPoint templates and PPT Slides are Elevated. We assure you our diverging arrows pointing different directions Circular Process Chart PowerPoint Slides are Spiffy. People tell us our chart PowerPoint templates and PPT Slides are Appealing.
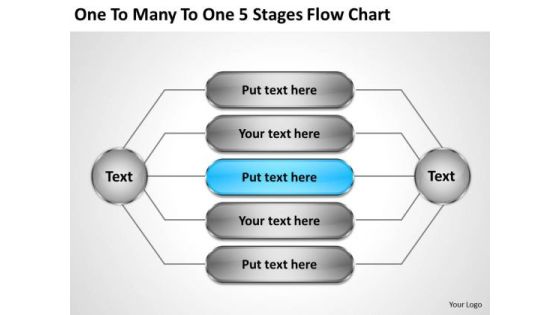
Company Business Strategy To Many 5 Stages Flow Chart Development
We present our company business strategy to many 5 stages flow chart development.Download our Process and Flows PowerPoint Templates because Our PowerPoint Templates and Slides will provide weight to your words. They will bring out the depth of your thought process. Present our Flow Charts PowerPoint Templates because Our PowerPoint Templates and Slides will embellish your thoughts. See them provide the desired motivation to your team. Use our Org Charts PowerPoint Templates because It will Raise the bar of your Thoughts. They are programmed to take you to the next level. Download and present our Business PowerPoint Templates because You are an avid believer in ethical practices. Highlight the benefits that accrue with our PowerPoint Templates and Slides. Download our Marketing PowerPoint Templates because our PowerPoint Templates and Slides are the string of your bow. Fire of your ideas and conquer the podium.Use these PowerPoint slides for presentations relating to Arrow, art, background, blank, business, button, chart, clip, coded, circlecharts,diagram, drop, financial, flow, graph, graphic, icon, illustration, image, org,organizational, process,shadow, symbol, team, transparency, vector, marketing, . The prominent colors used in the PowerPoint template are Blue light, White, Gray.
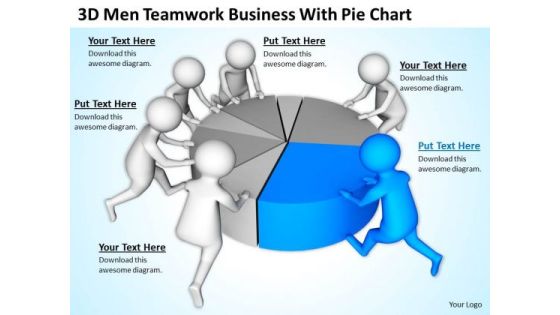
Pictures Of Business Men PowerPoint Presentation With Pie Chart Slides
We present our pictures of business men powerpoint presentation with pie chart Slides.Use our Business PowerPoint Templates because Our PowerPoint Templates and Slides will let Your superior ideas hit the target always and everytime. Present our Teamwork PowerPoint Templates because Our PowerPoint Templates and Slides ensures Effective communication. They help you put across your views with precision and clarity. Use our Pie Charts PowerPoint Templates because you can Break through with our PowerPoint Templates and Slides. Bring down the mental barriers of your audience. Download our Marketing PowerPoint Templates because It will let you Set new benchmarks with our PowerPoint Templates and Slides. They will keep your prospects well above par. Use our Success PowerPoint Templates because Our PowerPoint Templates and Slides are Clear and concise. Use them and dispel any doubts your team may have.Use these PowerPoint slides for presentations relating to 3d, accounting, banking, business, businessmen, chart, completing, concept, diagram, economy, financial, graph, illustration, investment, management, market, men, money, part, people, percent, pie, piece, profit, progress, pushing, report, results, sales, slice, statistics, strategy, success, symbol, team, teamwork, together, unite, white. The prominent colors used in the PowerPoint template are Blue, Gray, White.

2 Layers Marketing Process Chart Ppt Vision Flowchart Templates PowerPoint
We present our 2 layers marketing process chart ppt vision flowchart templates PowerPoint. Use our Marketing PowerPoint Templates because, Business Process Design:- The template offers an excellent background to build up the various stages of your business process. Use our Semicircles PowerPoint Templates because, Listen to ideas and thoughts. Use our Arrows PowerPoint Templates because; Help them align their arrows to consistently be accurate. Use our Business PowerPoint Templates because, Marketing Strategy Business Template:- Maximizing sales of your product is the intended destination. Use our Shapes PowerPoint Templates because, Illuminate the spiritual brilliance of Jesus and shower the love for mankind he showed even while being crucified. Use these PowerPoint slides for presentations relating to 3d, abstract, analysis, arrow, bright, chart, concept, creative, descend, design, diversion, expand, expanding, finance, financial, flowing, graph, graphic, group, growing, growth, high, illustration, increase, lines, market, pattern, rainbow, report, spread, statistic, stock, symbol. The prominent colors used in the PowerPoint template are Green, Gray, and Black

2 Layers Marketing Process Chart Flowcharts PowerPoint Slides
We present our 2 layers marketing process chart flowcharts PowerPoint Slides. Use our Marketing PowerPoint Templates because, Our PowerPoint templates give this step by step process to achieve the aim. Use our Semicircles PowerPoint Templates because, are the tools that helped most of us evolve. Use our Arrows PowerPoint Templates because, Ideas roll along in your mind like billiard balls. Use our Business PowerPoint Templates because, Marketing Strategy Business Template:- Maximizing sales of your product is the intended destination. Use our Shapes PowerPoint Templates because, you have the right arrows in your quiver. Use these PowerPoint slides for presentations relating to 3d, abstract, analysis, arrow, bright, chart, concept, creative, descend, design, diversion, expand, expanding, finance, financial, flowing, graph, graphic, group, growing, growth, high, illustration, increase, lines, market, pattern, rainbow, report, spread, statistic, stock, symbol. The prominent colors used in the PowerPoint template are Blue, Gray, and Black

Explain Parallel Processing 10 Stages Flow Chart PowerPoint Templates
We present our explain parallel processing 10 stages flow chart PowerPoint templates.Download and present our Business PowerPoint Templates because Our PowerPoint Templates and Slides will let Your superior ideas hit the target always and everytime. Download and present our Arrows PowerPoint Templates because Our PowerPoint Templates and Slides will steer your racing mind. Hit the right buttons and spur on your audience. Present our Shapes PowerPoint Templates because You can Stir your ideas in the cauldron of our PowerPoint Templates and Slides. Cast a magic spell on your audience. Use our Success PowerPoint Templates because Our PowerPoint Templates and Slides are focused like a searchlight beam. They highlight your ideas for your target audience. Download and present our Signs PowerPoint Templates because You will get more than you ever bargained for. Use these PowerPoint slides for presentations relating to 3d, achievement, aim, arrows, business, career, chart, competition,development, direction, education, financial, forecast, forward, glossy, graph,group, growth, higher, icon, increase, investment, leader, leadership, moving,onwards, outlook, path, plan, prediction, price, profit, progress, property, race,sales, series, success, target, team, teamwork, turn, up, upwards, vector, win,winner. The prominent colors used in the PowerPoint template are Tan, Gray, White. We assure you our explain parallel processing 10 stages flow chart PowerPoint templates are designed by professionals PowerPoint presentation experts tell us our arrows PowerPoint templates and PPT Slides will save the presenter time. The feedback we get is that our explain parallel processing 10 stages flow chart PowerPoint templates look good visually. We assure you our chart PowerPoint templates and PPT Slides have awesome images to get your point across. PowerPoint presentation experts tell us our explain parallel processing 10 stages flow chart PowerPoint templates will make you look like a winner. We assure you our arrows PowerPoint templates and PPT Slides are specially created by a professional team with vast experience. They diligently strive to come up with the right vehicle for your brilliant Ideas.
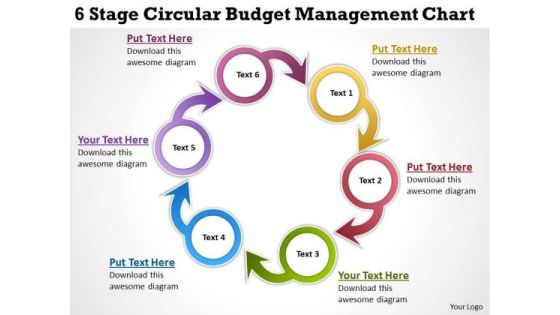
Business Diagram Templates 6 Stage Circular Budget Management Chart PowerPoint
We present our business diagram templates 6 stage circular budget management chart PowerPoint.Use our Circle Charts PowerPoint Templates because Our PowerPoint Templates and Slides will Activate the energies of your audience. Get their creative juices flowing with your words. Download and present our Business PowerPoint Templates because Our PowerPoint Templates and Slides will Activate the energies of your audience. Get their creative juices flowing with your words. Present our Shapes PowerPoint Templates because you should Whip up a frenzy with our PowerPoint Templates and Slides. They will fuel the excitement of your team. Use our Process and Flows PowerPoint Templates because You are an avid believer in ethical practices. Highlight the benefits that accrue with our PowerPoint Templates and Slides. Use our Arrows PowerPoint Templates because Our PowerPoint Templates and Slides will definately Enhance the stature of your presentation. Adorn the beauty of your thoughts with their colourful backgrounds.Use these PowerPoint slides for presentations relating to Arrow, Blue, Business, Chart, Circle, Complex, Concept, Data, Diagram, Financial, Graph, Graphic, Green, Icon, Illustration, Isolated, Model, Pink, Process, Purple, Red, Round, Set, Shape, Vector, Wheel, White, Yellow. The prominent colors used in the PowerPoint template are Yellow, Red, Blue.

Crisis Chart Business PowerPoint Templates And PowerPoint Backgrounds 0811
Microsoft PowerPoint Template and Background with graph declining over time concept financial decline or credit crisis crunch over grid and clouds with cloudy sky

Crisis Chart Business PowerPoint Themes And PowerPoint Slides 0811
Microsoft PowerPoint Theme and Slide with graph declining over time concept financial decline or credit crisis crunch over grid and clouds with cloudy sky
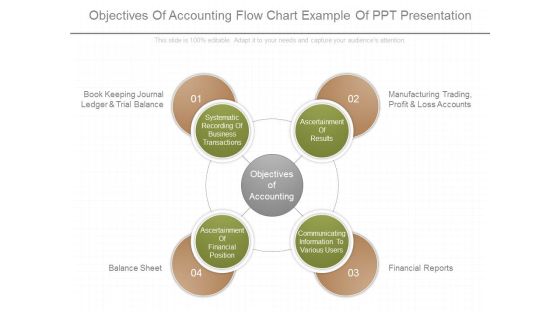
Objectives Of Accounting Flow Chart Example Of Ppt Presentation
This is a objectives of accounting flow chart example of ppt presentation. This is a four stage process. The stages in this process are book keeping journal ledger and trial balance, manufacturing trading profit and loss accounts, balance sheet, financial reports, systematic recording of business transactions, ascertainment of results, ascertainment of financial position, communicating information to various users, objectives of accounting.
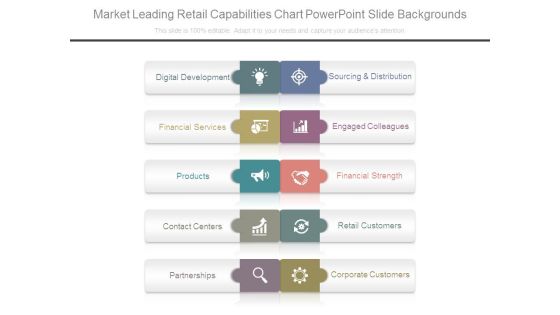
Market Leading Retail Capabilities Chart Powerpoint Slide Backgrounds
This is a market leading retail capabilities chart powerpoint slide backgrounds. This is a five stage process. The stages in this process are digital development, financial services, products, contact centers, partnerships, sourcing and distribution, engaged colleagues, financial strength, retail customers, corporate customers.
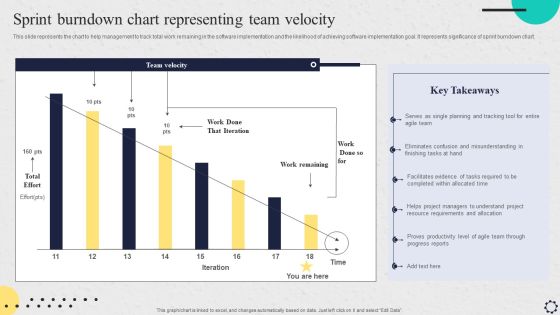
Software Implementation Strategy Sprint Burndown Chart Representing Team Velocity Brochure PDF
This slide represents the chart to help management to track total work remaining in the software implementation and the likelihood of achieving software implementation goal. It represents significance of sprint burndown chart. If your project calls for a presentation, then Slidegeeks is your go to partner because we have professionally designed, easy to edit templates that are perfect for any presentation. After downloading, you can easily edit Software Implementation Strategy Sprint Burndown Chart Representing Team Velocity Brochure PDF and make the changes accordingly. You can rearrange slides or fill them with different images. Check out all the handy templates.

Venn Diagram Showing Four Aspects Cycle Chart PowerPoint Slides
We present our venn diagram showing four aspects Cycle Chart PowerPoint Slides.Download our Venn Diagrams PowerPoint Templates because analyse your plans with equal sincerity. Use our Business PowerPoint Templates because the NASA Space programme took mankind to the moon and so much more. Like them you too can look far beyond normal boundaries. Show them that in your mind the sky is certainly not the limit. Present our Signs PowerPoint Templates because you can outline your targets to your team. Use our Leadership PowerPoint Templates because Our PowerPoint Templates and Slides will help you be quick off the draw. Just enter your specific text and see your points hit home. Download our Symbol PowerPoint Templates because this is the unerring accuracy in reaching the target. the effortless ability to launch into flight.Use these PowerPoint slides for presentations relating to Background, Business, Chart, Circle, Colorful, Concept, Diagram, Financial, Geometry, Horizontal, Math, Overlap, Process, Round, Shadow, Shape, Transparency, Venn Diagram. The prominent colors used in the PowerPoint template are Yellow, Red, Blue. We assure you our venn diagram showing four aspects Cycle Chart PowerPoint Slides are topically designed to provide an attractive backdrop to any subject. Customers tell us our Circle PowerPoint templates and PPT Slides are Pleasant. The feedback we get is that our venn diagram showing four aspects Cycle Chart PowerPoint Slides are One-of-a-kind. We assure you our Concept PowerPoint templates and PPT Slides are Elevated. People tell us our venn diagram showing four aspects Cycle Chart PowerPoint Slides are Tasteful. We assure you our Colorful PowerPoint templates and PPT Slides are Quaint.

Bar Chart Ppt PowerPoint Presentation Visual Aids Diagrams
This is a bar chart ppt powerpoint presentation visual aids diagrams. This is a two stage process. The stages in this process are business, marketing, financial years, sales in percentage, graph.

Bar Chart Ppt PowerPoint Presentation Summary File Formats
This is a bar chart ppt powerpoint presentation summary file formats. This is a two stage process. The stages in this process are business, finance, financial years, sales in percentage, graph.

Column Chart Ppt PowerPoint Presentation Infographic Template Icon
This is a column chart ppt powerpoint presentation infographic template icon. This is a two stage process. The stages in this process are business, marketing, sales in percentage, financial year, graph.

Clustered Column Chart Ppt PowerPoint Presentation Show Slideshow
This is a clustered column chart ppt powerpoint presentation show slideshow. This is a six stage process. The stages in this process are financial year in, sales in percentage, business, marketing, finance.

Area Chart Ppt PowerPoint Presentation Outline Graphics Pictures
This is a area chart ppt powerpoint presentation outline graphics pictures. This is a two stage process. The stages in this process are financial year, in percentage, business, marketing, finance.

Combo Chart Ppt PowerPoint Presentation Summary Background Images
This is a combo chart ppt powerpoint presentation summary background images. This is a two stage process. The stages in this process are business, marketing, financial year, in percentage, graph.

Combo Chart Ppt PowerPoint Presentation Gallery Design Ideas
This is a combo chart ppt powerpoint presentation gallery design ideas. This is a three stage process. The stages in this process are business, financial years, sales in percentage, finance, graph.
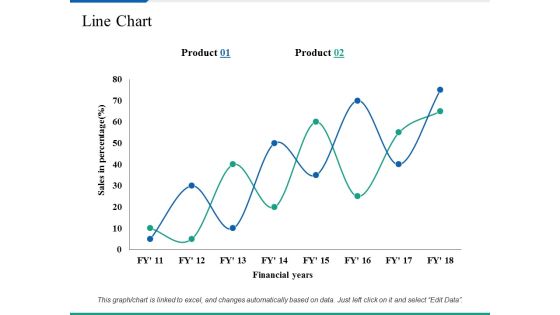
Line Chart Ppt PowerPoint Presentation Summary Clipart Images
This is a line chart ppt powerpoint presentation summary clipart images. This is a two stage process. The stages in this process are business, marketing, sales in percentage, financial years, strategy.

Information Systems Security And Risk Management Plan Doughnut Chart Rules PDF
Are you in need of a template that can accommodate all of your creative concepts This one is crafted professionally and can be altered to fit any style. Use it with Google Slides or PowerPoint. Include striking photographs, symbols, depictions, and other visuals. Fill, move around, or remove text boxes as desired. Test out color palettes and font mixtures. Edit and save your work, or work with colleagues. Download Information Systems Security And Risk Management Plan Doughnut Chart Rules PDF and observe how to make your presentation outstanding. Give an impeccable presentation to your group and make your presentation unforgettable.
Market Trends Chart With Percentage And Icons Powerpoint Slides
This PowerPoint template has been designed with graphics of chart with percentage values and icons. This PowerPoint template may be used to market trends and financial analysis. Prove the viability of your ideas using this impressive slide.

Bar Chart Ppt PowerPoint Presentation Slides Example File
This is a bar chart ppt powerpoint presentation slides example file. This is a two stage process. The stages in this process are product, financial years, sales in percentage.
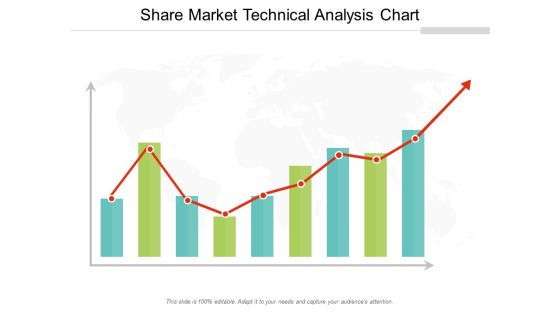
Share Market Technical Analysis Chart Ppt Powerpoint Presentation Professional Rules
This is a share market technical analysis chart ppt powerpoint presentation professional rules. This is a three stage process. The stages in this process are stock market, financial market, bull market.

Business Investment Management Flow Chart Ppt PowerPoint Presentation Outline Example Topics
This is a business investment management flow chart ppt powerpoint presentation outline example topics. This is a three stage process. The stages in this process are investment, funding, private equity, venture capital.

Business Diagram 3d Pie Chart One Blue Piece Presentation Template
This business plan power point diagram template has been designed with graphic of 3d pyramid and five stages. Explain the concept of percentage and finance related topics in your financial presentations. Use this diagram template and display linear sequential flow of any financial process.

Column Chart Ppt PowerPoint Presentation Layouts Design Inspiration
This is a column chart ppt powerpoint presentation layouts design inspiration. This is a two stage process. The stages in this process are sales in percentage, financial year in, graph, business, finance, marketing.

Bar Chart Ppt PowerPoint Presentation Pictures Background Image
This is a bar chart ppt powerpoint presentation pictures background image. This is a seven stage process. The stages in this process are financial years, sales in percentage, graph, business.

PowerPoint Theme Ring Chart Diagram Growth Ppt Template
PowerPoint Theme Ring Chart Diagram Growth PPT Template-Use this graphical approach to represent global business issues such as financial data, stock market Exchange, increase in sales, corporate presentations and more.-PowerPoint Theme Ring Chart Diagram Growth PPT Template

Area Chart Ppt PowerPoint Presentation Layouts Graphics Example
This is a area chart ppt powerpoint presentation layouts graphics example. This is a two stage process. The stages in this process are sales in percentage, financial year, business, marketing, presentation.
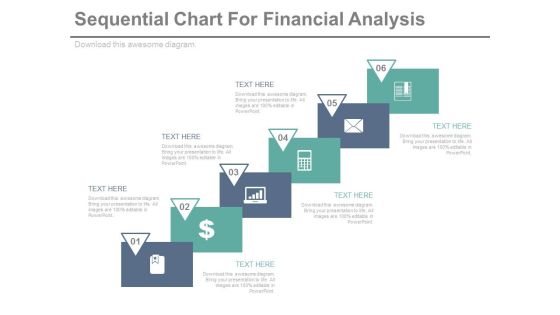
Sequential Steps Chart For Data Analysis Powerpoint Slides
This PowerPoint template has been designed sequential steps chart with icons. This PPT slide can be used to display corporate level financial strategy. You can download finance PowerPoint template to prepare awesome presentations.

Column Chart Ppt PowerPoint Presentation Slides Visual Aids
This is a column chart ppt powerpoint presentation slides visual aids. This is a six stage process. The stages in this process are bar graph, growth, success, sales in percentage, financial year.
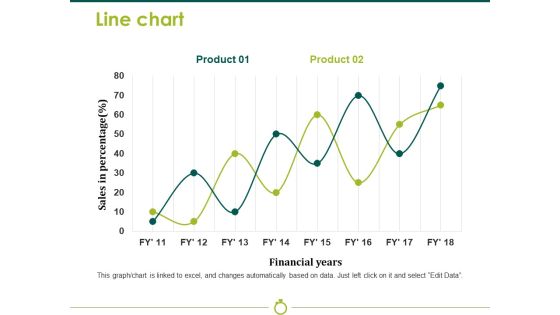
Line Chart Template 2 Ppt PowerPoint Presentation Model Background Image
This is a line chart template 2 ppt powerpoint presentation model background image. This is a two stage process. The stages in this process are sales in percentage, financial years, business, marketing, strategy, graph.
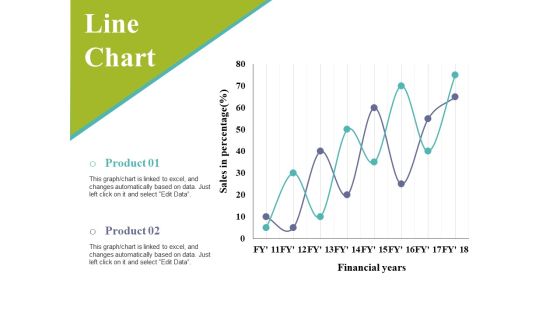
Line Chart Ppt PowerPoint Presentation Infographic Template Slides
This is a line chart ppt powerpoint presentation infographic template slides. This is a two stage process. The stages in this process are sales in percentage, financial years, business, marketing, graph.

Line Chart Ppt PowerPoint Presentation Infographic Template Master Slide
This is a line chart ppt powerpoint presentation infographic template master slide. This is a two stage process. The stages in this process are product, financial years, sales in percentage.

Four Options Circle Chart With Percentage Powerpoint Slides
This PowerPoint template has been designed with graphics of four options circle chart. This PowerPoint template may be used to display four steps of financial analysis. Prove the viability of your ideas using this impressive slide.

Column Chart Ppt PowerPoint Presentation Infographics Layout Ideas
This is a column chart ppt powerpoint presentation infographics layout ideas. This is a two stage process. The stages in this process are financial year in, business, marketing, growth, graph.

Line Chart Ppt PowerPoint Presentation Infographics Graphic Images
This is a line chart ppt powerpoint presentation infographics graphic images. This is a two stage process. The stages in this process are sales in percentage, financial years, growth, business, marketing.

Line Chart Ppt PowerPoint Presentation Professional Graphics Design
This is a line chart ppt powerpoint presentation professional graphics design. This is a two stage process. The stages in this process are financial years, sales in percentage, product, growth, success.
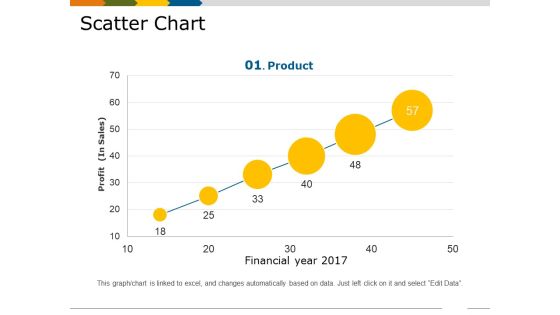
Scatter Chart Template 1 Ppt PowerPoint Presentation Show Slides
This is a scatter chart template 1 ppt powerpoint presentation show slides. This is a six stage process. The stages in this process are financial year, profit in sales, growth, business, marketing, product.

Line Bubble Chart Ppt PowerPoint Presentation Portfolio Slide Portrait
This is a line bubble chart ppt powerpoint presentation portfolio slide portrait. This is a six stage process. The stages in this process are highest profit, financial year, profit in sales, growth, business.

Circle Chart With Percentage Value Analysis Powerpoint Slides
This PowerPoint template has been designed with circular process diagram. This business diagram helps to exhibit financial process control and analysis. Use this diagram to visually support your content.

Accounting Department Organizational Chart Ppt PowerPoint Presentation Pictures Graphics
Presenting this set of slides with name accounting department organizational chart ppt powerpoint presentation pictures graphics. This is a five stage process. The stages in this process are board of directors, chief executive officer, vice presidents, chief financial officer, controller, treasurer, internal auditor, managerial accountant, financial accountant, tax accountant. This is a completely editable PowerPoint presentation and is available for immediate download. Download now and impress your audience.
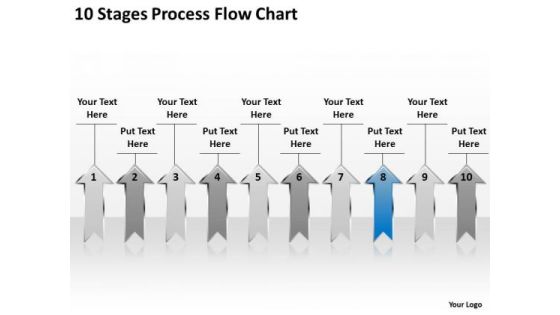
Example Of Parallel Processing 10 Stages Flow Chart PowerPoint Templates
We present our example of parallel processing 10 stages flow chart PowerPoint templates.Use our Business PowerPoint Templates because It can Conjure up grand ideas with our magical PowerPoint Templates and Slides. Leave everyone awestruck by the end of your presentation. Use our Arrows PowerPoint Templates because Our PowerPoint Templates and Slides will let you Hit the right notes. Watch your audience start singing to your tune. Download and present our Shapes PowerPoint Templates because You can Stir your ideas in the cauldron of our PowerPoint Templates and Slides. Cast a magic spell on your audience. Download and present our Success PowerPoint Templates because You can Create a matrix with our PowerPoint Templates and Slides. Feel the strength of your ideas click into place. Use our Signs PowerPoint Templates because Our PowerPoint Templates and Slides are the chords of your song. String them along and provide the lilt to your views.Use these PowerPoint slides for presentations relating to 3d, achievement, aim, arrows, business, career, chart, competition,development, direction, education, financial, forecast, forward, glossy, graph,group, growth, higher, icon, increase, investment, leader, leadership, moving,onwards, outlook, path, plan, prediction, price, profit, progress, property, race,sales, series, success, target, team, teamwork, turn, up, upwards, vector, win,winner. The prominent colors used in the PowerPoint template are Blue, Gray, White. We assure you our example of parallel processing 10 stages flow chart PowerPoint templates are the best it can get when it comes to presenting. PowerPoint presentation experts tell us our aim PowerPoint templates and PPT Slides look good visually. The feedback we get is that our example of parallel processing 10 stages flow chart PowerPoint templates will make the presenter look like a pro even if they are not computer savvy. We assure you our career PowerPoint templates and PPT Slides are designed by professionals PowerPoint presentation experts tell us our example of parallel processing 10 stages flow chart PowerPoint templates effectively help you save your valuable time. We assure you our competition PowerPoint templates and PPT Slides are specially created by a professional team with vast experience. They diligently strive to come up with the right vehicle for your brilliant Ideas.

3d Gears Chart Business Stages Online Plan PowerPoint Slides
We present our 3d gears chart business stages online plan PowerPoint Slides.Download our Industrial PowerPoint Templates because Our PowerPoint Templates and Slides will provide weight to your words. They will bring out the depth of your thought process. Download and present our Technology PowerPoint Templates because It can Conjure up grand ideas with our magical PowerPoint Templates and Slides. Leave everyone awestruck by the end of your presentation. Download our Gear Wheels PowerPoint Templates because They will Put the wind in your sails. Skim smoothly over the choppy waters of the market. Present our Business PowerPoint Templates because Our PowerPoint Templates and Slides are designed to help you succeed. They have all the ingredients you need. Download and present our Shapes PowerPoint Templates because Our PowerPoint Templates and Slides will let Your superior ideas hit the target always and everytime.Use these PowerPoint slides for presentations relating to Progress, leadership, process, design, leader, forward, process flow, gear wheel, target, achievement, business, process diagram, concept, sign, success, teamwork, symbol, diagram, graphic, finance, goal, marketing, development, gear, team, graph, chart, direction, growth, moving, company, competition, profit, increase, investment, financial, communication. The prominent colors used in the PowerPoint template are Green, Blue, Gray.

Bar Chart Ppt PowerPoint Presentation Infographics Format Ideas
This is a bar chart ppt powerpoint presentation infographics format ideas. This is a two stage process. The stages in this process are bar graph, product, financial year, sales in percentage.
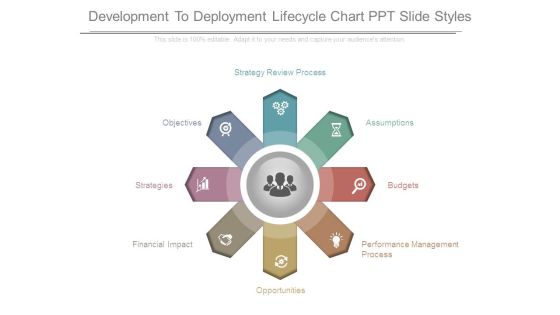
Development To Deployment Lifecycle Chart Ppt Slide Styles
This is a development to deployment lifecycle chart ppt slide styles. This is a eight stage process. The stages in this process are performance management process, opportunities, financial impact, strategies, objectives, strategy review process, assumptions, budgets.
 Home
Home