Financial Chart

X Bar And R Chart Ppt PowerPoint Presentation Background Designs
This is a x bar and r chart ppt powerpoint presentation background designs. This is a two stage process. The stages in this process are chart, business, marketing, strategy, success.
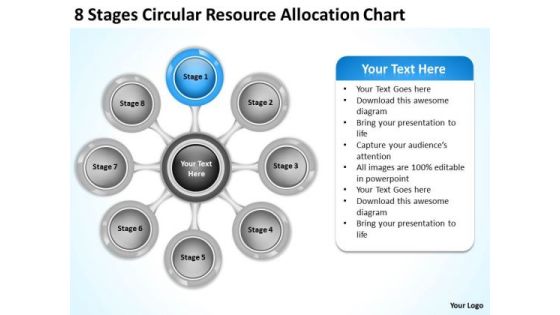
Business Strategy Implementation Resource Allocation Chart Internet
We present our business strategy implementation resource allocation chart internet.Use our Marketing PowerPoint Templates because You will get more than you ever bargained for. Use our Business PowerPoint Templates because Our PowerPoint Templates and Slides will let your words and thoughts hit bullseye everytime. Use our Circle Charts PowerPoint Templates because They will Put the wind in your sails. Skim smoothly over the choppy waters of the market. Download and present our Arrows PowerPoint Templates because Our PowerPoint Templates and Slides will bullet point your ideas. See them fall into place one by one. Present our Process and Flows PowerPoint Templates because Our PowerPoint Templates and Slides will definately Enhance the stature of your presentation. Adorn the beauty of your thoughts with their colourful backgrounds.Use these PowerPoint slides for presentations relating to 3d, Action, Analysis, Attitude, Brainstorming, Business, Chart, Classroom, Concept, Conceptual, Conference, Connection, Corporate, Design, Diagram, Direction, Element, Employee, Enhance, Financial, Formula, Future, Goal, Graphic, Guidelines, Idea, Link, Management, Market, Marketing, Mind, Mind Map, Organization, Organize, Plan, Process, Product, Relation, Render, Solutions, Strategy, Success, Successful, Tactic, Target, Text, Training, Unity. The prominent colors used in the PowerPoint template are Tan, Gray, Black.

Combo Chart Template 1 Ppt PowerPoint Presentation Themes
This is a combo chart template 1 ppt powerpoint presentation themes. This is a four stage process. The stages in this process are business, marketing, finance, timeline, management.

Combo Chart Template 2 Ppt PowerPoint Presentation Graphics
This is a combo chart template 2 ppt powerpoint presentation graphics. This is a three stage process. The stages in this process are business, marketing, finance, growth, management.
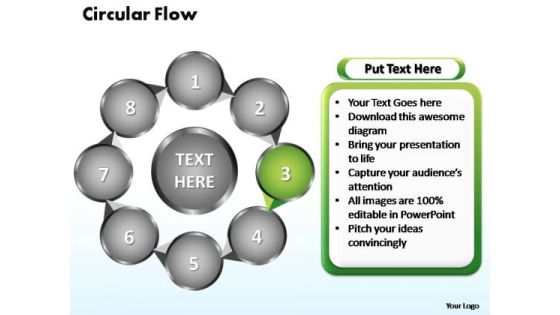
PowerPoint Slides Circular Flow Chart Ppt Theme
PowerPoint Slides Circular Flow Chart PPT Theme-Flowchart is a simple mapping tool that shows the sequence of actions within a process. Flowchart is widely used in business, education and economic presentations to help the audience visualize the content better, or to find flaws in a process.-PowerPoint Slides Circular Flow Chart PPT Theme
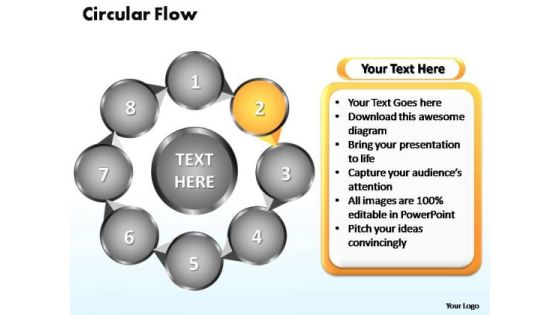
PowerPoint Slides Circular Flow Chart Ppt Themes
PowerPoint Slides Circular Flow Chart PPT Themes-Flowchart is a simple mapping tool that shows the sequence of actions within a process. Flowchart is widely used in business, education and economic presentations to help the audience visualize the content better, or to find flaws in a process.-PowerPoint Slides Circular Flow Chart PPT Themes

PowerPoint Slides Circular Flow Chart Ppt Template
PowerPoint Slides Circular Flow Chart PPT Template-Flowchart is a simple mapping tool that shows the sequence of actions within a process. Flowchart is widely used in business, education and economic presentations to help the audience visualize the content better, or to find flaws in a process.-PowerPoint Slides Circular Flow Chart PPT Template
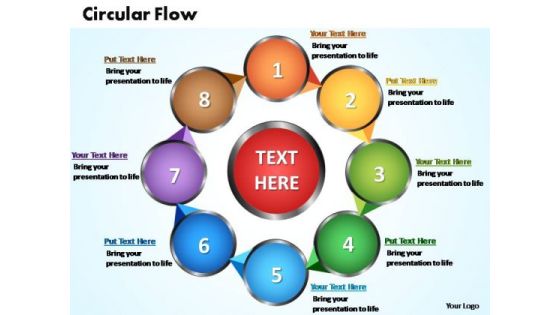
PowerPoint Slides Circular Flow Chart Ppt Templates
PowerPoint Slides Circular Flow Chart PPT Templates-Flowchart is a simple mapping tool that shows the sequence of actions within a process. Flowchart is widely used in business, education and economic presentations to help the audience visualize the content better, or to find flaws in a process.-PowerPoint Slides Circular Flow Chart PPT Templates
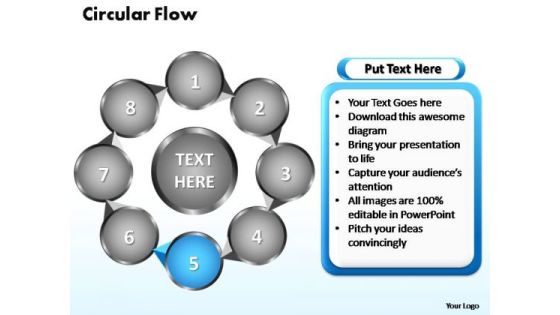
PowerPoint Slides Circular Flow Chart Ppt Design
PowerPoint Slides Circular Flow Chart PPT Design-Flowchart is a simple mapping tool that shows the sequence of actions within a process. Flowchart is widely used in business, education and economic presentations to help the audience visualize the content better, or to find flaws in a process.-PowerPoint Slides Circular Flow Chart PPT Design
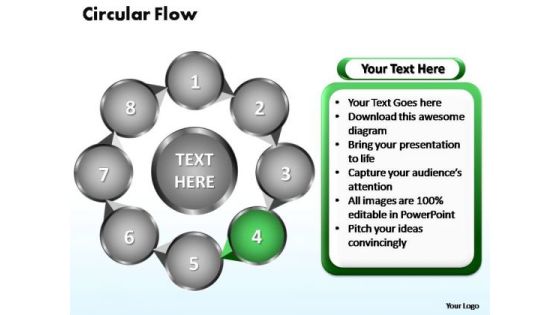
PowerPoint Slides Circular Flow Chart Ppt Designs
PowerPoint Slides Circular Flow Chart PPT Designs-Flowchart is a simple mapping tool that shows the sequence of actions within a process. Flowchart is widely used in business, education and economic presentations to help the audience visualize the content better, or to find flaws in a process.-PowerPoint Slides Circular Flow Chart PPT Designs
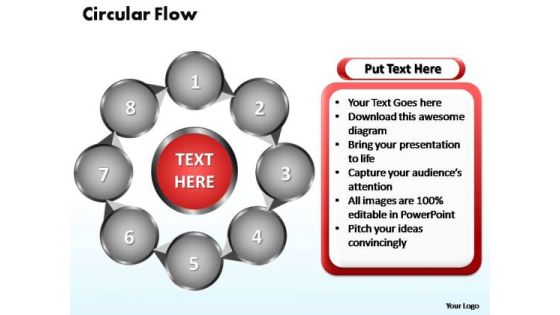
PowerPoint Slides Circular Flow Chart Ppt Layout
PowerPoint Slides Circular Flow Chart PPT Layout-Flowchart is a simple mapping tool that shows the sequence of actions within a process. Flowchart is widely used in business, education and economic presentations to help the audience visualize the content better, or to find flaws in a process.-PowerPoint Slides Circular Flow Chart PPT Layout

PowerPoint Slides Circular Flow Chart Ppt Layouts
PowerPoint Slides Circular Flow Chart PPT Layouts-Flowchart is a simple mapping tool that shows the sequence of actions within a process. Flowchart is widely used in business, education and economic presentations to help the audience visualize the content better, or to find flaws in a process.-PowerPoint Slides Circular Flow Chart PPT Layouts

PowerPoint Slides Circular Flow Chart Ppt Slide
PowerPoint Slides Circular Flow Chart PPT Slide-Flowchart is a simple mapping tool that shows the sequence of actions within a process. Flowchart is widely used in business, education and economic presentations to help the audience visualize the content better, or to find flaws in a process.-PowerPoint Slides Circular Flow Chart PPT Slide

PowerPoint Slides Circular Flow Chart Ppt Slides
PowerPoint Slides Circular Flow Chart PPT Slides-Flowchart is a simple mapping tool that shows the sequence of actions within a process. Flowchart is widely used in business, education and economic presentations to help the audience visualize the content better, or to find flaws in a process.-PowerPoint Slides Circular Flow Chart PPT Slides

PowerPoint Themes Circular Flow Chart Ppt Template
PowerPoint Themes Circular Flow Chart PPT Template-Flowchart is a simple mapping tool that shows the sequence of actions within a process. Flowchart is widely used in business, education and economic presentations to help the audience visualize the content better, or to find flaws in a process.-PowerPoint Themes Circular Flow Chart PPT Template
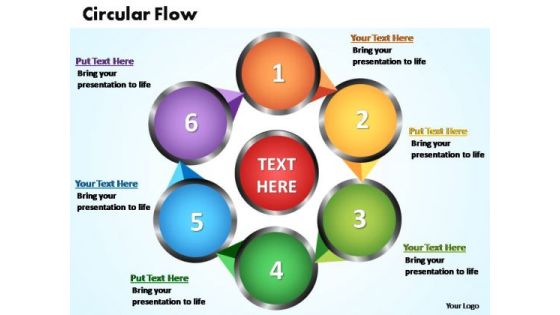
PowerPoint Themes Circular Flow Chart Ppt Templates
PowerPoint Themes Circular Flow Chart PPT Templates-Flowchart is a simple mapping tool that shows the sequence of actions within a process. Flowchart is widely used in business, education and economic presentations to help the audience visualize the content better, or to find flaws in a process.-PowerPoint Themes Circular Flow Chart PPT Templates

PowerPoint Themes Circular Flow Chart Ppt Theme
PowerPoint Themes Circular Flow Chart PPT Theme-Flowchart is a simple mapping tool that shows the sequence of actions within a process. Flowchart is widely used in business, education and economic presentations to help the audience visualize the content better, or to find flaws in a process.-PowerPoint Themes Circular Flow Chart PPT Theme

PowerPoint Themes Circular Flow Chart Ppt Design
PowerPoint Themes Circular Flow Chart PPT Design-Flowchart is a simple mapping tool that shows the sequence of actions within a process. Flowchart is widely used in business, education and economic presentations to help the audience visualize the content better, or to find flaws in a process.-PowerPoint Themes Circular Flow Chart PPT Design

PowerPoint Themes Circular Flow Chart Ppt Designs
PowerPoint Themes Circular Flow Chart PPT Designs-Flowchart is a simple mapping tool that shows the sequence of actions within a process. Flowchart is widely used in business, education and economic presentations to help the audience visualize the content better, or to find flaws in a process.-PowerPoint Themes Circular Flow Chart PPT Designs
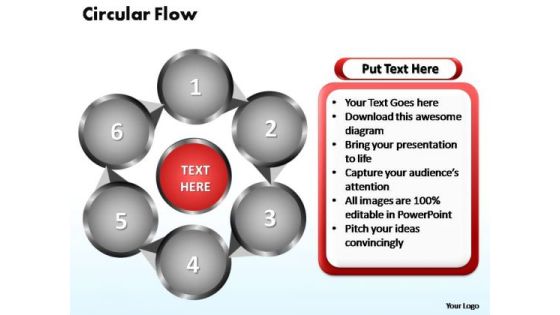
PowerPoint Themes Circular Flow Chart Ppt Layouts
PowerPoint Themes Circular Flow Chart PPT Layouts-Flowchart is a simple mapping tool that shows the sequence of actions within a process. Flowchart is widely used in business, education and economic presentations to help the audience visualize the content better, or to find flaws in a process.-PowerPoint Themes Circular Flow Chart PPT Layouts
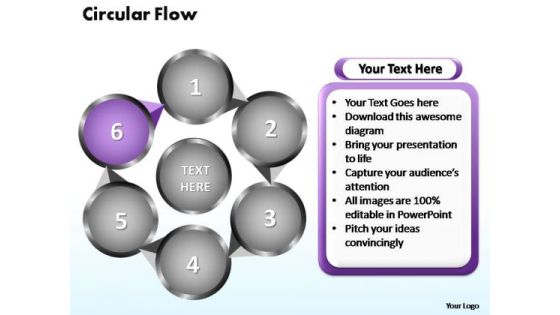
PowerPoint Themes Circular Flow Chart Ppt Slide
PowerPoint Themes Circular Flow Chart PPT Slide-Flowchart is a simple mapping tool that shows the sequence of actions within a process. Flowchart is widely used in business, education and economic presentations to help the audience visualize the content better, or to find flaws in a process.-PowerPoint Themes Circular Flow Chart PPT Slide

PowerPoint Themes Circular Flow Chart Ppt Slides
PowerPoint Themes Circular Flow Chart PPT Slides-Flowchart is a simple mapping tool that shows the sequence of actions within a process. Flowchart is widely used in business, education and economic presentations to help the audience visualize the content better, or to find flaws in a process.-PowerPoint Themes Circular Flow Chart PPT Slides

combo chart template 2 ppt powerpoint presentation background images
This is a combo chart template 2 ppt powerpoint presentation background images. This is a four stage process. The stages in this process are business, marketing, finance, timeline, product.

Retail Outlet Revenue Growth Chart Mockup PDF
This slide shows the revenue growth line chart of a retail store which includes passing footfall, customers per day, percentage of customer who purchased, revenue per day and revenue per year. Pitch your topic with ease and precision using this retail outlet revenue growth chart mockup pdf This layout presents information on Retail outlet revenue growth chart It is also available for immediate download and adjustment. So, changes can be made in the color, design, graphics or any other component to create a unique layout.

PowerPoint Theme Round Chart Marketing Ppt Slides
PowerPoint Theme Round Chart Marketing PPT Slides-This Diagram shows you the eight factors responsible for economic growth in Business .It can be used for creating Business presentations where four factors combined to result in one factor.-PowerPoint Theme Round Chart Marketing PPT Slides

Yearly Selling Forecasts Revenue Chart Summary PDF
This slide covers projections for yearly revenue generation from product sales. It includes forecasted revenue for different years and a graph depicting the projected sales revenue growth. Showcasing this set of slides titled Yearly Selling Forecasts Revenue Chart Summary PDF. The topics addressed in these templates are Project Sales Revenue, Forecasts Revenue Chart. All the content presented in this PPT design is completely editable. Download it and make adjustments in color, background, font etc. as per your unique business setting.
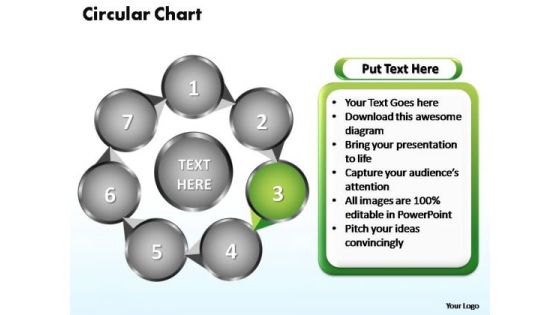
PowerPoint Designs Circular Flow Chart Ppt Theme
PowerPoint Designs Circular Flow Chart PPT Theme-Flowchart is a simple mapping tool that shows the sequence of actions within a process. Flowchart is widely used in business, education and economic presentations to help the audience visualize the content better, or to find flaws in a process.-PowerPoint Designs Circular Flow Chart PPT Theme
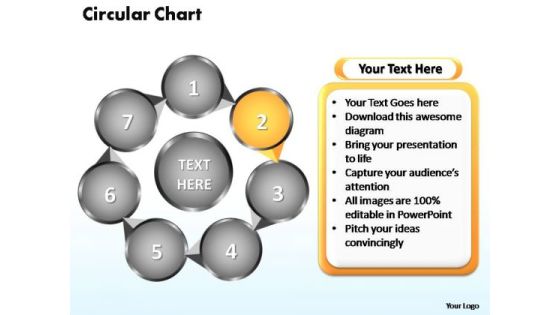
PowerPoint Designs Circular Flow Chart Ppt Themes
PowerPoint Designs Circular Flow Chart PPT Themes-Flowchart is a simple mapping tool that shows the sequence of actions within a process. Flowchart is widely used in business, education and economic presentations to help the audience visualize the content better, or to find flaws in a process.-PowerPoint Designs Circular Flow Chart PPT Themes
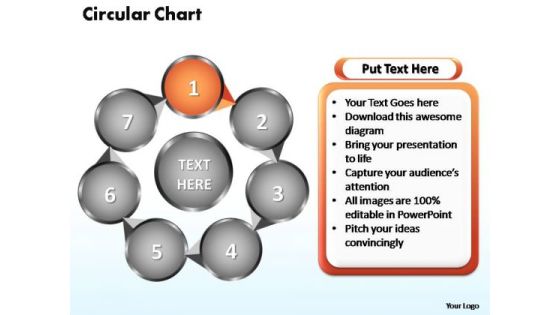
PowerPoint Designs Circular Flow Chart Ppt Template
PowerPoint Designs Circular Flow Chart PPT Template-Flowchart is a simple mapping tool that shows the sequence of actions within a process. Flowchart is widely used in business, education and economic presentations to help the audience visualize the content better, or to find flaws in a process.-PowerPoint Designs Circular Flow Chart PPT Template
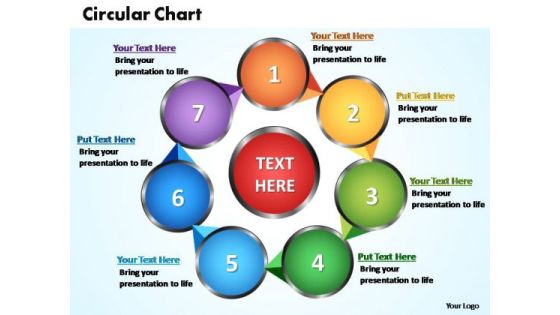
PowerPoint Designs Circular Flow Chart Ppt Templates
PowerPoint Designs Circular Flow Chart PPT Templates-Flowchart is a simple mapping tool that shows the sequence of actions within a process. Flowchart is widely used in business, education and economic presentations to help the audience visualize the content better, or to find flaws in a process.-PowerPoint Designs Circular Flow Chart PPT Templates
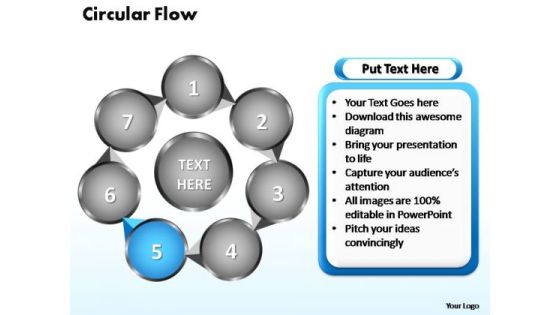
PowerPoint Designs Circular Flow Chart Ppt Design
PowerPoint Designs Circular Flow Chart PPT Design-Flowchart is a simple mapping tool that shows the sequence of actions within a process. Flowchart is widely used in business, education and economic presentations to help the audience visualize the content better, or to find flaws in a process.-PowerPoint Designs Circular Flow Chart PPT Design
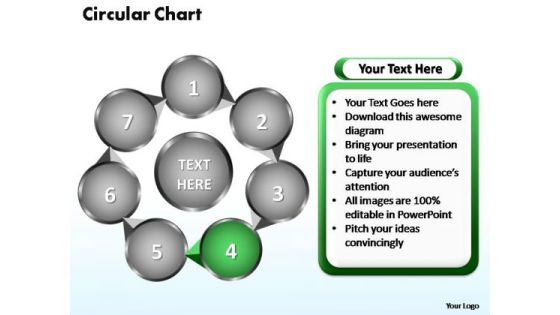
PowerPoint Designs Circular Flow Chart Ppt Designs
PowerPoint Designs Circular Flow Chart PPT Designs-Flowchart is a simple mapping tool that shows the sequence of actions within a process. Flowchart is widely used in business, education and economic presentations to help the audience visualize the content better, or to find flaws in a process.-PowerPoint Designs Circular Flow Chart PPT Designs

PowerPoint Designs Circular Flow Chart Ppt Slide
PowerPoint Designs Circular Flow Chart PPT Slide-Flowchart is a simple mapping tool that shows the sequence of actions within a process. Flowchart is widely used in business, education and economic presentations to help the audience visualize the content better, or to find flaws in a process.-PowerPoint Designs Circular Flow Chart PPT Slide
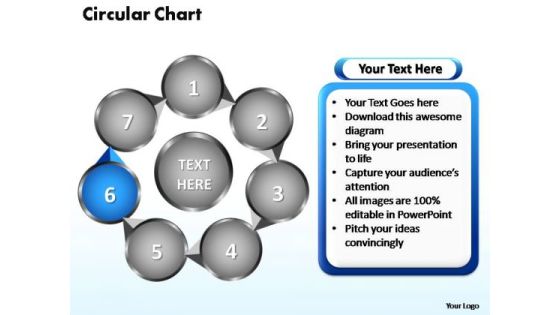
PowerPoint Designs Circular Flow Chart Ppt Slides
PowerPoint Designs Circular Flow Chart PPT Slides-Flowchart is a simple mapping tool that shows the sequence of actions within a process. Flowchart is widely used in business, education and economic presentations to help the audience visualize the content better, or to find flaws in a process.-PowerPoint Designs Circular Flow Chart PPT Slides
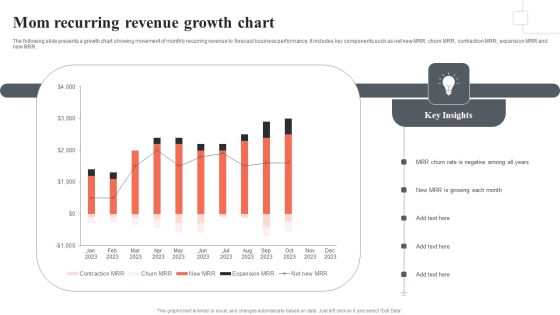
Mom Recurring Revenue Growth Chart Themes PDF
The following slide presents a growth chart showing movement of monthly recurring revenue to forecast business performance. It includes key components such as net new MRR, churn MRR, contraction MRR, expansion MRR and new MRR. Showcasing this set of slides titled Mom Recurring Revenue Growth Chart Themes PDF. The topics addressed in these templates are MRR Churn Rate, Negative, MRR Growing Each Month. All the content presented in this PPT design is completely editable. Download it and make adjustments in color, background, font etc. as per your unique business setting.

Combo Chart Finance Ppt PowerPoint Presentation Summary Images
Presenting this set of slides with name combo chart finance ppt powerpoint presentation summary images. The topics discussed in these slides are combo chart, product, growth rate, market size, financial year. This is a completely editable PowerPoint presentation and is available for immediate download. Download now and impress your audience.

Business Market Research Services Chart Slides
This is a business market research services chart slides. This is a five stage process. The stages in this process are detailed demographic and expenditure reports, competitive analysis trends and benchmarks, industry and economic profile by region, sme performance reports by sector, information on businesses in canada and north america.

Economic Order Quantity Chart Ppt Example File
This is a economic order quantity chart ppt example file. This is a four stage process. The stages in this process are inventory cost, ordering, carrying, eoq model.
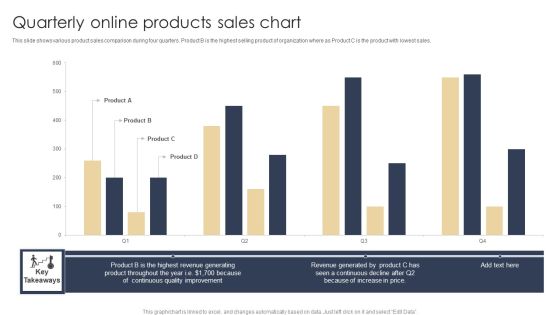
Quarterly Online Products Sales Chart Graphics PDF
This slide shows various product sales comparison during four quarters. Product B is the highest selling product of organization where as Product C is the product with lowest sales. Showcasing this set of slides titled Quarterly Online Products Sales Chart Graphics PDF. The topics addressed in these templates are Revenue Generated, Increase In Price, Quality. All the content presented in this PPT design is completely editable. Download it and make adjustments in color, background, font etc. as per your unique business setting.
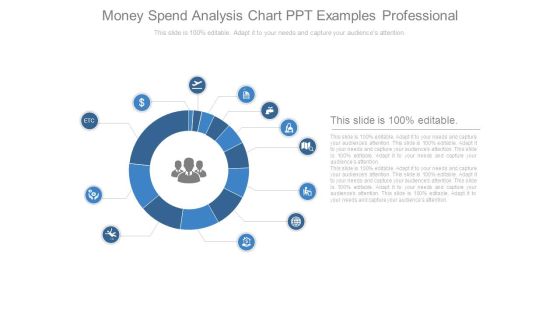
Money Spend Analysis Chart Ppt Examples Professional
This is a money spend analysis chart ppt examples professional. This is a twelve stage process. The stages in this process are marketing, business, icon, process, management.

Money Expenditure Analysis Chart Ppt Background Graphics
This is a money expenditure analysis chart ppt background graphics. This is a twelve stage process. The stages in this process are icons, strategy, business, marketing, presentation.

Human Capital Management Chart Powerpoint Topics
This is a human capital management chart powerpoint topics. This is a four stage process. The stages in this process are talent, success, career, opportunity.

Customer Onboarding Team Hierarchical Chart Designs PDF
This slide showcases structure of customer onboarding team which includes marketing, support team and sales manager. It further includes digital and affiliate marketing executive, onboarding and training specialist. Make sure to capture your audiences attention in your business displays with our gratis customizable Customer Onboarding Team Hierarchical Chart Designs PDF. These are great for business strategies, office conferences, capital raising or task suggestions. If you desire to acquire more customers for your tech business and ensure they stay satisfied, create your own sales presentation with these plain slides.

Cost Benefit Assessment Arrow Chart Presentation Outline
This is a cost benefit assessment arrow chart presentation outline. This is a two stage process. The stages in this process are compare, arrows, finance, money, strategy.

Best Business Accounting Chart Example Ppt Slides
This is a best business accounting chart example ppt slides. This is a four stage process. The stages in this process are tax, audit, balances, book keeping.
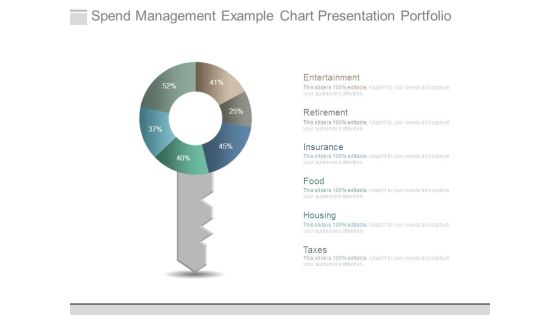
Spend Management Example Chart Presentation Portfolio
This is a spend management example chart presentation portfolio. This is a six stage process. The stages in this process are entertainment, retirement, insurance, food, housing, taxes.
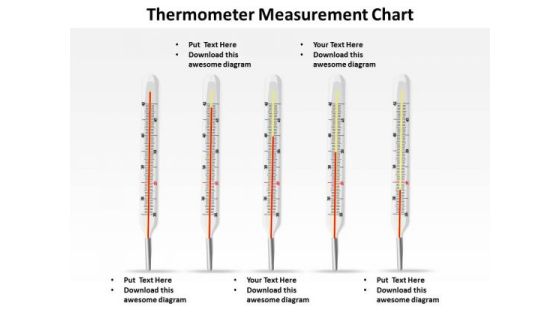
Sales Diagram Thermometer Measurement Chart Marketing Diagram
Your Grasp Of Economics Is Well Known. Help Your Audience Comprehend Issues With Our Sales Diagram Thermometer Measurement Chart Marketing Diagram Powerpoint Templates.

Business Economic Cycle Chart Ppt Templates
This is a business economic cycle chart ppt templates. This is a four stage process. The stages in this process are economic prosperity, falling prices, economic depression, rising prices.

Economic Development Administration Organization Chart Ppt Slides
This is a economic development administration organization chart ppt slides. This is a five stage process. The stages in this process are economic development, business assistance center, business development, enterprise zone, district organizing.

Value Production Flow Chart Presentation Powerpoint
This is a value production flow chart presentation powerpoint. This is a three stage process. The stages in this process are value production, cost, revenue, profit.
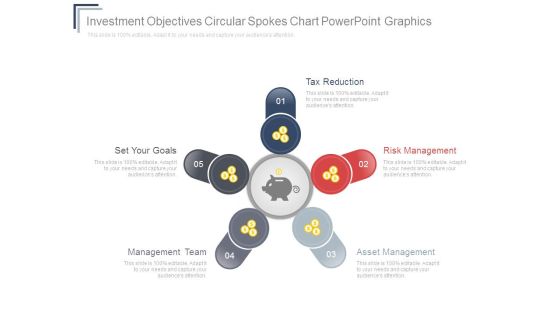
Investment Objectives Circular Spokes Chart Powerpoint Graphics
This is a investment objectives circular spokes chart powerpoint graphics. This is a five stage process. The stages in this process are tax reduction, set your goals, management team, asset management, risk management.

Revenue And Expenditures Cycle Chart Ppt Design
This is a revenue and expenditures cycle chart ppt design. This is a four stage process. The stages in this process are cash check disbursement, cash check receipt journal, bank account, bank reconciliation.

Customer Revenue Statistical Chart Powerpoint Templates Microsoft
This is a customer revenue statistical chart powerpoint templates microsoft. This is a ten stage process. The stages in this process are email, display retargeting, comparison shopping, display, affiliates, inbound free links, brand organic search, brand paid search.

Governance Growth System Chart Example Of Ppt
This is a governance growth system chart example of ppt. This is a four stage process. The stages in this process are accountable government, solid institution, political system, socio economic growth, governance.

Mutual Fund Flow Chart Ppt Presentation
This is a mutual fund flow chart ppt presentation. This is a four stage process. The stages in this process are passed back to, generates, pool their money with, invest in, returns, securities, fund manager, investors.

International Portfolio Functions Chart Ppt Examples Professional
This is a international portfolio functions chart ppt examples professional. This is a five stage process. The stages in this process are value, tools for cash, human capital, alignment, balance.

Business Model Canvas Chart Ppt Images
This is a business model canvas chart ppt images. This is a five stage process. The stages in this process are key partners, key activities, value propositions, customer relationships, customer segments, key resources, channels, cost structure, revenue streams.

Business Model Canvas Chart Example Ppt Presentation
This is a business model canvas chart example ppt presentation. This is a five stage process. The stages in this process are key partners, key activities, value propositions, customer relationships, customer segments, key resources, channels, cost structure, revenue streams.

New Business Model Chart Presentation Powerpoint Example
This is a new business model chart presentation powerpoint example. This is a five stage process. The stages in this process are key partners, key activities, value propositions, customer, relationships, customer segments, key resources, channels, cost structure, revenue streams.

Competitor Analysis Chart Ppt PowerPoint Presentation Visuals
This is a competitor analysis chart ppt powerpoint presentation visuals. This is a five stage process. The stages in this process are revenue, profit, market share, main activity, number of employee, product quality.
 Home
Home