Financial Chart

Area Chart Ppt PowerPoint Presentation Styles Designs
This is a area chart ppt powerpoint presentation styles designs. This is a two stage process. The stages in this process are area chart, product.
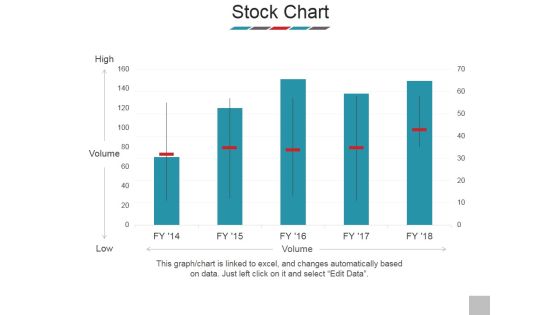
Stock Chart Ppt PowerPoint Presentation Show Templates
This is a stock chart ppt powerpoint presentation show templates. This is a five stage process. The stages in this process are high, volume, low, business, marketing.
Line Chart Ppt PowerPoint Presentation Icon Elements
This is a line chart ppt powerpoint presentation icon elements. This is a two stage process. The stages in this process are line graph, marketing, presentation, business, management.
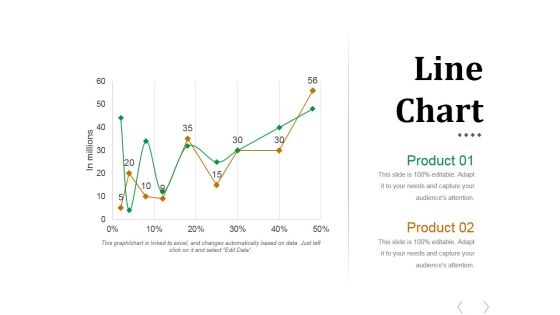
Line Chart Ppt PowerPoint Presentation Styles Outfit
This is a line chart ppt powerpoint presentation styles outfit. This is a two stage process. The stages in this process are business, finance, management, growth, planning.

Stock Chart Ppt PowerPoint Presentation Backgrounds
This is a stock chart ppt powerpoint presentation backgrounds. This is a five stage process. The stages in this process are high, volume, low, close.
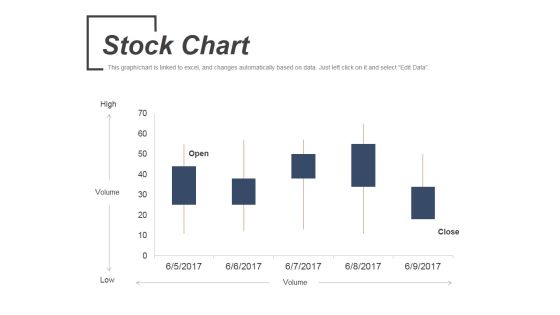
Stock Chart Ppt PowerPoint Presentation Ideas Topics
This is a stock chart ppt powerpoint presentation ideas topics. This is a five stage process. The stages in this process are volume, low, high, open, close.

Combo Chart Finance Ppt PowerPoint Presentation Clipart
This is a combo chart finance ppt powerpoint presentation pictures show. This is a two stage process. The stages in this process are finance, marketing, management, investment, analysis.
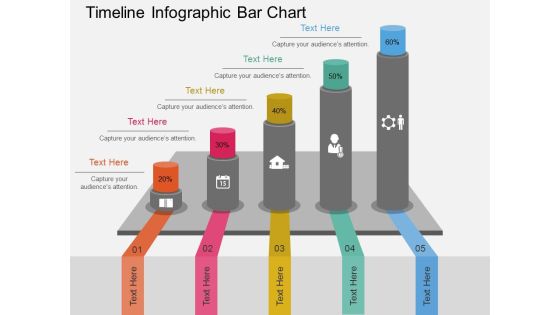
Timeline Infographic Bar Chart Powerpoint Template
This business diagram has been designed with timeline infographic bar chart. You may use this slide to display success and growth concepts. Make your mark with this unique slide and create an impression that will endure.
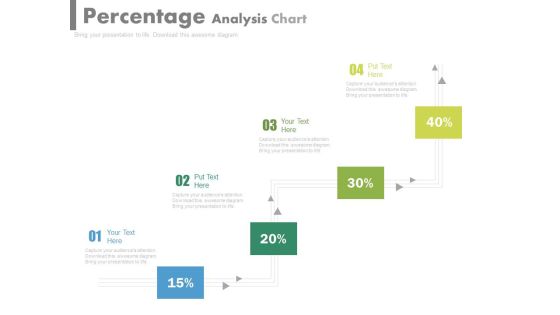
Pipeline Percentage Analysis Chart Powerpoint Slides
This PowerPoint template has been designed with pipeline percentage analysis chart. This PPT slide can be used to display business strategy plan. You can download finance PowerPoint template to prepare awesome presentations.
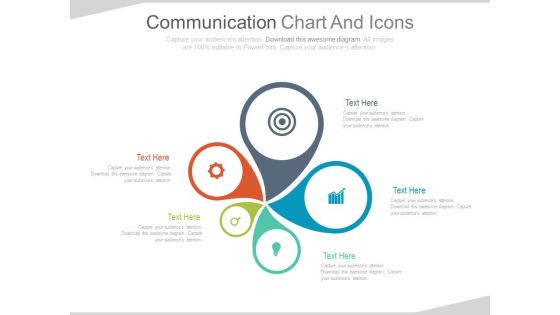
Infographic Chart For Marketing Information Powerpoint Slides
This PowerPoint template contains circular infographic chart. You may download this PPT slide to display marketing information in visual manner. You can easily customize this template to make it more unique as per your need.

Line Chart Ppt PowerPoint Presentation Professional Smartart
This is a line chart ppt powerpoint presentation professional smartart. This is a two stage process. The stages in this process are in percentage, in years, product, finance, business.
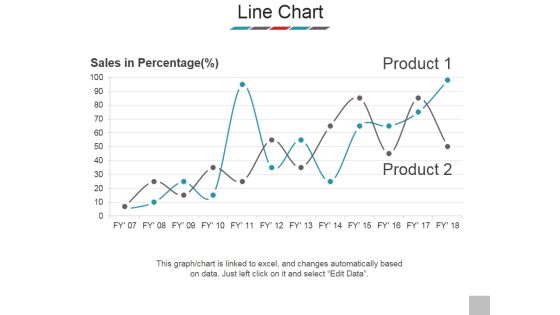
Line Chart Ppt PowerPoint Presentation Outline Samples
This is a line chart ppt powerpoint presentation outline samples. This is a two stage process. The stages in this process are sales in percentage, product, business, marketing, success.

Combo Chart Ppt PowerPoint Presentation Styles Good
This is a combo chart ppt powerpoint presentation styles good. This is a eight stage process. The stages in this process are market size, growth rate, product, growth, strategy, graph, finance.
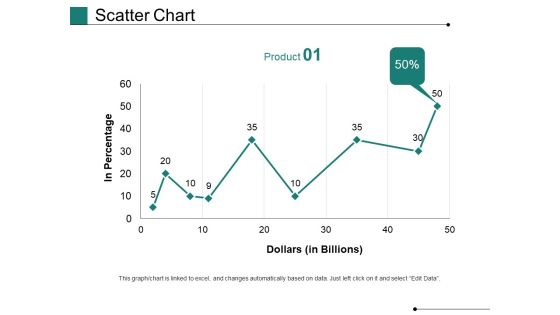
Scatter Chart Ppt PowerPoint Presentation Gallery Show
This is a scatter chart ppt powerpoint presentation gallery show. This is a one stage process. The stages in this process are in percentage, dollars, business, marketing, growth, graph.

Combo Chart Ppt PowerPoint Presentation Portfolio Themes
This is a combo chart ppt powerpoint presentation portfolio themes. This is a three stage process. The stages in this process are market size, product, management, finance, chart, marketing.
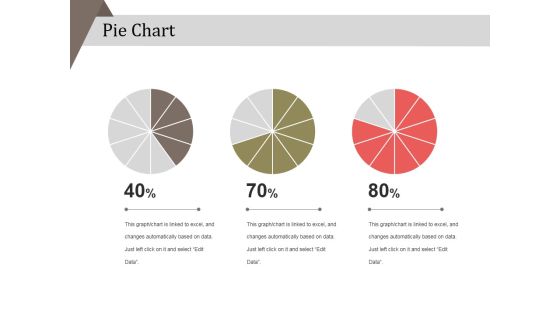
Pie Chart Ppt PowerPoint Presentation Layouts Example
This is a pie chart ppt powerpoint presentation layouts example. This is a three stage process. The stages in this process are business, strategy, analysis, pie chart, finance, marketing.

Combo Chart Ppt PowerPoint Presentation Model Gallery
This is a combo chart ppt powerpoint presentation model gallery. This is a eight stage process. The stages in this process are business, marketing, management, growth, timeline.

Alternative Assessment Chart Powerpoint Slide Designs
This is a alternative assessment chart powerpoint slide designs. This is a two stage process. The stages in this process are business, marketing, percentage, finance, success.
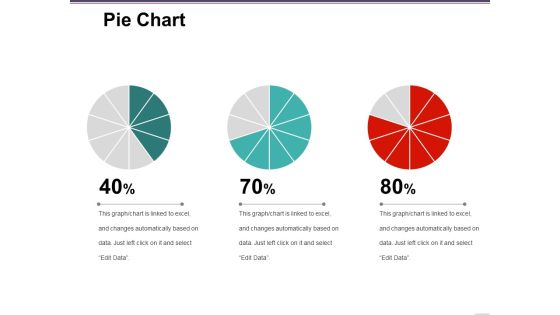
Pie Chart Ppt PowerPoint Presentation Layouts Good
This is a pie chart ppt powerpoint presentation layouts good. This is a three stage process. The stages in this process are finance, marketing, management, process, business.

Accounting Payable Procedure Flow Chart Guidelines PDF
This slide consists of a basic process of financial accounting which is followed by accounts payable department to verify invoices against orders and make payment to avoid delays. The key elements are purchase order acceptance, approval, sending purchase order email to vendor etc. Pitch your topic with ease and precision using this Accounting Payable Procedure Flow Chart Guidelines PDF. This layout presents information on Purchasing, Operations, Process. It is also available for immediate download and adjustment. So, changes can be made in the color, design, graphics or any other component to create a unique layout.
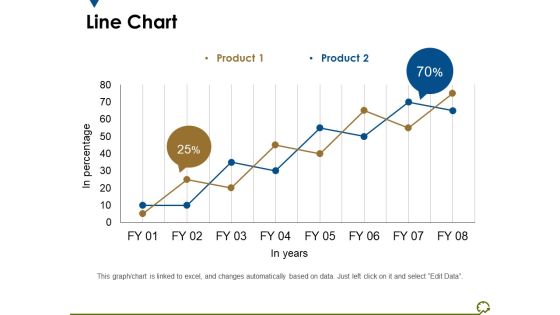
Line Chart Ppt PowerPoint Presentation Outline Diagrams
This is a line chart ppt powerpoint presentation outline diagrams. This is a two stage process. The stages in this process are in percentage, in years, percentage, business, marketing.
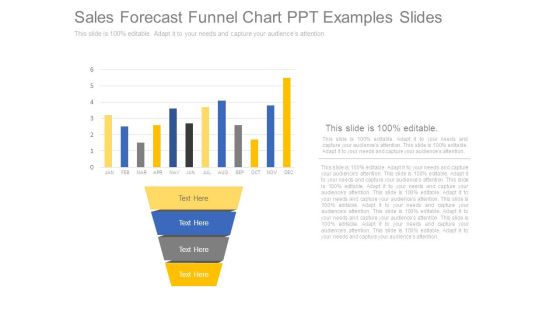
Sales Forecast Funnel Chart Ppt Examples Slides
This is a sales forecast funnel chart ppt examples slides. This is a four stage process. The stages in this process are jan, feb, mar, apr, may, jun, jul, aug, sep, oct, nov, dec.
Scatter Bubble Chart Ppt PowerPoint Presentation Icon Templates
This is a scatter bubble chart ppt powerpoint presentation icon templates. This is a eight stage process. The stages in this process are business, finance, management, scatter chart, marketing.

Stock Chart Ppt PowerPoint Presentation Slides Example File
This is a stock chart ppt powerpoint presentation slides example file. This is a five stage process. The stages in this process are business, finance, stock chart, management, planning.
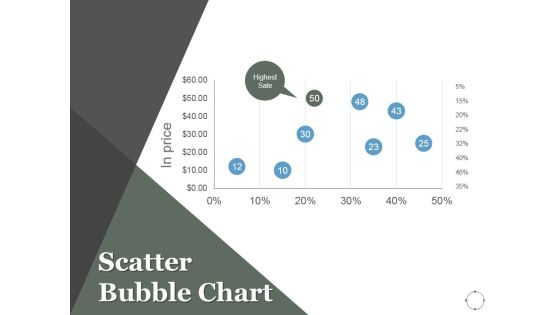
Scatter Bubble Chart Ppt PowerPoint Presentation Background Designs
This is a scatter bubble chart ppt powerpoint presentation background designs. This is a eight stage process. The stages in this process are projects, marketing, scatter chart, finance, management.

Combo Chart Ppt PowerPoint Presentation Portfolio Template
This is a combo chart ppt powerpoint presentation portfolio template. This is a three stage process. The stages in this process are product, business, marketing, combo chart, percentage.

Combo Chart Ppt PowerPoint Presentation Icon Portrait
This is a combo chart ppt powerpoint presentation icon portrait. This is a three stage process. The stages in this process are combo chart, finance, marketing, strategy, analysis.

Area Chart Ppt PowerPoint Presentation Outline Deck
This is a area chart ppt powerpoint presentation outline deck. This is a two stage process. The stages in this process are area chart, finance, marketing, analysis, business.

Arrow Steps Chart For Business Success Powerpoint Template
This PowerPoint template has been designed with graphics of arrow steps chart. Download this slide for planning of financial targets. Grab the attention of your listeners with this PPT slide.

data collection and analysis control chart ppt powerpoint presentation styles
This is a data collection and analysis control chart ppt powerpoint presentation styles. This is a one stage process. The stages in this process are upper limit, centerline, plotted points, lower limit, point labels.
Email Marketing Performance Chart Ppt PowerPoint Presentation Icon Design Inspiration
This is a email marketing performance chart ppt powerpoint presentation icon design inspiration. This is a nine stage process. The stages in this process are email marketing performance chart, business, marketing, strategy, success.
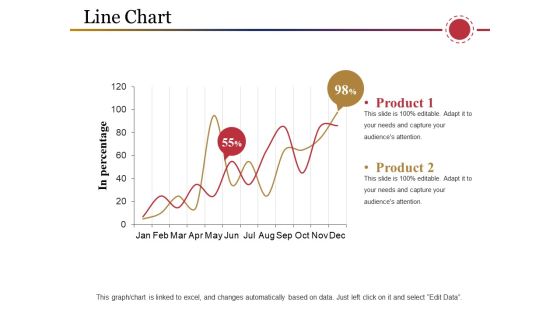
Line Chart Ppt PowerPoint Presentation Inspiration Samples
This is a line chart ppt powerpoint presentation inspiration samples. This is a two stage process. The stages in this process are product, in percentage, business, marketing, graph.

Area Chart Ppt PowerPoint Presentation Infographic Template Portrait
This is a area chart ppt powerpoint presentation infographic template portrait. This is a two stage process. The stages in this process are business, marketing, strategy, planning, finance.

Competitive Analysis Bubble Chart Ppt PowerPoint Presentation Templates
This is a competitive analysis bubble chart ppt powerpoint presentation templates. This is a six stage process. The stages in this process are product, business, management, marketing, strategy.

Stock Chart Ppt PowerPoint Presentation Summary Background Designs
This is a stock chart ppt powerpoint presentation summary background designs. This is a five stage process. The stages in this process are high, volume, low.

Doughnut Chart Ppt PowerPoint Presentation Visual Aids Files
This is a doughnut chart ppt powerpoint presentation visual aids files. This is a three stage process. The stages in this process are finance, donut, percentage, business, marketing.

Email Marketing Performance Chart Ppt Powerpoint Presentation Pictures Show
This is a email marketing performance chart ppt powerpoint presentation pictures show. This is a nine stage process. The stages in this process are finance, planning, marketing, business, management, strategy.
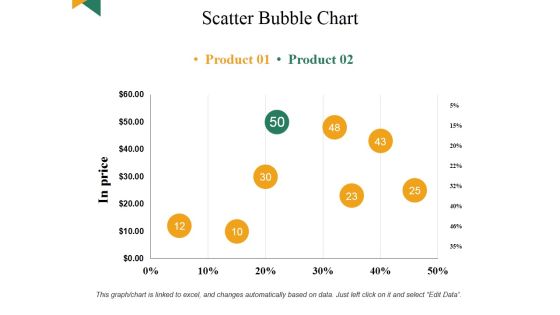
Scatter Bubble Chart Ppt PowerPoint Presentation Summary Visual Aids
This is a scatter bubble chart ppt powerpoint presentation summary visual aids. This is a eight stage process. The stages in this process are business, marketing, finance, analysis, planning.

Data Collection And Analysis Control Chart Ppt PowerPoint Presentation Visuals
This is a data collection and analysis control chart ppt powerpoint presentation visuals. This is a ten stage process. The stages in this process are upper limit, centerline, lower limit, plotted points.

Column Chart Ppt PowerPoint Presentation Styles Graphic Tips
This is a column chart ppt powerpoint presentation styles graphic tips. This is a six stage process. The stages in this process are slide bar, business, marketing, strategy, finance.

Information Systems Security And Risk Management Plan Cyber Attacks Faced By Organization In Previous Financial Year Graphics PDF
This slide showcases information security attacks faced by organization in past financial year. It can help company to assess different type of cyber attacks and formulate strategies to tackle them. If your project calls for a presentation, then Slidegeeks is your go-to partner because we have professionally designed, easy to edit templates that are perfect for any presentation. After downloading, you can easily edit Information Systems Security And Risk Management Plan Cyber Attacks Faced By Organization In Previous Financial Year Graphics PDF and make the changes accordingly. You can rearrange slides or fill them with different images. Check out all the handy templates

Lead Scoring Chart Powerpoint Slide Background
This is a lead scoring chart powerpoint slide background. This is a six stage process. The stages in this process are measurable roi on lead generation program, increased conversion rates from qualified lead to opportunity, increased sales productivity and effectiveness, shortened sales cycle, better forecast and pipeline visibility, better alignment of marketing and sales efforts.

Business Flow Chart PowerPoint Presentations Process Slides
We present our business flow chart powerpoint presentations process Slides.Use our Advertising PowerPoint Templates because this PPt slide can educate your listeners on the relevance and importance of each one as per your plan and how they all contribute as you strive to hit the Bullseye. Present our Business PowerPoint Templates because the great Bald headed Eagle embodies your personality. the eagle eye to seize upon the smallest of opportunities. Download and present our Marketing PowerPoint Templates because that was the well known Musketeers call. Use our Finance PowerPoint Templates because you envisage some areas of difficulty in the near future. The overall financial situation could be a source of worry. Download and present our Shapes PowerPoint Templates because there is a key aspect to be emphasised.Use these PowerPoint slides for presentations relating to Analysis, Business, Concept, Design, Diagram, Direction, Goals, Guide, Icon, Idea, Management, Model, Opportunity, Organization, Performance, Plan, Process, Project, Representation, Resource, Strategy, Swot. The prominent colors used in the PowerPoint template are Blue, Black, Gray. PowerPoint presentation experts tell us our business flow chart powerpoint presentations process Slides are Perfect. Professionals tell us our Diagram PowerPoint templates and PPT Slides are Striking. People tell us our business flow chart powerpoint presentations process Slides are Appealing. We assure you our Icon PowerPoint templates and PPT Slides are Endearing. PowerPoint presentation experts tell us our business flow chart powerpoint presentations process Slides are Appealing. Professionals tell us our Direction PowerPoint templates and PPT Slides effectively help you save your valuable time.
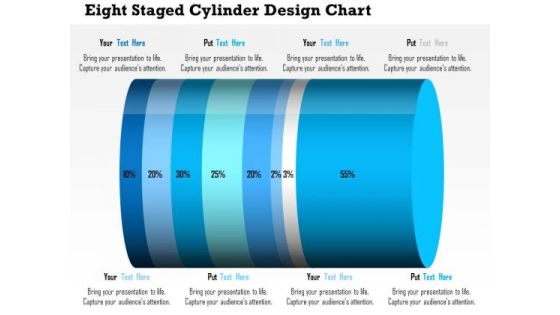
Business Daigram Eight Staged Cylinder Design Chart Presentation Templets
This business diagram contains eight staged cylinder design chart with percentage ratio. Download this diagram to display financial analysis. Use this diagram to make business and marketing related presentations.
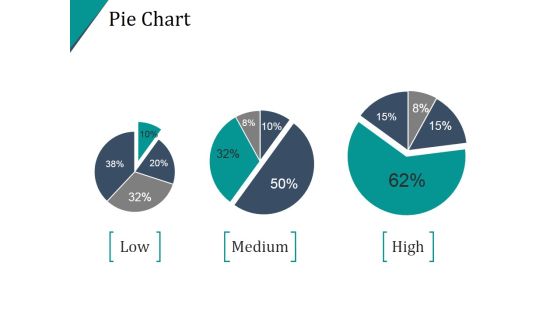
Pie Chart Template Ppt PowerPoint Presentation Example 2015
This is a pie chart template ppt powerpoint presentation example 2015. This is a four stage process. The stages in this process are pie, division, percentage, finance, analysis.
Pie Chart Ppt PowerPoint Presentation Icon Graphics Download
This is a pie chart ppt powerpoint presentation icon graphics download. This is a four stage process. The stages in this process are pie, finance, analysis, marketing, percentage.
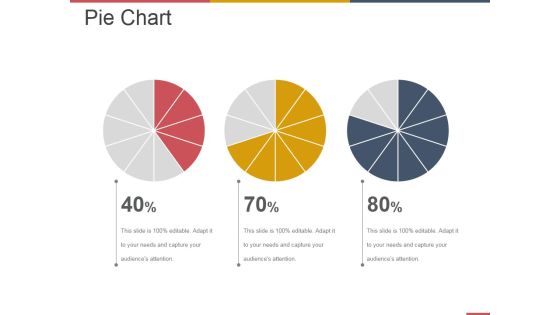
Pie Chart Ppt PowerPoint Presentation Professional Example File
This is a pie chart ppt powerpoint presentation professional example file. This is a three stage process. The stages in this process are business, strategy, marketing, analysis, finance.
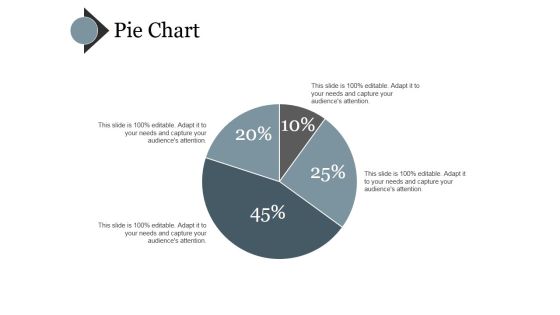
Pie Chart Ppt PowerPoint Presentation Pictures File Formats
This is a pie chart ppt powerpoint presentation pictures file formats. This is a four stage process. The stages in this process are finance, pie, business, marketing, strategy.
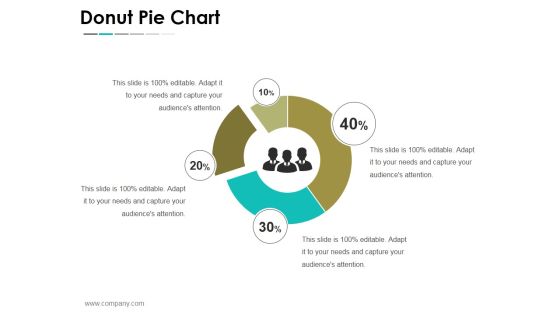
Donut Pie Chart Ppt PowerPoint Presentation File Slideshow
This is a donut pie chart ppt powerpoint presentation file slideshow. This is a four stage process. The stages in this process are business, strategy, analysis, planning, donut pie chart.

Combo Chart Ppt PowerPoint Presentation Infographics Example Topics
This is a combo chart ppt powerpoint presentation infographics example topics. This is a eight stage process. The stages in this process are business, marketing, growth, combo chart, management.

Competitive Analysis Scatter Chart Ppt PowerPoint Presentation Samples
This is a competitive analysis scatter chart ppt powerpoint presentation samples. This is a six stage process. The stages in this process are competitive, analysis, business, marketing, management.

combo chart template 1 ppt powerpoint presentation show
This is a combo chart template 1 ppt powerpoint presentation show. This is a four stage process. The stages in this process are business, marketing, finance, analysis, growth.

Combo Chart Template 2 Ppt PowerPoint Presentation Guidelines
This is a combo chart template 2 ppt powerpoint presentation guidelines. This is a four stage process. The stages in this process are business, marketing, growth, product, timeline.

Donut Pie Chart Ppt PowerPoint Presentation Professional Templates
This is a donut pie chart ppt powerpoint presentation professional templates. This is a three stage process. The stages in this process are finance, donut, business, marketing, strategy.

Pie Chart Ppt PowerPoint Presentation Slides Graphics Download
This is a pie chart ppt powerpoint presentation slides graphics download. This is a four stage process. The stages in this process are business, marketing, pie, finance, analysis.

Donut Pie Chart Ppt PowerPoint Presentation File Mockup
This is a donut pie chart ppt powerpoint presentation file mockup. This is a three stage process. The stages in this process are finance, business, percentage, marketing.

Donut Pie Chart Ppt PowerPoint Presentation Slides Outfit
This is a donut pie chart ppt powerpoint presentation slides outfit. This is a three stage process. The stages in this process are product, percentage, business, process, management.

Daunt Pie Chart Ppt PowerPoint Presentation Show Gallery
This is a daunt pie chart ppt powerpoint presentation show gallery. This is a five stage process. The stages in this process are business, marketing, teamwork, communication, strategy.
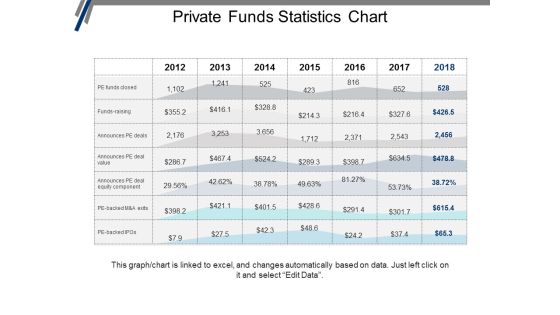
Private Funds Statistics Chart Ppt PowerPoint Presentation Portfolio Graphics Design
This is a private funds statistics chart ppt powerpoint presentation portfolio graphics design. This is a seven stage process. The stages in this process are investment, funding, private equity, venture capital.
Donut Pie Chart Ppt PowerPoint Presentation Icon Background Images
This is a donut pie chart ppt powerpoint presentation icon background images. This is a four stage process. The stages in this process are donut, process, planning, percentage, finance.
 Home
Home