Financial Chart

Stock Chart Ppt PowerPoint Presentation Slides
This is a stock chart ppt powerpoint presentation slides. This is a five stage process. The stages in this process are close, volume, high, low.
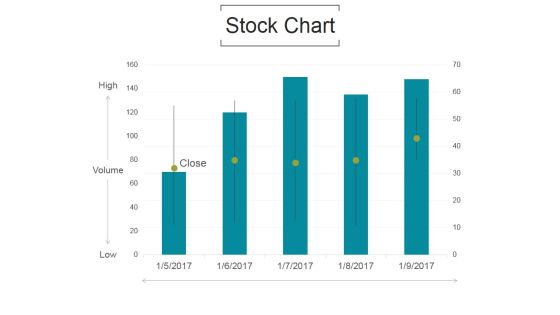
Stock Chart Ppt PowerPoint Presentation Example File
This is a stock chart ppt powerpoint presentation example file. This is a five stage process. The stages in this process are volume, high, low, close.

Stock Chart Ppt PowerPoint Presentation Inspiration
This is a stock chart ppt powerpoint presentation inspiration. This is a five stage process. The stages in this process are high, volume, low, close.
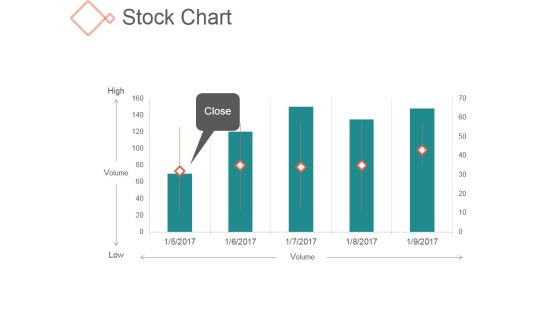
Stock Chart Ppt PowerPoint Presentation Professional
This is a stock chart ppt powerpoint presentation professional. This is a five stage process. The stages in this process are high, volume, low, close.
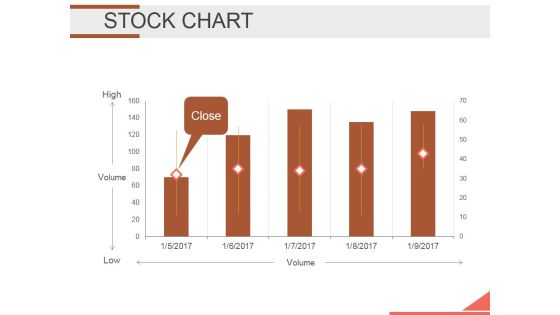
Stock Chart Ppt PowerPoint Presentation Topics
This is a stock chart ppt powerpoint presentation topics. This is a five stage process. The stages in this process are high, volume, low, volume.
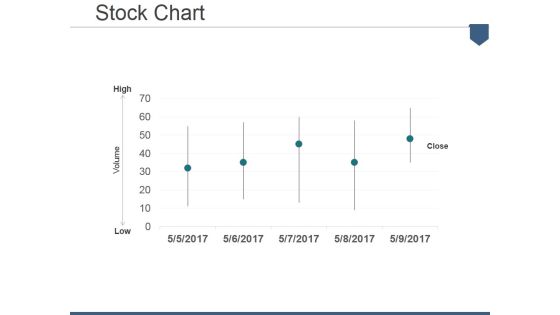
Stock Chart Ppt PowerPoint Presentation Show Layout
This is a stock chart ppt powerpoint presentation show layout. This is a five stage process. The stages in this process are low, volume, high, close.
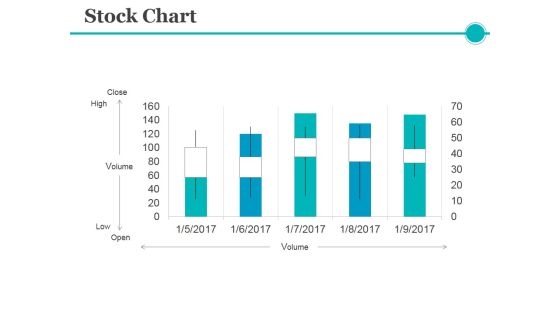
Stock Chart Ppt PowerPoint Presentation Ideas Example
This is a stock chart ppt powerpoint presentation ideas example. This is a five stage process. The stages in this process are volume, close, high, low, open.

Stock Chart Ppt PowerPoint Presentation Ideas Brochure
This is a stock chart ppt powerpoint presentation ideas brochure. This is a five stage process. The stages in this process are high, volume, low, close.
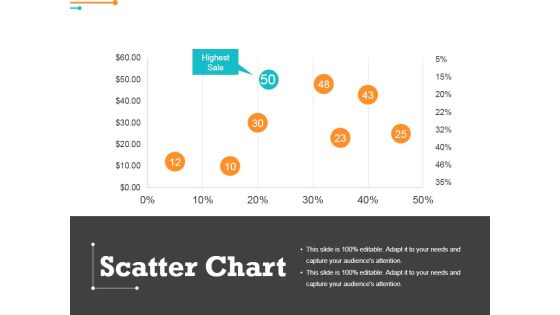
Scatter Chart Ppt PowerPoint Presentation Outline Graphics
This is a scatter chart ppt powerpoint presentation outline graphics. This is a eight stage process. The stages in this process are highest sale, percentage, finance, business.
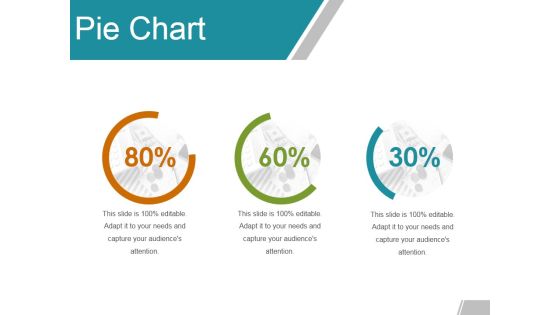
Pie Chart Ppt PowerPoint Presentation Summary Slide
This is a pie chart ppt powerpoint presentation summary slide. This is a three stage process. The stages in this process are percentage, finance, marketing, business.

Stock Chart Ppt PowerPoint Presentation Portfolio Infographics
This is a stock chart ppt powerpoint presentation portfolio infographics. This is a five stage process. The stages in this process are high, volume, low, finance, business.

Area Chart Ppt PowerPoint Presentation Slides Inspiration
This is a area chart ppt powerpoint presentation slides inspiration. This is a two stage process. The stages in this process are business, marketing, finance, growth, management.
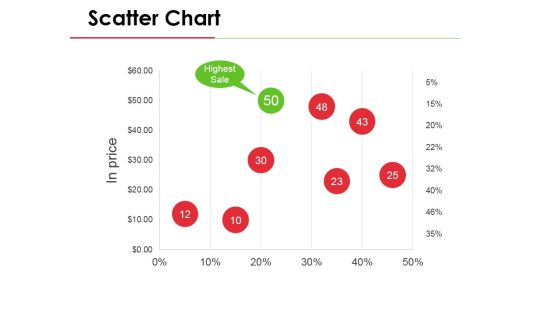
Scatter Chart Ppt PowerPoint Presentation Model Deck
This is a scatter chart ppt powerpoint presentation model deck. This is a eight stage process. The stages in this process are business, marketing, finance, management, strategy.

Line Chart Ppt PowerPoint Presentation Gallery Summary
This is a line chart ppt powerpoint presentation gallery summary. This is a two stage process. The stages in this process are finance, graph, business, management, marketing.

Area Chart Ppt PowerPoint Presentation Slides Gridlines
This is a area chart ppt powerpoint presentation slides gridlines. This is a two stage process. The stages in this process are business, finance, marketing, percentage.

Stock Chart Ppt PowerPoint Presentation Gallery Files
This is a stock chart ppt powerpoint presentation gallery files. This is a five stage process. The stages in this process are high, volume, low, close.
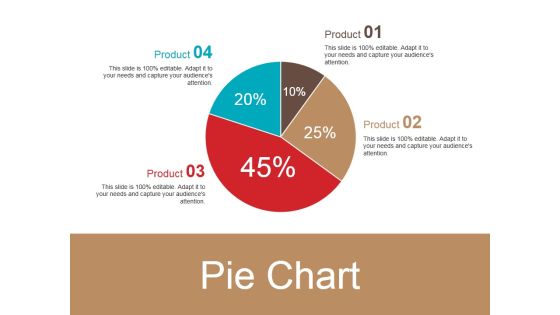
Pie Chart Ppt PowerPoint Presentation Ideas Slideshow
This is a pie chart ppt powerpoint presentation ideas slideshow. This is a four stage process. The stages in this process are pie, process, percentage, finance, business.

Line Chart Ppt PowerPoint Presentation Portfolio Shapes
This is a line chart ppt powerpoint presentation portfolio shapes. This is a two stage process. The stages in this process are profit, product, business, marketing, graph.
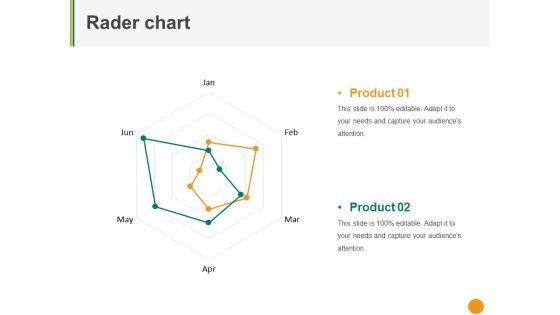
Rader Chart Ppt PowerPoint Presentation Professional Pictures
This is a rader chart ppt powerpoint presentation professional pictures. This is a two stage process. The stages in this process are product, finance, business, marketing.

Bar Chart Ppt PowerPoint Presentation Summary Pictures
This is a bar chart ppt powerpoint presentation summary pictures. This is a four stage process. The stages in this process are product, unit count, finance, percentage, business.
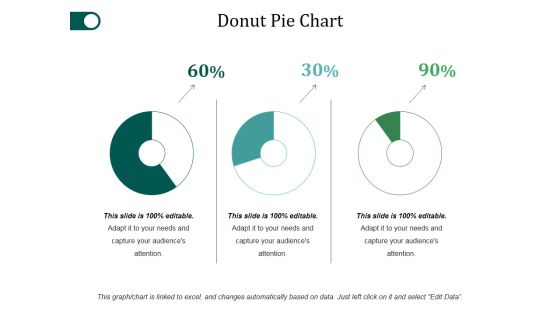
Donut Pie Chart Ppt PowerPoint Presentation Examples
This is a donut pie chart ppt powerpoint presentation examples. This is a three stage process. The stages in this process are percentage, finance, donut, business.

Bubble Chart Ppt PowerPoint Presentation Outline Smartart
This is a bubble chart ppt powerpoint presentation outline smartart. This is a two stage process. The stages in this process are analysis, finance, business, marketing, strategy.

Column Chart Ppt PowerPoint Presentation Slides Format
This is a column chart ppt powerpoint presentation slides format. This is a two stage process. The stages in this process are finance, marketing, management, investment, analysis.

Column Chart Ppt PowerPoint Presentation Show Outfit
This is a column chart ppt powerpoint presentation show outfit. This is a two stage process. The stages in this process are product, percentage, marketing.

Combo Chart Ppt PowerPoint Presentation Model Grid
This is a combo chart ppt powerpoint presentation model grid. This is a three stage process. The stages in this process are growth, product, percentage, marketing.

Line Chart Ppt PowerPoint Presentation Summary Guidelines
This is a line chart ppt powerpoint presentation summary guidelines. This is a two stage process. The stages in this process are percentage, product, business, management, marketing.

Stock Chart Ppt PowerPoint Presentation Show Pictures
This is a stock chart ppt powerpoint presentation show pictures. This is a five stage process. The stages in this process are product, percentage, management, marketing.

Column Chart Ppt PowerPoint Presentation Gallery Templates
This is a column chart ppt powerpoint presentation gallery templates. This is a two stage process. The stages in this process are management, marketing, business, percentage.

Column Chart Ppt PowerPoint Presentation Ideas Example
This is a column chart ppt powerpoint presentation ideas example. This is a five stage process. The stages in this process are percentage, product, management, marketing.
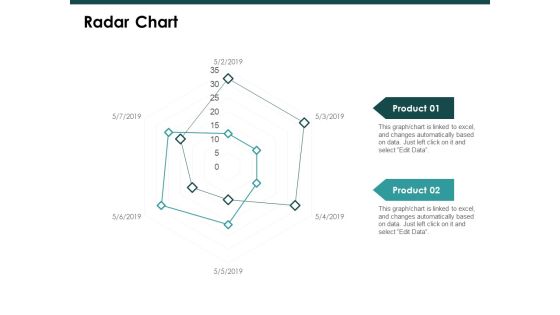
Radar Chart Graph Ppt PowerPoint Presentation Slide
This is a radar chart graph ppt powerpoint presentation slide. This is a two stage process. The stages in this process are finance, marketing, management, investment, analysis.

Pie Chart Finance Ppt Powerpoint Presentation Introduction
This is a pie chart finance ppt powerpoint presentation introduction. This is a three stage process. The stages in this process are finance, marketing, analysis, investment, strategy.

Data Maturity Assessment Chart Icon Demonstration PDF
Persuade your audience using this Data Maturity Assessment Chart Icon Demonstration PDF. This PPT design covers three stages, thus making it a great tool to use. It also caters to a variety of topics including Data Maturity, Assessment Chart Icon. Download this PPT design now to present a convincing pitch that not only emphasizes the topic but also showcases your presentation skills.

Bar Chart Ppt PowerPoint Presentation Background Designs
This is a bar chart ppt powerpoint presentation background designs. This is a twelve stage process. The stages in this process are bar graph, finance, marketing, strategy, analysis, investment.

Column Chart Ppt PowerPoint Presentation Background Designs
This is a column chart ppt powerpoint presentation background designs. This is a two stage process. The stages in this process are bar graph, finance, marketing, strategy, analysis, business.

Combo Chart Ppt PowerPoint Presentation Infographics Infographics
This is a combo chart ppt powerpoint presentation infographics infographics. This is a three stage process. The stages in this process are bar graph, growth, finance, marketing, strategy, business.

Bar Chart Ppt PowerPoint Presentation Portfolio Icons
This is a bar chart ppt powerpoint presentation portfolio icons. This is a seven stage process. The stages in this process are in years, in percentage, finance, business marketing.

Executive Retention Incentive Programs Chart Microsoft PDF
This slide represents retention incentive policy chart illustrating situations such as divestiture of business units, appointment of new head, workforce reduction and bankruptcy. Presenting Executive Retention Incentive Programs Chart Microsoft PDF to dispense important information. This template comprises four stages. It also presents valuable insights into the topics including Potential Retention Situation, Workforce Reduction, Anticipated Bankruptcy. This is a completely customizable PowerPoint theme that can be put to use immediately. So, download it and address the topic impactfully.

Environmental Management Accounting System Chart Ppt Slides
This is a environmental management accounting system chart ppt slides. This is a six stage process. The stages in this process are overheads, environmental cost, direct labour, environmental cost, direct material, environmental cost.
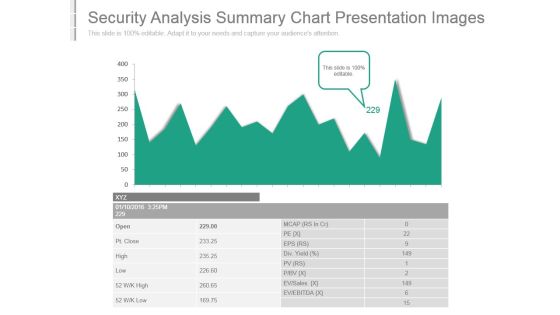
Security Analysis Summary Chart Presentation Images
This is a security analysis summary chart presentation images. This is a one stage process. The stages in this process are ev ebitda, ev sales, div yield, open, pt close, high, low, mcap, eps.

Scatter Chart Ppt PowerPoint Presentation Summary Visuals
This is a scatter chart ppt powerpoint presentation summary visuals. This is a eight stage process. The stages in this process are product, profit in sales, in percentage, finance, business.

Project Management Gantt Chart Ppt Powerpoint Images
This is a project management gantt chart ppt powerpoint images. This is a seven stage process. The stages in this process are requirement, setup, development, testing, deployment, training, support, project ma, review, coding, integration tests, customer tests, go live, training, support, project management.
Pie Chart Ppt PowerPoint Presentation Outline Icons
This is a pie chart ppt powerpoint presentation outline icons. This is a three stage process. The stages in this process are pie chart, finance, marketing, strategy, business.
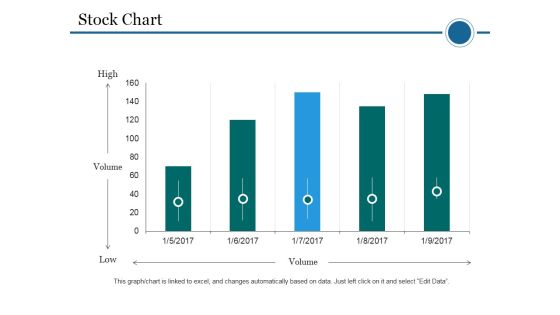
Stock Chart Ppt PowerPoint Presentation Professional Vector
This is a stock chart ppt powerpoint presentation professional vector. This is a five stage process. The stages in this process are stock chart, volume, high, low.

Area Chart Ppt PowerPoint Presentation Inspiration Images
This is a area chart ppt powerpoint presentation inspiration images. This is a two stage process. The stages in this process are area chart, product, sales in percentage.
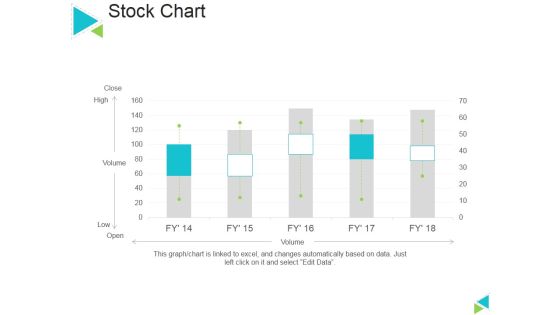
Stock Chart Ppt PowerPoint Presentation Ideas Slideshow
This is a stock chart ppt powerpoint presentation ideas slideshow. This is a five stage process. The stages in this process are stock chart, close, volume, open.
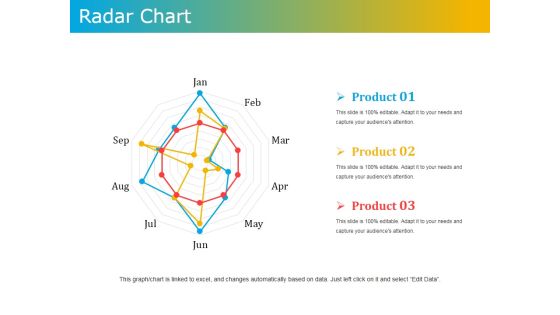
Radar Chart Ppt PowerPoint Presentation Outline Model
This is a radar chart ppt powerpoint presentation outline model. This is a three stage process. The stages in this process are radar chart, product, business, marketing, management.

Column Chart Ppt PowerPoint Presentation Influencers
This is a column chart ppt powerpoint presentation influencers. This is a two stage process. The stages in this process are column chart, finance, marketing, strategy, analysis, business.

Pie Chart Ppt PowerPoint Presentation Ideas Microsoft
This is a pie chart ppt powerpoint presentation ideas microsoft. This is a four stage process. The stages in this process are pie chart, finance, marketing, strategy, business.

Column Chart Ppt PowerPoint Presentation File Graphics
This is a column chart ppt powerpoint presentation file graphics. This is a two stage process. The stages in this process are column chart, finance, analysis, marketing, business.

Pie Chart Ppt PowerPoint Presentation Outline Gallery
This is a pie chart ppt powerpoint presentation outline gallery. This is a five stage process. The stages in this process are pie chart, finance, marketing, strategy, analysis.
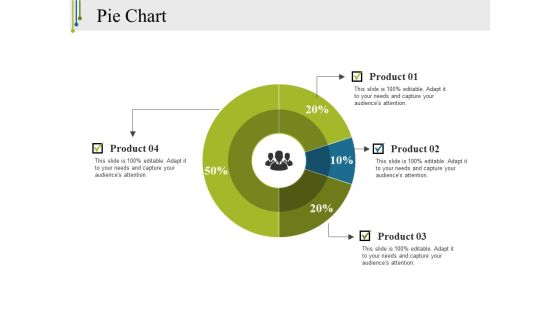
Pie Chart Ppt PowerPoint Presentation Infographics Clipart
This is a pie chart ppt powerpoint presentation infographics clipart. This is a four stage process. The stages in this process are pie chart, finance, marketing, strategy, business.

Business Process Maturity Factors Chart Information PDF
The slide carries a maturity factors for successful execution of business process management function . Various levels included are silo, tactical integration, process orientation, optimized enterprise and intelligent network. Persuade your audience using this Business Process Maturity Factors Chart Information PDF. This PPT design covers one stages, thus making it a great tool to use. It also caters to a variety of topics including Information Technology, Process Management, Employee Management. Download this PPT design now to present a convincing pitch that not only emphasizes the topic but also showcases your presentation skills.

Combo Chart Ppt PowerPoint Presentation Gallery Mockup
This is a clustered column ppt powerpoint presentation portfolio good. This is a three stage process. The stages in this process are business, marketing, strategy, finance, planning.
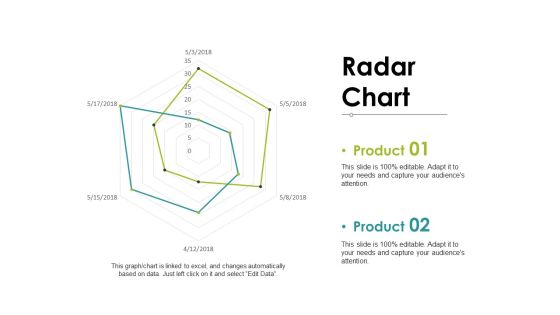
Radar Chart Ppt PowerPoint Presentation Ideas Mockup
This is a stacked column ppt powerpoint presentation pictures layouts. This is a two stage process. The stages in this process are business, marketing, planning, finance, strategy.

Bar Chart Ppt PowerPoint Presentation Outline Infographics
This is a bar chart ppt powerpoint presentation outline infographics. This is a two stage process. The stages in this process are bar chart, finance, marketing, strategy, analysis, business.
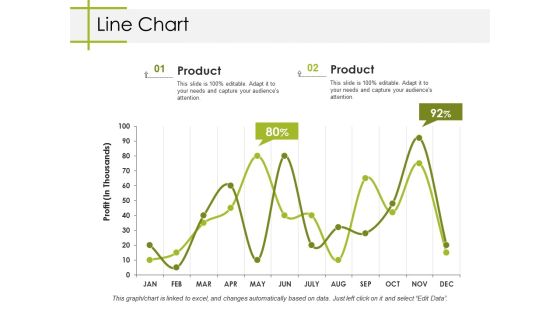
Line Chart Ppt PowerPoint Presentation Ideas Templates
This is a line chart ppt powerpoint presentation ideas templates. This is a two stage process. The stages in this process are line chart, growth, finance, marketing, analysis, business.

Area Chart Ppt PowerPoint Presentation Inspiration Rules
This is a area chart ppt powerpoint presentation inspiration rules. This is a two stage process. The stages in this process are area chart, business, marketing, sales in percentage, product.

Stock Chart Ppt PowerPoint Presentation Guidelines
This is a stock chart ppt powerpoint presentation guidelines. This is a five stage process. The stages in this process are high, volume, low, close.
Pie Chart Ppt PowerPoint Presentation Infographics Icons
This is a pie chart ppt powerpoint presentation infographics icons. This is a three stage process. The stages in this process are pie chart, finance, analysis, marketing, strategy.

Line Chart Ppt PowerPoint Presentation Layouts Information
This is a line chart ppt powerpoint presentation layouts information. This is a two stage process. The stages in this process are business, marketing, line chart, analysis, growth.
 Home
Home