Percentage Infographic

Clustered Column Ppt PowerPoint Presentation Infographic Template Backgrounds
This is a clustered column ppt powerpoint presentation infographic template backgrounds. This is a two stage process. The stages in this process are sales in percentage, financial year, product.
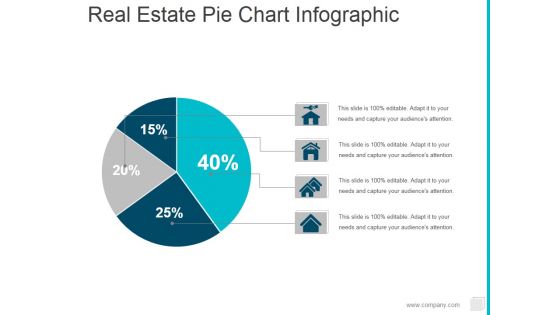
Real Estate Pie Chart Infographic Ppt PowerPoint Presentation Ideas Shapes
This is a real estate pie chart infographic ppt powerpoint presentation ideas shapes. This is a four stage process. The stages in this process are pie, finance, marketing, percentage.
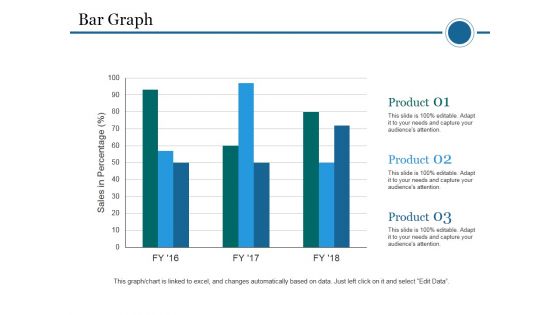
Bar Graph Ppt PowerPoint Presentation Infographic Template Template
This is a bar graph ppt powerpoint presentation infographic template template. This is a three stage process. The stages in this process are bar graph, sales in percentage, product, planning, business.

Line Chart Ppt PowerPoint Presentation Infographic Template Introduction
This is a line chart ppt powerpoint presentation infographic template introduction. This is a two stage process. The stages in this process are product, sales in percentage, financial years, line chart.
Line Chart Ppt PowerPoint Presentation Infographic Template Icons
This is a line chart ppt powerpoint presentation infographic template icons. This is a two stage process. The stages in this process are sales in percentage, financial years, product, line chart.
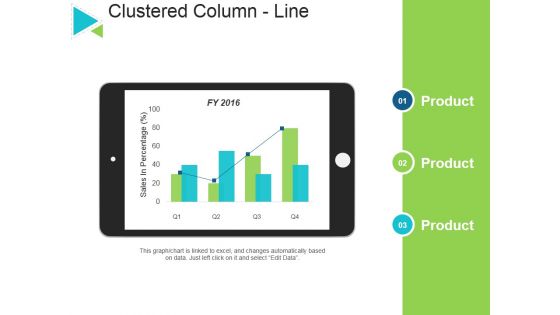
Clustered Column Line Ppt PowerPoint Presentation Outline Infographic Template
This is a clustered column line ppt powerpoint presentation outline infographic template. This is a three stage process. The stages in this process are product, sales in percentage, business, marketing, success.

Market Analysis Summary Ppt PowerPoint Presentation Infographic Template Example File
This is a market analysis summary ppt powerpoint presentation infographic template example file. This is a six stage process. The stages in this process are icons, percentage, finance, analysis, marketing.
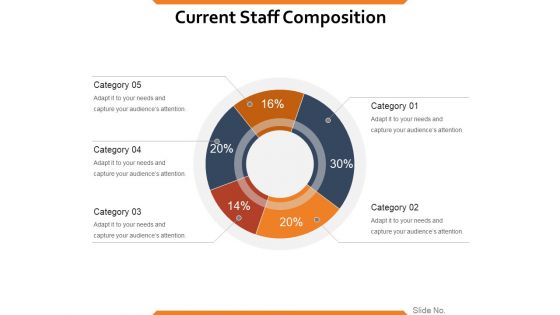
Current Staff Composition Ppt PowerPoint Presentation Infographic Template Show
This is a current staff composition ppt powerpoint presentation infographic template show. This is a five stage process. The stages in this process are process, percentage, business, marketing, management.
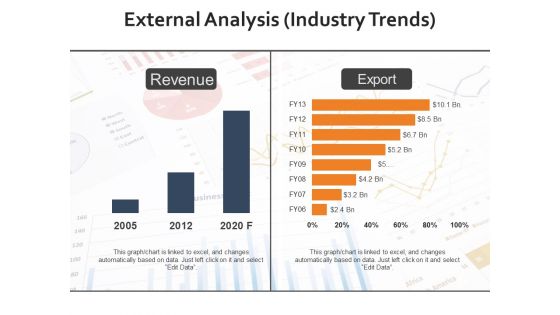
External Analysis Industry Trends Ppt PowerPoint Presentation Infographic Template Visuals
This is a external analysis industry trends ppt powerpoint presentation infographic template visuals. This is a two stage process. The stages in this process are export, revenue, percentage, years, business, analysis.

Management Team Template 2 Ppt PowerPoint Presentation Slides Infographic Template
This is a management team template 2 ppt powerpoint presentation slides infographic template. This is a four stage process. The stages in this process are lily albert, john parker, mary finder, tom smith, percentage.
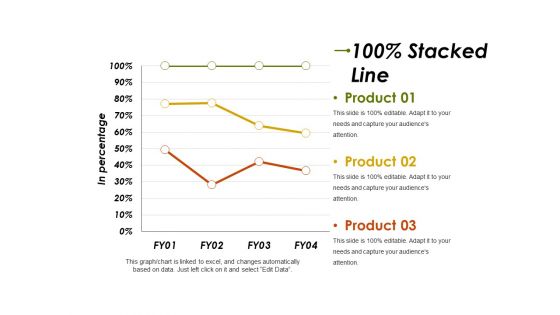
Stacked Line Ppt PowerPoint Presentation Infographic Template Graphics Template
This is a stacked line ppt powerpoint presentation infographic template graphics template. This is a three stage process. The stages in this process are product, in percentage, business, marketing, finance.
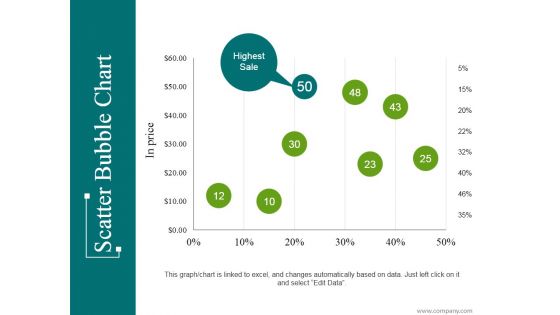
Scatter Bubble Chart Ppt PowerPoint Presentation Infographic Template Introduction
This is a scatter bubble chart ppt powerpoint presentation infographic template introduction. This is a eight stage process. The stages in this process are highest sale, business, marketing, percentage, finance.
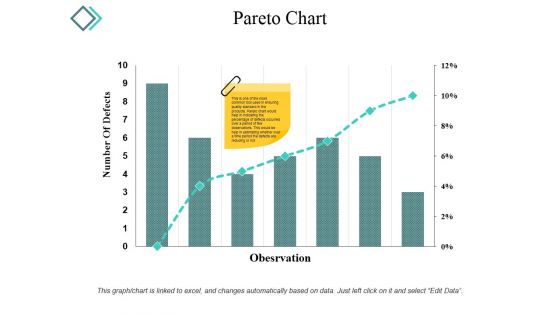
Pareto Chart Ppt PowerPoint Presentation Infographic Template Microsoft
This is a pareto chart ppt powerpoint presentation infographic template microsoft. This is a seven stage process. The stages in this process are number of defects, observation, graph, percentage, business.

Donut Pie Chart Ppt PowerPoint Presentation Infographic Template Aids
This is a donut pie chart ppt powerpoint presentation infographic template aids. This is a three stage process. The stages in this process are chart, business, management, process, percentage.

Mind Map Ppt PowerPoint Presentation Infographic Template Graphics Tutorials
This is a mind map ppt powerpoint presentation infographic template graphics tutorials. This is a four stage process. The stages in this process are mind map, percentage, business, management, brainstorming.

Magnifying Glass Ppt PowerPoint Presentation Infographic Template Graphics Download
This is a magnifying glass ppt powerpoint presentation infographic template graphics download. This is a two stage process. The stages in this process are magnifying glass, business, marketing, percentage, technology.
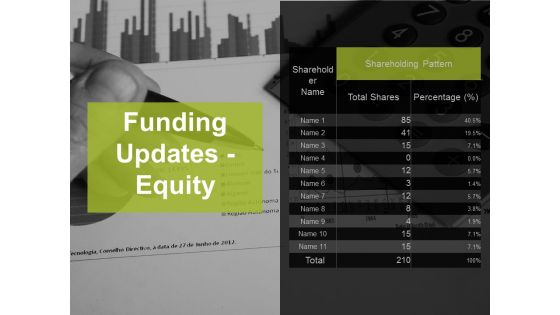
Funding Updates Equity Ppt PowerPoint Presentation Infographic Template Format
This is a funding updates equity ppt powerpoint presentation infographic template format. This is a three stage process. The stages in this process are total shares, percentage, business, marketing, planning.
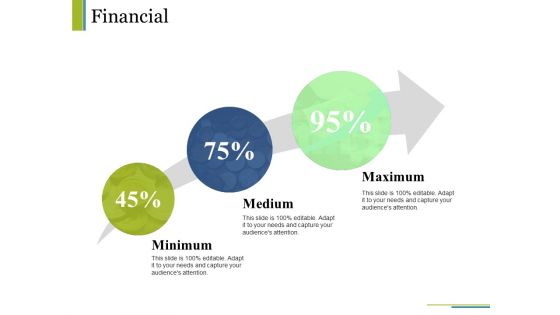
Financial Ppt PowerPoint Presentation Infographic Template Clipart Images
This is a financial ppt powerpoint presentation infographic template clipart images. This is a three stage process. The stages in this process are business, minimum, medium, maximum, financial, percentage.
Column Chart Ppt PowerPoint Presentation Infographic Template Icon
This is a column chart ppt powerpoint presentation infographic template icon. This is a two stage process. The stages in this process are business, marketing, sales in percentage, financial year, graph.
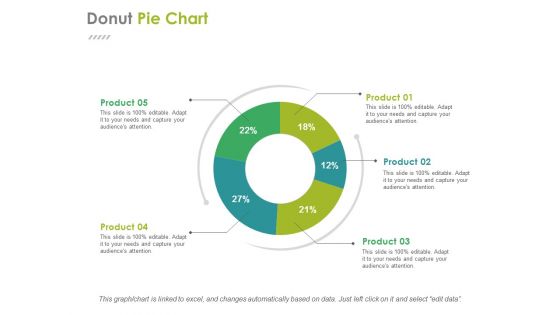
Donut Pie Chart Ppt PowerPoint Presentation File Infographic Template
This is a donut pie chart ppt powerpoint presentation file infographic template. This is a five stage process. The stages in this process are business, management, process, percentage, chart.
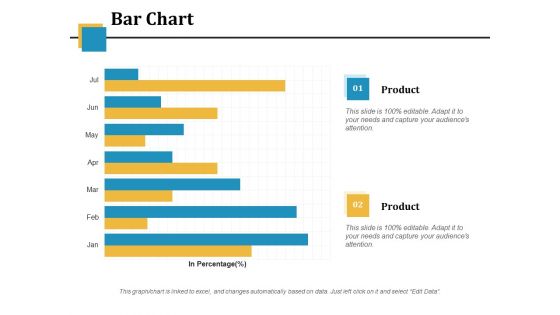
Bar Chart Ppt PowerPoint Presentation Infographic Template Picture
This is a bar chart ppt powerpoint presentation infographic template picture. This is a two stage process. The stages in this process are financial, in percentage, business, marketing, bar chart.
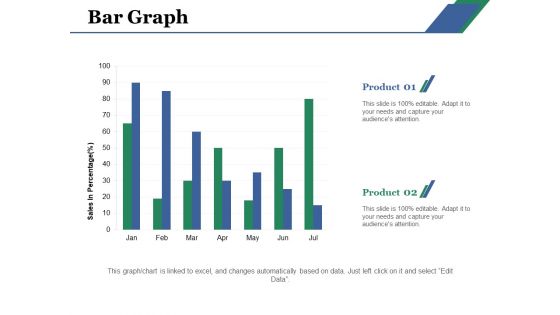
Bar Graph Ppt PowerPoint Presentation Infographic Template Demonstration
This is a bar graph ppt powerpoint presentation infographic template demonstration. This is a two stage process. The stages in this process are bar graph, product, sales, percentage, financial.

Scatter Diagram Ppt PowerPoint Presentation Infographic Template Design Ideas
This is a scatter diagram ppt powerpoint presentation infographic template design ideas. This is a one stage process. The stages in this process are scatter diagram, finance, in percentage, business, bar graph.

Bar Chart Ppt PowerPoint Presentation Infographic Template Graphics Design
This is a bar chart ppt powerpoint presentation infographic template graphics design. This is a five stage process. The stages in this process are management, marketing, business, percentage, product.

Donut Pie Chart Ppt PowerPoint Presentation Infographic Template Slides
This is a donut pie chart ppt powerpoint presentation infographic template slides. This is a three stage process. The stages in this process are percentage, product, business, management, marketing.
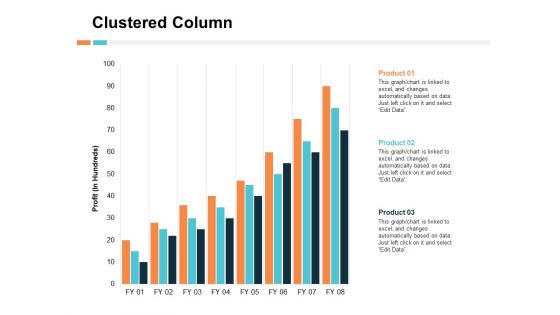
Clustered Column Product Ppt PowerPoint Presentation Outline Infographic Template
This is a clustered column product ppt powerpoint presentation outline infographic template. This is a three stage process. The stages in this process are product, percentage, business, management, marketing.

Stacked Area Clustered Column Ppt PowerPoint Presentation Infographic Template Summary
This is a stacked area clustered column ppt powerpoint presentation infographic template summary. This is a three stage process. The stages in this process are business, management, marketing, percentage, product.
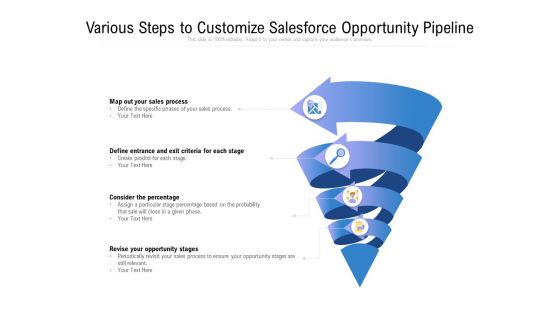
Market Analysis Funnel Infographic Ppt PowerPoint Presentation Portfolio Show PDF
Presenting this set of slides with name market analysis funnel infographic ppt powerpoint presentation portfolio show pdf. This is a four stage process. The stages in this process are map out your sales process, define entrance and exit criteria for each stage, consider the percentage, revise your opportunity stages. This is a completely editable PowerPoint presentation and is available for immediate download. Download now and impress your audience.

Companys Shareholder Structure With Details Ppt Infographic Template Tips PDF
This slide shows companys Shareholder structure with shareholder names and their respective percentages. Deliver an awe inspiring pitch with this creative companys shareholder structure with details ppt infographic template tips pdf bundle. Topics like shareholder, finance companies, investment bankers can be discussed with this completely editable template. It is available for immediate download depending on the needs and requirements of the user.
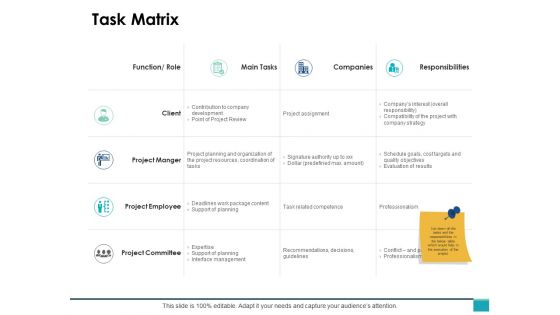
Task Matrix Marketing Ppt PowerPoint Presentation Infographic Template Design Inspiration
This is a task matrix marketing ppt powerpoint presentation infographic template design inspiration. The topics discussed in this diagram are business, management, planning, strategy, marketing. This is a completely editable PowerPoint presentation, and is available for immediate download.
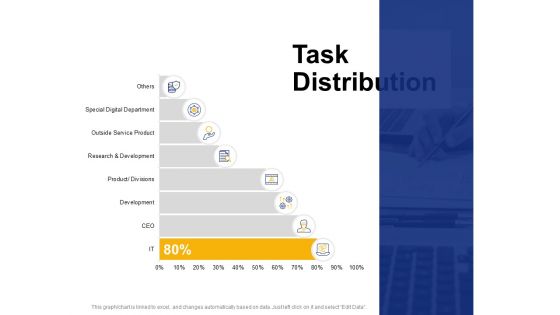
Task Distribution Ppt PowerPoint Presentation Infographic Template Good
Presenting this set of slides with name task distribution ppt powerpoint presentation infographic template good. The topics discussed in these slides are development, research and development, ceo, digital department. This is a completely editable PowerPoint presentation and is available for immediate download. Download now and impress your audience.
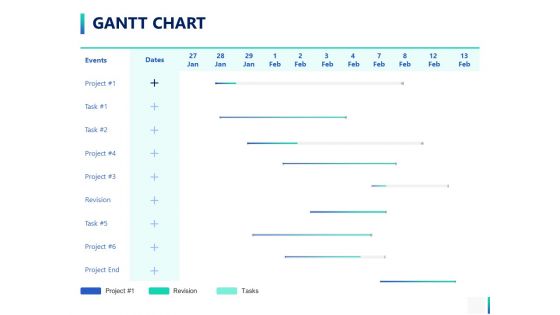
Gantt Chart Management Ppt PowerPoint Presentation Infographic Template Designs
Presenting this set of slides with name gantt chart management ppt powerpoint presentation infographic template designs. The topics discussed in these slide is project, revision, tasks. This is a completely editable PowerPoint presentation and is available for immediate download. Download now and impress your audience.

Agile Methodologies Team Performance Measurement After Agile Implementation Infographics Ppt Infographic Template Ideas PDF
This slide shows team iteration metrics for the measurement of team performance based on parameters such as actual and planned velocity, planned and accepted stories, number of defects and test cases, percentage of automated tests etc. Deliver an awe inspiring pitch with this creative agile methodologies team performance measurement after agile implementation infographics ppt infographic template ideas pdf bundle. Topics like Team Performance Measurement After Agile Implementation can be discussed with this completely editable template. It is available for immediate download depending on the needs and requirements of the user.
Energy Tracking Device Establish Baselines Cost Ppt PowerPoint Presentation Infographic Template Background Image PDF
Deliver an awe-inspiring pitch with this creative energy tracking device establish baselines cost ppt powerpoint presentation infographic template background image pdf bundle. Topics like fuel, resource, productivity, total annual, consumption, production, total annual, cost, value, percentage total plant energy cost, production units can be discussed with this completely editable template. It is available for immediate download depending on the needs and requirements of the user.

Seed Funding Pre And Post Capitalization Table Ppt Infographic Template Design Inspiration PDF
This slide shows companys pre and post capitalization comparison table with total valuation of shares and their ownership percentage Deliver an awe-inspiring pitch with this creative seed funding pre and post capitalization table ppt infographic template design inspiration pdf. bundle. Topics like seed funding pre and post capitalization table can be discussed with this completely editable template. It is available for immediate download depending on the needs and requirements of the user.
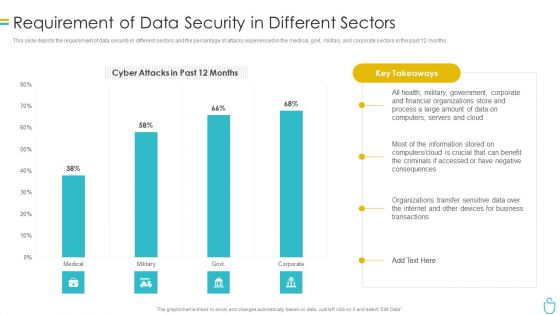
Information Security Requirement Of Data Security In Different Sectors Ppt File Infographic Template PDF
This slide depicts the requirement of data security in different sectors and the percentage of attacks experienced in the medical, govt, military, and corporate sectors in the past 12 months. Deliver an awe inspiring pitch with this creative information security requirement of data security in different sectors ppt file infographic template pdf bundle. Topics like process, financial, organizations, data, servers can be discussed with this completely editable template. It is available for immediate download depending on the needs and requirements of the user.
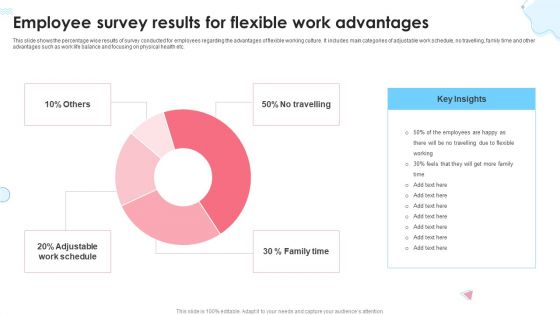
Employee Survey Results For Flexible Work Advantages Ppt Infographic Template Guidelines PDF
This slide shows the percentage wise results of survey conducted for employees regarding the advantages of flexible working culture. It includes main categories of adjustable work schedule, no travelling, family time and other advantages such as work life balance and focusing on physical health etc. Pitch your topic with ease and precision using this Employee Survey Results For Flexible Work Advantages Ppt Infographic Template Guidelines PDF. This layout presents information on Key Insights, Family Time, Adjustable Work Schedule, No Travelling. It is also available for immediate download and adjustment. So, changes can be made in the color, design, graphics or any other component to create a unique layout.
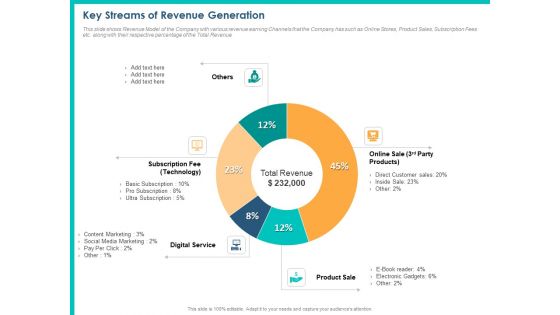
PPM Private Equity Key Streams Of Revenue Generation Ppt PowerPoint Presentation Infographic Template Show PDF
This slide shows Revenue Model of the Company with various revenue earning Channels that the Company has such as Online Stores, Product Sales, Subscription Fees etc. along with their respective percentage of the Total Revenue. Deliver an awe-inspiring pitch with this creative ppm private equity key streams of revenue generation ppt powerpoint presentation infographic template show pdf bundle. Topics like subscription fee technology, digital service, product sale, online sale, total revenue can be discussed with this completely editable template. It is available for immediate download depending on the needs and requirements of the user.
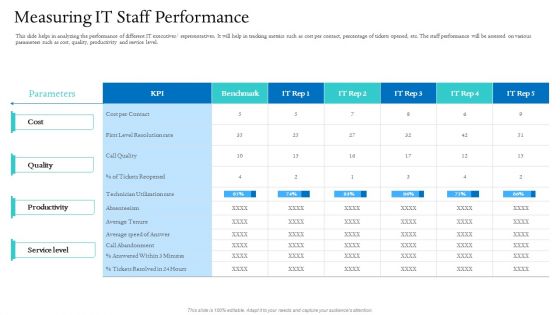
Information Technology Facilities Governance Measuring IT Staff Performance Ppt Infographic Template Graphics Download PDF
This slide helps in analyzing the performance of different IT executives representatives. It will help in tracking metrics such as cost per contact, percentage of tickets opened, etc. The staff performance will be assessed on various parameters such as cost, quality, productivity and service level. Deliver and pitch your topic in the best possible manner with this information technology facilities governance measuring IT staff performance ppt infographic template graphics download pdf. Use them to share invaluable insights on cost per contact, productivity, service level, technician, parameters and impress your audience. This template can be altered and modified as per your expectations. So, grab it now.

Your Mortgage Loan Plan For Hard Money Loan Services Proposal Ppt Infographic Template Design Ideas PDF
This slide showcases your mortgage loan plan for hard money loan services proposal. It provides details about loan amount, interest rate, rate type, annual percentage rate, term, 2nd mortgage, loan tenure, monthly payment, etc. Take your presentations to the next level with our Your Mortgage Loan Plan For Hard Money Loan Services Proposal Ppt Infographic Template Design Ideas PDF template. With its sleek design and seamless editing features, this single-slide PPT template is a game-changer for professionals who want to make an impact. Impress your audience with stunning visuals and engaging content that will capture their attention from start to finish. Get your hands on our template and elevate your presentations to new heights.
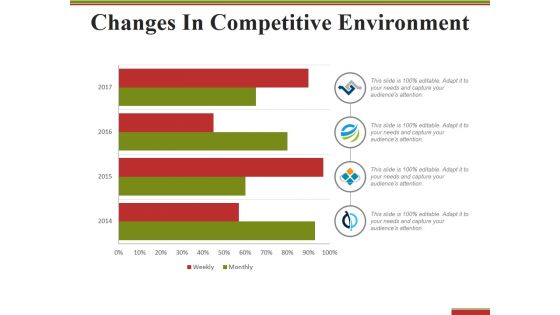
Changes In Competitive Environment Template 2 Ppt PowerPoint Presentation Infographic Template Themes
This is a changes in competitive environment template 2 ppt powerpoint presentation infographic template themes. This is a four stage process. The stages in this process are weekly, monthly, year, finance, percentage.
Stacked Column Ppt PowerPoint Presentation Icon Deck Ppt PowerPoint Presentation Pictures Infographic Template
This is a stacked column ppt powerpoint presentation icon deck ppt powerpoint presentation pictures infographic template. This is a two stage process. The stages in this process are stacked column, sales, percentage, product, growth.
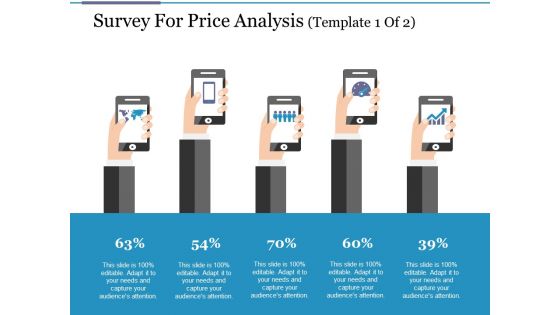
Survey For Price Analysis Template 2 Ppt PowerPoint Presentation Infographic Template Aids
This is a survey for price analysis template 2 ppt powerpoint presentation infographic template aids. This is a five stage process. The stages in this process are analysis, business, management, marketing, percentage.

Stacked Area Clustered Column Marketing Ppt PowerPoint Presentation Infographic Template Vector
This is a stacked area clustered column marketing ppt powerpoint presentation infographic template vector. This is a three stage process. The stages in this process are business, management, marketing, product, percentage.

Employee Weekly Efficiency Dashboard Ppt PowerPoint Presentation Infographic Template Graphic Images
This is a employee weekly efficiency dashboard ppt powerpoint presentation infographic template graphic images. This is a six stage process. The stages in this process are percentage, product, business, management, marketing.

Business Chart Showing Economic Growth Trend Ppt PowerPoint Presentation Infographic Template Format
Presenting this set of slides with name business chart showing economic growth trend ppt powerpoint presentation infographic template format. The topics discussed in these slides are gdp growth rate, percentage. This is a completely editable PowerPoint presentation and is available for immediate download. Download now and impress your audience.
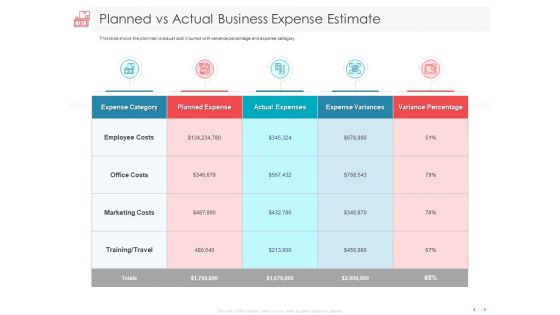
Managing CFO Services Planned Vs Actual Business Expense Estimate Ppt Infographic Template Slide Download PDF
Presenting this set of slides with name managing cfo services planned vs actual business expense estimate ppt infographic template slide download pdf. The topics discussed in these slides are expense category, planned expense, actual expenses, expense variances, variance percentage. This is a completely editable PowerPoint presentation and is available for immediate download. Download now and impress your audience.

Workforce Turnover Graph For Three Companies Ppt PowerPoint Presentation Infographic Template Visuals PDF
Presenting this set of slides with name workforce turnover graph for three companies ppt powerpoint presentation infographic template visuals pdf. The topics discussed in these slides are key insights, 2016 to 2020, employee turnover percentage. This is a completely editable PowerPoint presentation and is available for immediate download. Download now and impress your audience.

Client Segmentation Analysis Customer Segmentation Layout Ppt Infographic Template Microsoft PDF
Presenting this set of slides with name client segmentation analysis customer segmentation layout ppt infographic template microsoft pdf. This is a two stage process. The stages in this process are target, market, percentage, aware, neutral. This is a completely editable PowerPoint presentation and is available for immediate download. Download now and impress your audience.
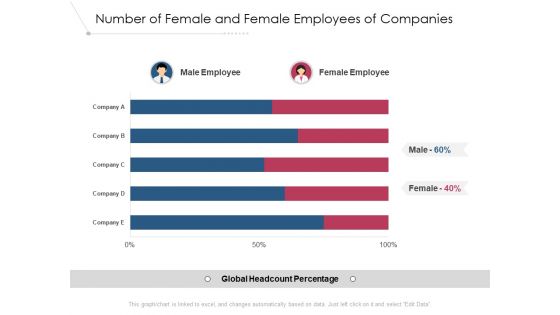
Number Of Female And Female Employees Of Companies Ppt PowerPoint Presentation Layouts Infographic Template PDF
Presenting this set of slides with name number of female and female employees of companies ppt powerpoint presentation layouts infographic template pdf. The topics discussed in these slides are male employee, female employee, global headcount percentage. This is a completely editable PowerPoint presentation and is available for immediate download. Download now and impress your audience

Attain Production Goals And Objectives Graph And Table Ppt Infographic Template Visuals PDF
This slide displays graphical representation of targeted and achieved production variance. It also includes critical insights such as target units, achieved production, achieved percentage, overachieved percentage, etc. Pitch your topic with ease and precision using this Attain Production Goals And Objectives Graph And Table Ppt Infographic Template Visuals PDF. This layout presents information on Target Vs Achieved, Key insight Table, Quarterly. It is also available for immediate download and adjustment. So, changes can be made in the color, design, graphics or any other component to create a unique layout.
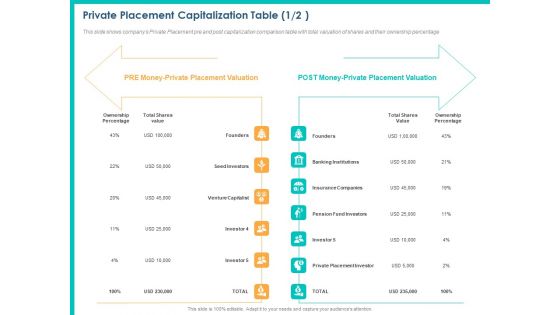
PPM Private Equity Private Placement Capitalization Table Ppt PowerPoint Presentation Infographic Template Model PDF
This slide shows companys Private Placement pre and post capitalization comparison table with total valuation of shares and their ownership percentage. This is a ppm private equity private placement capitalization table ppt powerpoint presentation infographic template model pdf template with various stages. Focus and dispense information on two stages using this creative set, that comes with editable features. It contains large content boxes to add your information on topics like ownership percentage, total shares value, founders, seed investors, venture capitalist. You can also showcase facts, figures, and other relevant content using this PPT layout. Grab it now.
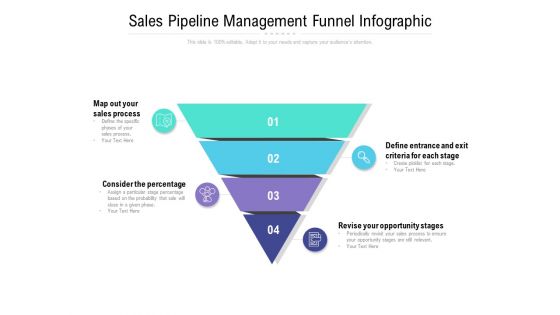
Sales Pipeline Management Funnel Infographic Ppt PowerPoint Presentation Show Designs Download PDF
Presenting this set of slides with name sales pipeline management funnel infographic ppt powerpoint presentation show designs download pdf. This is a four stage process. The stages in this process are map out your sales process, define entrance and exit criteria for each stage, consider the percentage, revise your opportunity stages. This is a completely editable PowerPoint presentation and is available for immediate download. Download now and impress your audience.

Integrating Logistics Automation Solution Current Order Accuracy Status In The Company Ppt Infographic Template Model PDF
This slide covers the current order accuracy status in the company in terms of accurate and inaccurate percentages. Presenting this PowerPoint presentation, titled Integrating Logistics Automation Solution Current Order Accuracy Status In The Company Ppt Infographic Template Model PDF, with topics curated by our researchers after extensive research. This editable presentation is available for immediate download and provides attractive features when used. Download now and captivate your audience. Presenting this Integrating Logistics Automation Solution Current Order Accuracy Status In The Company Ppt Infographic Template Model PDF. Our researchers have carefully researched and created these slides with all aspects taken into consideration. This is a completely customizable Integrating Logistics Automation Solution Current Order Accuracy Status In The Company Ppt Infographic Template Model PDF that is available for immediate downloading. Download now and make an impact on your audience. Highlight the attractive features available with our PPTs.

Implementing Agile Marketing In Your Organization Establish The Daily Tasks Ppt Infographic Template Outfit PDF
Presenting this set of slides with name implementing agile marketing in your organization establish the daily tasks ppt infographic template outfit pdf. This is a four stage process. The stages in this process are cart abandonment, infographic on millennials, social media post, testing and publishing. This is a completely editable PowerPoint presentation and is available for immediate download. Download now and impress your audience.
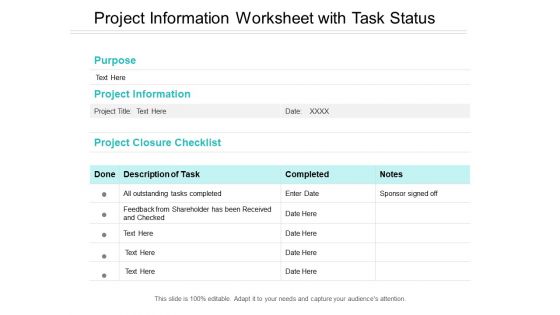
Project Information Worksheet With Task Status Ppt PowerPoint Presentation Infographic Template Master Slide
This is a project information worksheet with task status ppt powerpoint presentation infographic template master slide. This is a three stage process. The stages in this process are project closure, project completion, project accomplishment.
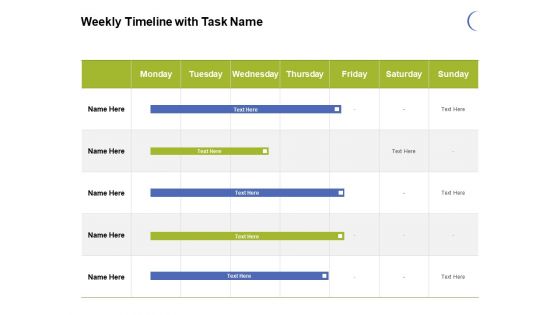
Weekly Timeline With Task Name Ppt PowerPoint Presentation Visual Aids Infographic Template
Presenting this set of slides with name weekly timeline with task name ppt powerpoint presentation visual aids infographic template. The topics discussed in these slide is weekly timeline task. This is a completely editable PowerPoint presentation and is available for immediate download. Download now and impress your audience.

Star Performer Monthly Timeline With Task Name Ppt Infographic Template Mockup PDF
Presenting this set of slides with name star performer monthly timeline with task name ppt infographic template mockup pdf. The topics discussed in these slides are monthly timeline with task name. This is a completely editable PowerPoint presentation and is available for immediate download. Download now and impress your audience.

Project Financial Plan With Task Details Ppt PowerPoint Presentation Infographic Template Graphics Tutorials PDF
Presenting this set of slides with name project financial plan with task details ppt powerpoint presentation infographic template graphics tutorials pdf. The topics discussed in these slide is project financial plan with task details. This is a completely editable PowerPoint presentation and is available for immediate download. Download now and impress your audience.

Optimization Restaurant Operations Weekly Timeline With Task Name Ppt Infographic Template Guide PDF
Deliver an awe-inspiring pitch with this creative optimization restaurant operations weekly timeline with task name ppt infographic template guide pdf bundle. Topics like weekly timeline with task name can be discussed with this completely editable template. It is available for immediate download depending on the needs and requirements of the user.

 Home
Home