Percentage Infographic
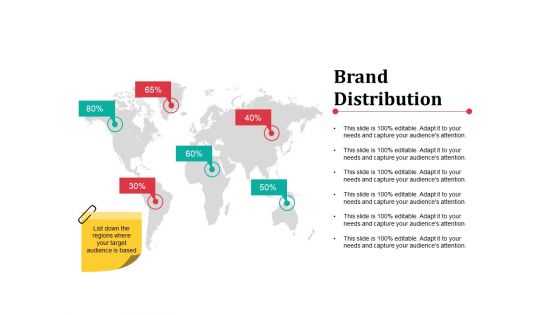
Brand Distribution Ppt PowerPoint Presentation Infographics Clipart
This is a brand distribution ppt powerpoint presentation infographics clipart. This is a six stage process. The stages in this process are distribution, percentage, business, management, location.
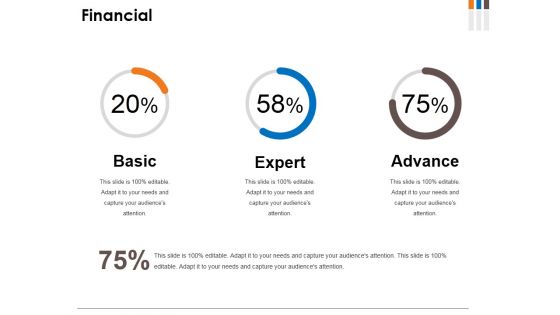
Financial Ppt PowerPoint Presentation Infographics Portfolio
This is a financial ppt powerpoint presentation infographics portfolio. This is a three stage process. The stages in this process are basic, expert, advance, percentage, finance.

Stacked Bar Ppt PowerPoint Presentation Infographics Styles
This is a stacked bar ppt powerpoint presentation infographics styles. This is a two stage process. The stages in this process are product, staked bar, percentage, finance, step.

Financial Ppt PowerPoint Presentation Infographics Elements
This is a financial ppt powerpoint presentation infographics elements. This is a two stage process. The stages in this process are minimum, maximum, percentage, financial, business.

Scatter Chart Ppt PowerPoint Presentation Infographics Good
This is a scatter chart ppt powerpoint presentation infographics good. This is a two stage process. The stages in this process are in percentage, profit, chart, business, marketing.
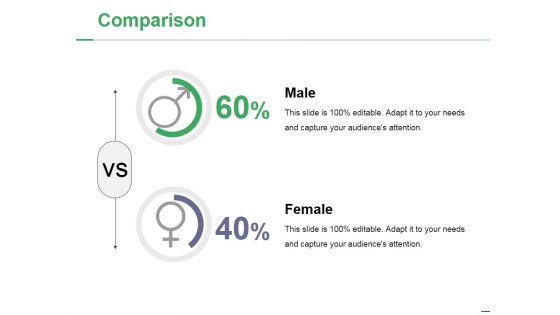
Comparison Ppt PowerPoint Presentation Infographics Elements
This is a comparison ppt powerpoint presentation infographics elements. This is a two stage process. The stages in this process are male, female, business, percentage, finance.
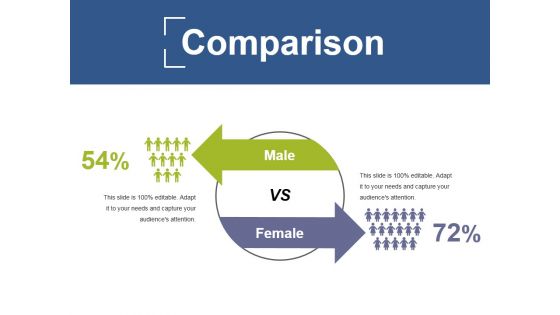
Comparison Ppt PowerPoint Presentation Infographics Rules
This is a comparison ppt powerpoint presentation infographics rules. This is a two stage process. The stages in this process are male, female, comparison, percentage, finance.
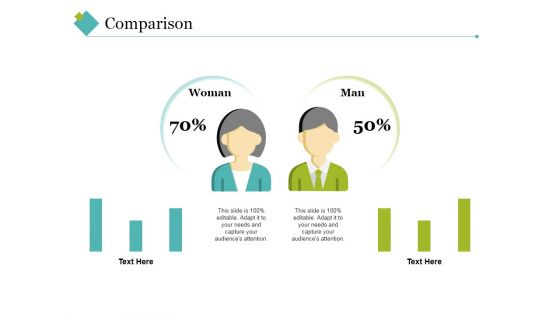
Comparison Ppt PowerPoint Presentation Infographics Format
This is a comparison ppt powerpoint presentation infographics format. This is a two stage process. The stages in this process are woman, man, comparison, percentage, finance.
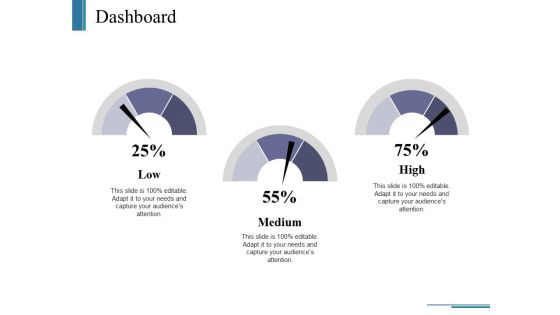
Dashboard Ppt PowerPoint Presentation Infographics Slides
This is a dashboard ppt powerpoint presentation infographics slides. This is a three stage process. The stages in this process are business, marketing, dashboard, process, percentage.
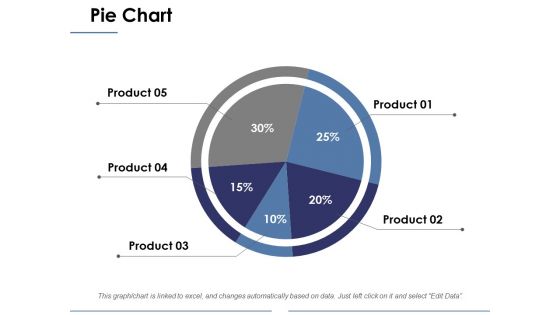
Pie Chart Ppt PowerPoint Presentation Infographics Shapes
This is a pie chart ppt powerpoint presentation infographics shapes. This is a five stage process. The stages in this process are business, pie chart, marketing, percentage, strategy.

Bar Graph Ppt PowerPoint Presentation Infographics Templates
This is a bar graph ppt powerpoint presentation infographics templates. This is a two stage process. The stages in this process are product, financial years, sales in percentage.
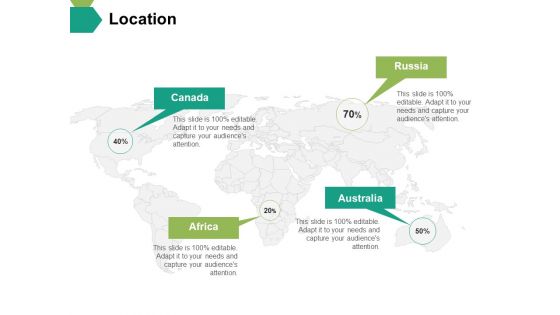
Location Ppt PowerPoint Presentation Infographics Summary
This is a location ppt powerpoint presentation infographics summary. This is a four stage process. The stages in this process are location, percentage, business, management, marketing.

Financial Ppt PowerPoint Presentation Infographics Ideas
This is a financial ppt powerpoint presentation infographics ideas. This is a three stage process. The stages in this process are financial, percentage, product, business.
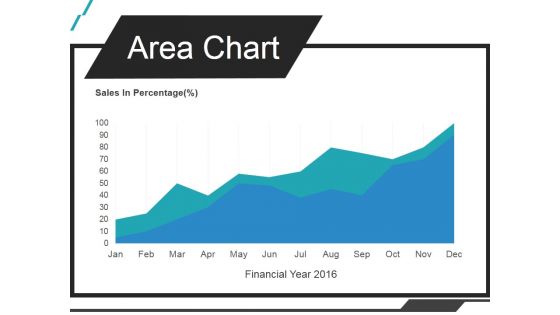
Area Chart Ppt PowerPoint Presentation Infographics
This is a area chart ppt powerpoint presentation infographics. This is a one stage process. The stages in this process are sales in percentage, jan, feb, mar, apr.
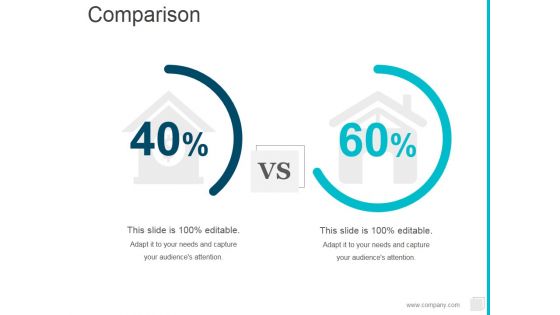
Comparison Ppt PowerPoint Presentation Outline Infographics
This is a comparison ppt powerpoint presentation outline infographics. This is a two stage process. The stages in this process are business, marketing, compare, percentage.
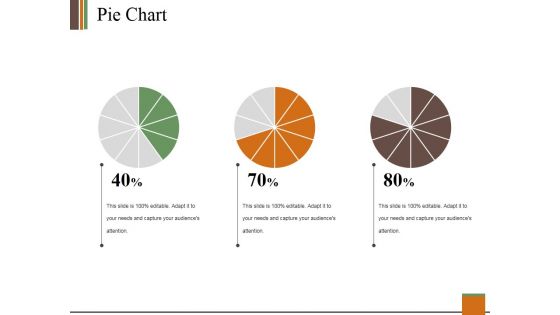
Pie Chart Ppt PowerPoint Presentation Summary Infographics
This is a pie chart ppt powerpoint presentation summary infographics. This is a three stage process. The stages in this process are pie, process, percentage, finance, business.
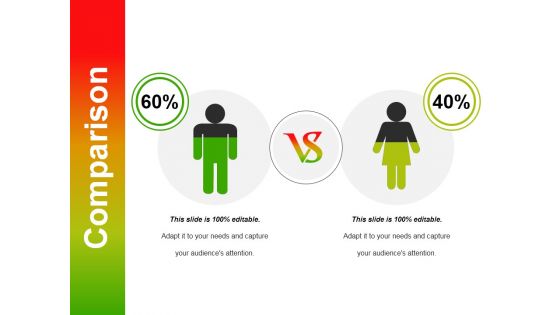
Comparison Ppt PowerPoint Presentation Visual Aids Infographics
This is a comparison ppt powerpoint presentation visual aids infographics. This is a two stage process. The stages in this process are compare, percentage, finance, business, marketing.

Comparison Ppt PowerPoint Presentation Model Infographics
This is a comparison ppt powerpoint presentation model infographics. This is a two stage process. The stages in this process are male, female, compare, percentage, human resource.

Comparison Ppt PowerPoint Presentation Pictures Infographics
This is a comparison ppt powerpoint presentation pictures infographics. This is a two stage process. The stages in this process are comparison, male, female, business, percentage.
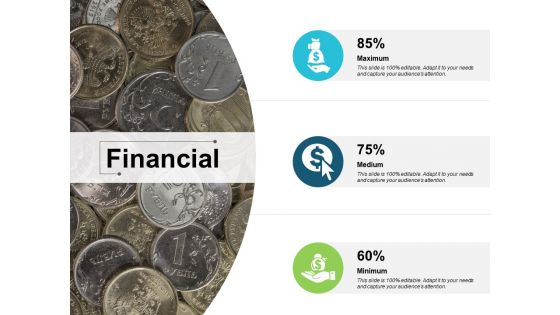
Financial Ppt PowerPoint Presentation Ideas Infographics
This is a financial ppt powerpoint presentation ideas infographics. This is a three stage process. The stages in this process are dollar, business, finance, marketing, percentage.

Combo Chart Ppt PowerPoint Presentation Infographics Introduction
This is a combo chart ppt powerpoint presentation infographics introduction. This is a three stage process. The stages in this process are profit in percentage, business, graph, strategy, product.
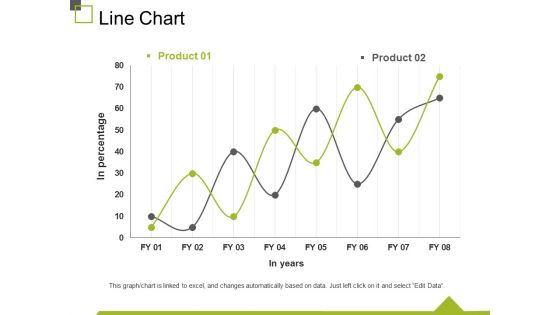
Line Chart Ppt PowerPoint Presentation Infographics Display
This is a line chart ppt powerpoint presentation infographics display. This is a two stage process. The stages in this process are in percentage, in years, chart, business, marketing.
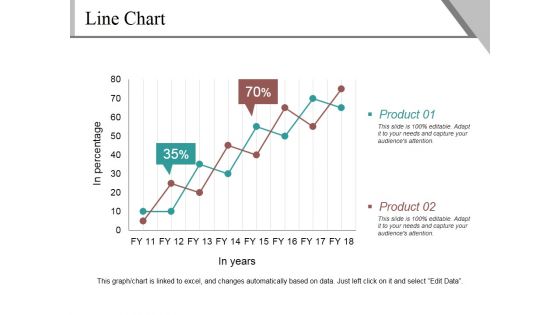
Line Chart Ppt PowerPoint Presentation Infographics Example
This is a line chart ppt powerpoint presentation infographics example. This is a two stage process. The stages in this process are product, in percentage, in years, finance, growth.

Stacked Bar Ppt PowerPoint Presentation Infographics Graphics
This is a stacked bar ppt powerpoint presentation infographics graphics. This is a four stage process. The stages in this process are business, strategy, marketing, success, unit count, in percentage.
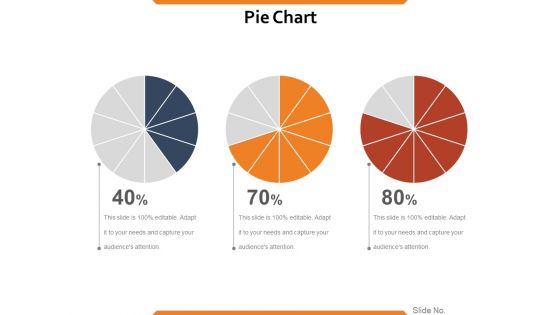
Pie Chart Ppt PowerPoint Presentation Infographics Show
This is a pie chart ppt powerpoint presentation infographics show. This is a three stage process. The stages in this process are process, percentage, business, marketing, success, pie chart.

Stacked Column Ppt PowerPoint Presentation Infographics Samples
This is a stacked column ppt powerpoint presentation infographics samples. This is a two stage process. The stages in this process are product, sales in percentage, business, marketing, graph.

Stacked Line Ppt PowerPoint Presentation Infographics Vector
This is a stacked line ppt powerpoint presentation infographics vector. This is a three stage process. The stages in this process are product, stacked line, business, marketing, in percentage.
Bar Graph Ppt PowerPoint Presentation Infographics Icon
This is a bar graph ppt powerpoint presentation infographics icon. This is a two stage process. The stages in this process are business, marketing, financial year, in percentage, graph.

Area Stacked Ppt PowerPoint Presentation Infographics Shapes
This is a area stacked ppt powerpoint presentation infographics shapes. This is a two stage process. The stages in this process are product, area stacked, sales in percentage, financial year.
Area Chart Ppt PowerPoint Presentation Infographics Guide
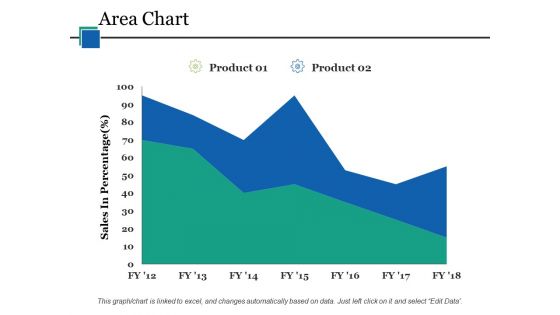
This is a area chart ppt powerpoint presentation infographics guide. This is a two stage process. The stages in this process are area chart, product, sales in percentage, finance, business.
Scatter Line Ppt PowerPoint Presentation File Infographics
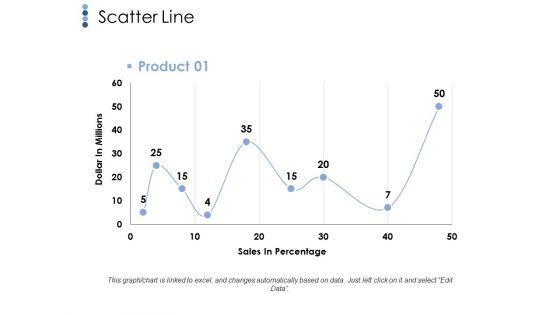
This is a scatter line ppt powerpoint presentation file infographics. This is a one stage process. The stages in this process are scatter line, dollar in millions, sales in percentage, business.
Income Assessment Document Interpretation Of Survey Ppt Inspiration Infographics PDF
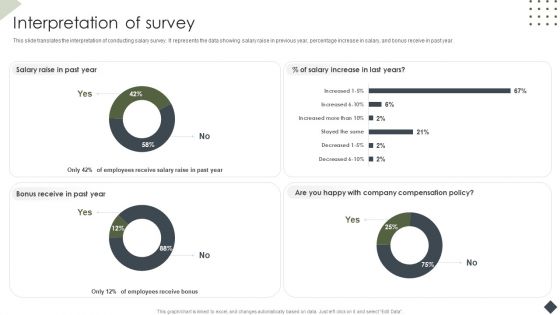
This slide translates the interpretation of conducting salary survey. It represents the data showing salary raise in previous year, percentage increase in salary, and bonus receive in past year. Deliver an awe inspiring pitch with this creative Income Assessment Document Interpretation Of Survey Ppt Inspiration Infographics PDF bundle. Topics like Employees Receive Bonus, Bonus Receive, Past Year can be discussed with this completely editable template. It is available for immediate download depending on the needs and requirements of the user.
Annual Innovative Technology Investment By Company Size Infographics PDF
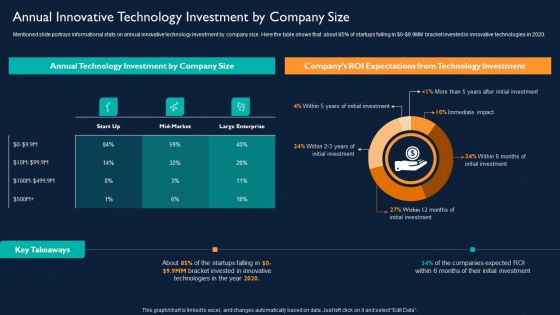
Mentioned slide portrays informational stats on annual innovative technology investment by company size. Here the table shows that about 85 percentage of startups falling in dollar 0 dollar 9.9MM bracket invested in innovative technologies in 2020. Deliver an awe inspiring pitch with this creative Annual Innovative Technology Investment By Company Size Infographics PDF bundle. Topics like Annual Technology Investment, Innovative can be discussed with this completely editable template. It is available for immediate download depending on the needs and requirements of the user.
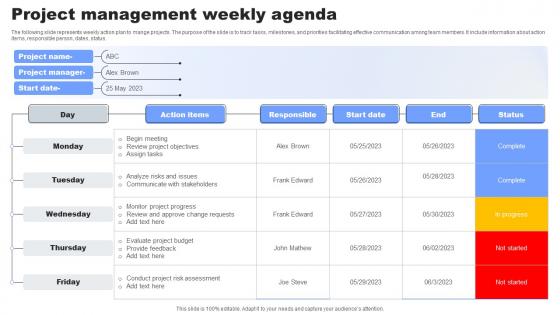
Project Management Weekly Agenda Infographics Pdf
The following slide represents weekly action plan to mange projects. The purpose of the slide is to track tasks, milestones, and priorities facilitating effective communication among team members. It include information about action items, responsible person, dates, status.Showcasing this set of slides titled Project Management Weekly Agenda Infographics Pdf The topics addressed in these templates are Monitor project progress, Evaluate project budget, Conduct project All the content presented in this PPT design is completely editable. Download it and make adjustments in color, background, font etc. as per your unique business setting.
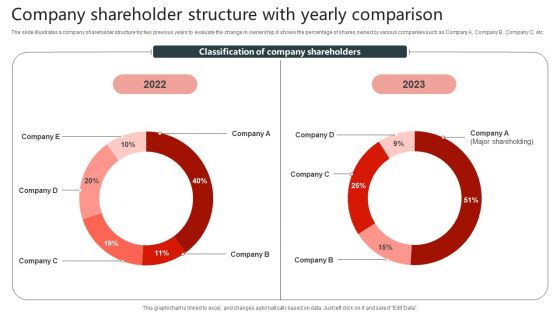
Company Shareholder Structure With Yearly Comparison Infographics PDF
The slide illustrates a company shareholder structure for two previous years to evaluate the change in ownership. It shows the percentage of shares owned by various companies such as Company A, Company B, Company C, etc. Pitch your topic with ease and precision using this Company Shareholder Structure With Yearly Comparison Infographics PDF. This layout presents information on Structure With Yearly Comparison, Company Shareholder. It is also available for immediate download and adjustment. So, changes can be made in the color, design, graphics or any other component to create a unique layout.

Weekly Timeline With Task Name Infographics PDF
Deliver an awe inspiring pitch with this creative weekly timeline with task name infographics pdf bundle. Topics like weekly timeline with task name can be discussed with this completely editable template. It is available for immediate download depending on the needs and requirements of the user.
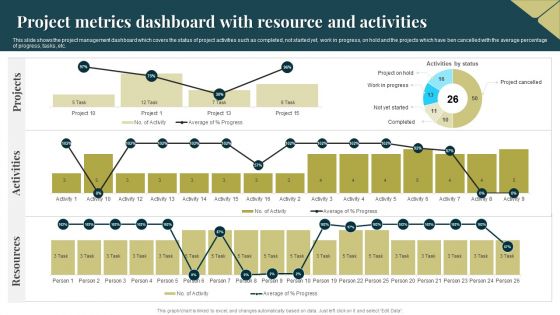
Project Metrics Dashboard With Resource And Activities Infographics PDF
This slide shows the project management dashboard which covers the status of project activities such as completed, not started yet, work in progress, on hold and the projects which have ben cancelled with the average percentage of progress, tasks, etc. Showcasing this set of slides titled Project Metrics Dashboard With Resource And Activities Infographics PDF. The topics addressed in these templates are Activities, Projects, Resources. All the content presented in this PPT design is completely editable. Download it and make adjustments in color, background, font etc. as per your unique business setting.
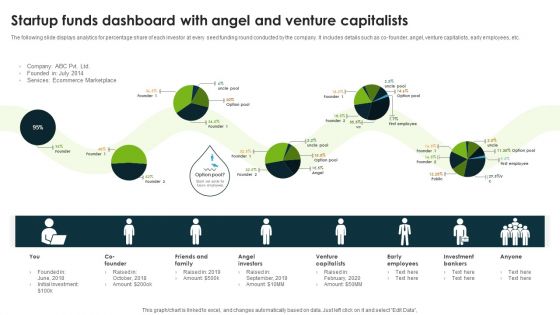
Startup Funds Dashboard With Angel And Venture Capitalists Infographics PDF
The following slide displays analytics for percentage share of each investor at every seed funding round conducted by the company. It includes details such as co founder, angel, venture capitalists, early employees, etc. Showcasing this set of slides titled Startup Funds Dashboard With Angel And Venture Capitalists Infographics PDF. The topics addressed in these templates are Angel Investors, Venture Capitalists, Early Employees. All the content presented in this PPT design is completely editable. Download it and make adjustments in color, background, font etc. as per your unique business setting.
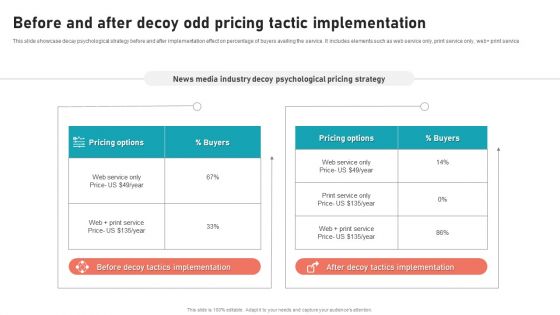
Before And After Decoy Odd Pricing Tactic Implementation Infographics PDF
This slide showcase decay psychological strategy before and after implementation effect on percentage of buyers availing the service. It includes elements such as web service only, print service only, web print service. Showcasing this set of slides titled Before And After Decoy Odd Pricing Tactic Implementation Infographics PDF. The topics addressed in these templates are Before And After, Decoy Odd Pricing, Tactic Implementation. All the content presented in this PPT design is completely editable. Download it and make adjustments in color, background, font etc. as per your unique business setting.

Data Automation Solution Investor Funding Presentation Shareholding Pattern Infographics PDF
Mentioned slide provides insights into company shareholding distribution by number of shareholders and percentage of holding by each member. Coming up with a presentation necessitates that the majority of the effort goes into the content and the message you intend to convey. The visuals of a PowerPoint presentation can only be effective if it supplements and supports the story that is being told. Keeping this in mind our experts created Data Automation Solution Investor Funding Presentation Shareholding Pattern Infographics PDF to reduce the time that goes into designing the presentation. This way, you can concentrate on the message while our designers take care of providing you with the right template for the situation.
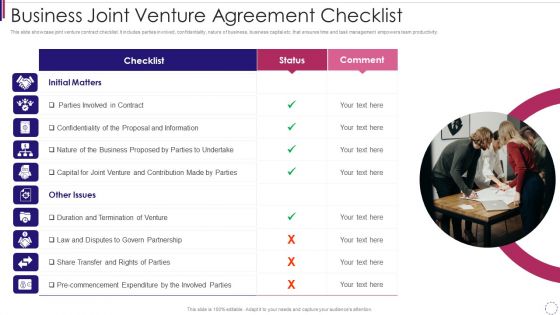
Business Joint Venture Agreement Checklist Infographics PDF
This slide showcase joint venture contract checklist. It includes parties involved, confidentiality, nature of business, business capital etc. that ensures time and task management empowers team productivity. Presenting business joint venture agreement checklist infographics pdf to dispense important information. This template comprises one stages. It also presents valuable insights into the topics including business joint venture agreement checklist. This is a completely customizable PowerPoint theme that can be put to use immediately. So, download it and address the topic impactfully.
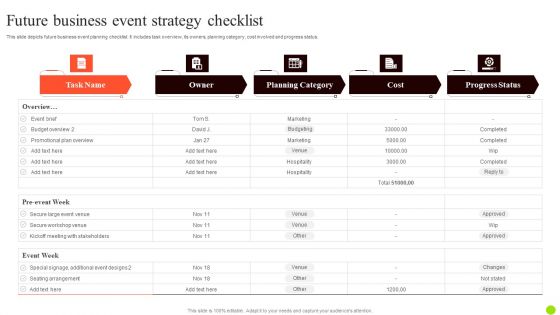
Future Business Event Strategy Checklist Infographics PDF
This slide depicts future business event planning checklist. It includes task overview, its owners, planning category, cost involved and progress status. Showcasing this set of slides titled Future Business Event Strategy Checklist Infographics PDF. The topics addressed in these templates are Planning Category, Cost, Strategy Checklist. All the content presented in this PPT design is completely editable. Download it and make adjustments in color, background, font etc. as per your unique business setting.

Integrated System Software Designing Process Infographics PDF
This slide presents software services design process for embedded systems, helpful in segmenting each stage into separate task. It includes planning, analysis, designing, implementation, testing, integration and maintenance. Presenting Integrated System Software Designing Process Infographics PDF to dispense important information. This template comprises six stages. It also presents valuable insights into the topics including Planning, Analysis, Design, Implementation. This is a completely customizable PowerPoint theme that can be put to use immediately. So, download it and address the topic impactfully.
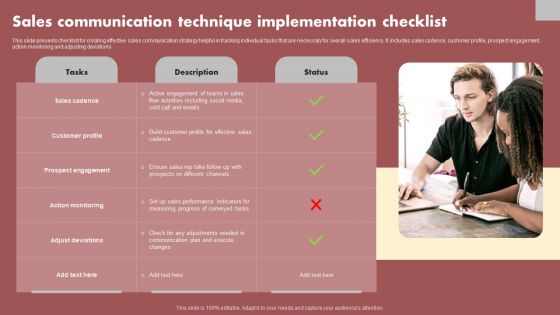
Sales Communication Technique Implementation Checklist Infographics PDF
This slide presents checklist for creating effective sales communication strategy helpful in tracking individual tasks that are necessary for overall sales efficiency. It includes sales cadence, customer profile, prospect engagement, action monitoring and adjusting deviations. Presenting Sales Communication Technique Implementation Checklist Infographics PDF to dispense important information. This template comprises one stages. It also presents valuable insights into the topics including Sales Cadence, Customer Profile, Prospect Engagement. This is a completely customizable PowerPoint theme that can be put to use immediately. So, download it and address the topic impactfully.

Issues With Current Inventory Management System Infographics PDF
This slide showcases issues faced by organization due to inefficient inventory management process. It shows increase in inventory shrinkage percentage and cost of carrying inventory. Do you have to make sure that everyone on your team knows about any specific topic I yes, then you should give Issues With Current Inventory Management System Infographics PDF a try. Our experts have put a lot of knowledge and effort into creating this impeccable Issues With Current Inventory Management System Infographics PDF. You can use this template for your upcoming presentations, as the slides are perfect to represent even the tiniest detail. You can download these templates from the Slidegeeks website and these are easy to edit. So grab these today.

Identifying Conflicts Amongst Various Organizational Departments Infographics PDF
The purpose of this slide is to outline department wise conflicts. Information covered in this slide is related to percentage of conflicts occurred in various departments such as digital marketing, human resource HR, customer service and finance. Find highly impressive Identifying Conflicts Amongst Various Organizational Departments Infographics PDF on Slidegeeks to deliver a meaningful presentation. You can save an ample amount of time using these presentation templates. No need to worry to prepare everything from scratch because Slidegeeks experts have already done a huge research and work for you. You need to download Identifying Conflicts Amongst Various Organizational Departments Infographics PDF for your upcoming presentation. All the presentation templates are 100 percent editable and you can change the color and personalize the content accordingly. Download now.
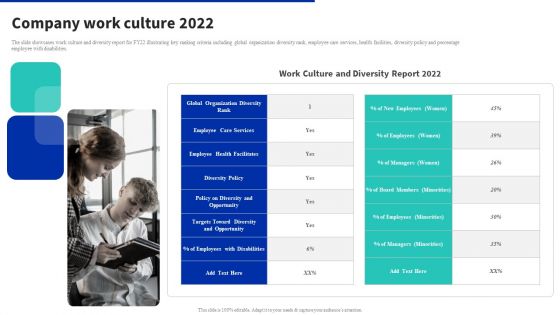
Digital Products Company Outline Company Work Culture 2022 Infographics PDF
The slide showcases work culture and diversity report for FY22 illustrating key ranking criteria including global organization diversity rank, employee care services, health facilities, diversity policy and percentage employee with disabilities. Crafting an eye catching presentation has never been more straightforward. Let your presentation shine with this tasteful yet straightforward Digital Products Company Outline Company Work Culture 2022 Infographics PDF template. It offers a minimalistic and classy look that is great for making a statement. The colors have been employed intelligently to add a bit of playfulness while still remaining professional. Construct the ideal Digital Products Company Outline Company Work Culture 2022 Infographics PDF that effortlessly grabs the attention of your audience Begin now and be certain to wow your customers.

Measuring The Experience Of Customer Strategic Brand Management Infographics Pdf
Mentioned slide shows customer effort score that can be used to measure the ease of service experienced by the customer with an organization. Based on survey results, 28 percentage said that it took a lot of effort in searching the desired product. Crafting an eye catching presentation has never been more straightforward. Let your presentation shine with this tasteful yet straightforward Measuring The Experience Of Customer Strategic Brand Management Infographics Pdf template. It offers a minimalistic and classy look that is great for making a statement. The colors have been employed intelligently to add a bit of playfulness while still remaining professional. Construct the ideal Measuring The Experience Of Customer Strategic Brand Management Infographics Pdf that effortlessly grabs the attention of your audience. Begin now and be certain to wow your customers.
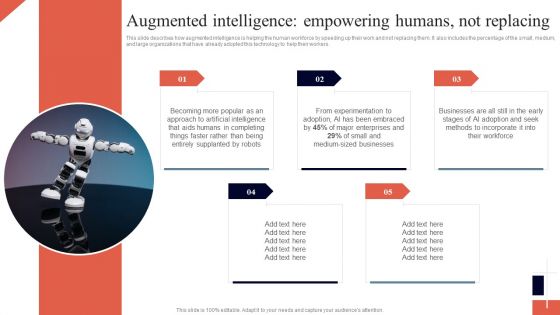
Cognitive Enhancement Augmented Intelligence Empowering Humans Infographics PDF
This slide describes how augmented intelligence is helping the human workforce by speeding up their work and not replacing them. It also includes the percentage of the small, medium, and large organizations that have already adopted this technology to help their workers. Boost your pitch with our creative Cognitive Enhancement Augmented Intelligence Empowering Humans Infographics PDF. Deliver an awe inspiring pitch that will mesmerize everyone. Using these presentation templates you will surely catch everyones attention. You can browse the ppts collection on our website. We have researchers who are experts at creating the right content for the templates. So you do not have to invest time in any additional work. Just grab the template now and use them.
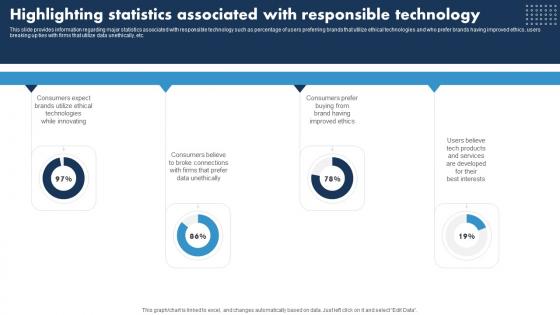
Highlighting Statistics Associated Esponsible Tech Guide To Manage Infographics Pdf
This slide provides information regarding major statistics associated with responsible technology such as percentage of users preferring brands that utilize ethical technologies and who prefer brands having improved ethics, users breaking up ties with firms that utilize data unethically, etc. Coming up with a presentation necessitates that the majority of the effort goes into the content and the message you intend to convey. The visuals of a PowerPoint presentation can only be effective if it supplements and supports the story that is being told. Keeping this in mind our experts created Highlighting Statistics Associated Esponsible Tech Guide To Manage Infographics Pdf to reduce the time that goes into designing the presentation. This way, you can concentrate on the message while our designers take care of providing you with the right template for the situation.

Current Construction Planning And Scheduling Efficiency Status Infographics PDF
This slide shows the current Construction Planning and Scheduling Efficiency Status in the company in terms of efficient and inefficient percentages Deliver an awe inspiring pitch with this creative current construction planning and scheduling efficiency status infographics pdf bundle. Topics like efficient, inefficient, documentation and inaccurate can be discussed with this completely editable template. It is available for immediate download depending on the needs and requirements of the user.
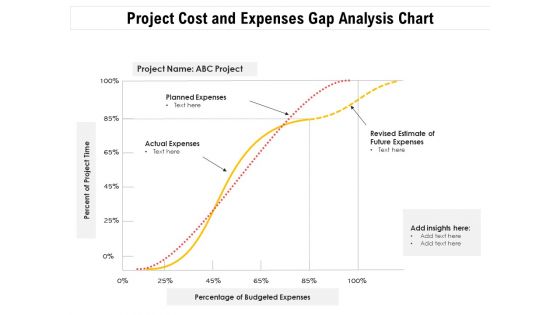
Project Cost And Expenses Gap Analysis Chart Ppt PowerPoint Presentation Infographics Graphics PDF
Presenting this set of slides with name project cost and expenses gap analysis chart ppt powerpoint presentation infographics graphics pdf. The topics discussed in these slides are planned expenses, actual expenses, revised estimate of future expenses, percent of project time, percentage of budgeted expenses. This is a completely editable PowerPoint presentation and is available for immediate download. Download now and impress your audience.
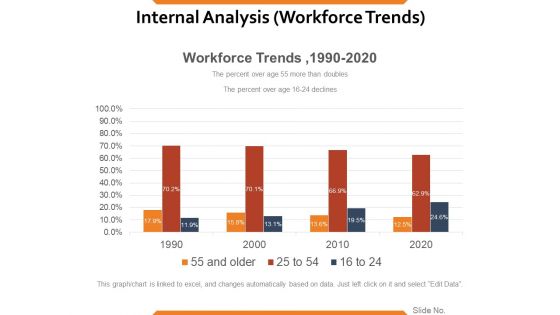
Internal Analysis Workforce Trends Ppt PowerPoint Presentation Infographics Smartart
This is a internal analysis workforce trends ppt powerpoint presentation infographics smartart. This is a four stage process. The stages in this process are finance, percentage, business, marketing.
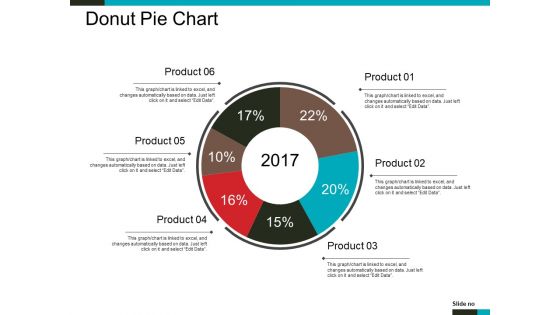
Donut Pie Chart Ppt PowerPoint Presentation Infographics Styles
This is a donut pie chart ppt powerpoint presentation infographics styles. This is a six stage process. The stages in this process are chart, percentage, years, business, management.
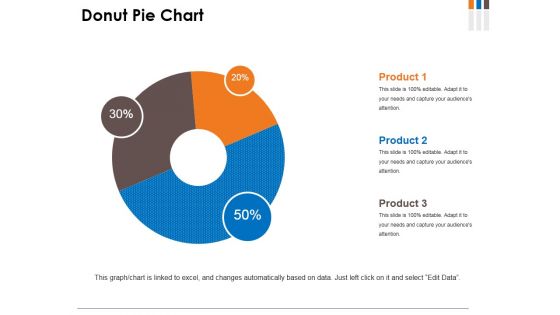
Donut Pie Chart Ppt PowerPoint Presentation Infographics Model
This is a donut pie chart ppt powerpoint presentation infographics model. This is a three stage process. The stages in this process are donut, business, marketing, percentage, finance.
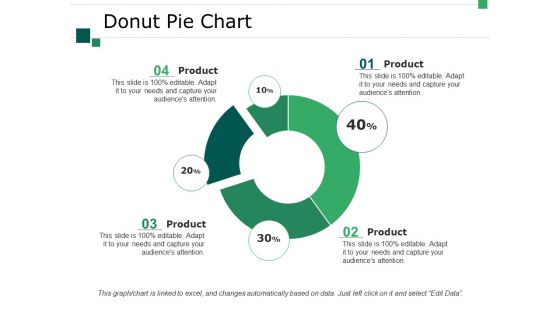
Donut Pie Chart Ppt PowerPoint Presentation Infographics Summary
This is a donut pie chart ppt powerpoint presentation infographics summary. This is a four stage process. The stages in this process are business, marketing, chart, percentage, process.
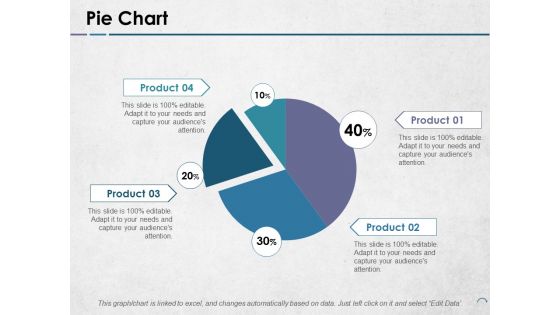
Pie Chart Ppt PowerPoint Presentation Infographics Example Topics
This is a pie chart ppt powerpoint presentation infographics example topics. This is a four stage process. The stages in this process are product, pie, process, percentage, finance.

Column Chart Ppt PowerPoint Presentation Infographics Graphics Template
This is a column chart ppt powerpoint presentation infographics graphics template. This is a two stage process. The stages in this process are percentage, product, business, management, marketing.
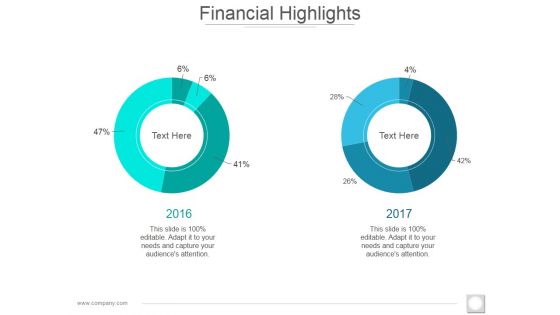
Financial Highlights Template 1 Ppt PowerPoint Presentation Summary Infographics
This is a financial highlights template 1 ppt powerpoint presentation summary infographics. This is a two stage process. The stages in this process are percentage, finance, donut, business.
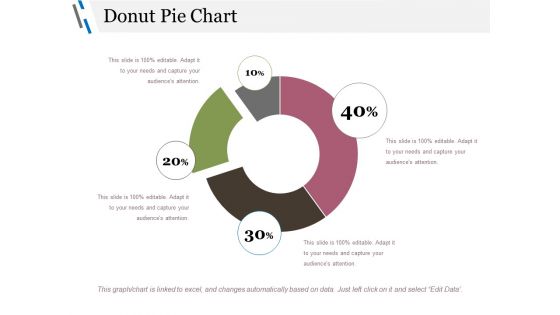
Donut Pie Chart Ppt PowerPoint Presentation Gallery Infographics
This is a donut pie chart ppt powerpoint presentation gallery infographics. This is a four stage process. The stages in this process are chart, business, management, percentage, process.

 Home
Home