Percentage Infographic

Customer Product Usage Percentage Infographic Ppt PowerPoint Presentation Clipart
This is a customer product usage percentage infographic ppt powerpoint presentation clipart. This is a five stage process. The stages in this process are business, marketing, finance, planning, strategy.

Tourism And Hospitality Industry Hospitality Management KPI Dashboard Percentage Infographics PDF
Deliver an awe inspiring pitch with this creative tourism and hospitality industry hospitality management kpi dashboard percentage infographics pdf bundle. Topics like revenue, agent, employee, fixedcost, variable cost can be discussed with this completely editable template. It is available for immediate download depending on the needs and requirements of the user.

Infographic For Percentage Growth Powerpoint Templates
Create dynamic presentations with our professional template of infographic. This diagram helps to present percentage profit growth. Download this template to leave permanent impression on your audience.

Pie Chart Infographic With Percentage Share Ppt Infographic Template Inspiration PDF
Presenting pie chart infographic with percentage share ppt infographic template inspiration pdf. to dispense important information. This template comprises three stages. It also presents valuable insights into the topics including pie chart infographic with percentage share. This is a completely customizable PowerPoint theme that can be put to use immediately. So, download it and address the topic impactfully.

Infographic Diagram With Percentage Values Powerpoint Template
Visually support your presentation with our above template containing infographic diagram with percentage values. This diagram is excellent visual tools for explaining huge amounts of information where complex data needs to be explained immediately and clearly.

Business Ownership Structure With Their Percentage Ppt Infographics Graphics Pictures PDF
This slide provides the Ownership structure of the company with their percent share. Deliver an awe inspiring pitch with this creative business ownership structure with their percentage ppt infographics graphics pictures pdf bundle. Topics like business ownership structure with their percentage can be discussed with this completely editable template. It is available for immediate download depending on the needs and requirements of the user.

Comparison Percentage Ppt PowerPoint Presentation Infographic Template Slides
This is a comparison percentage ppt powerpoint presentation infographic template slides. This is a two stage process. The stages in this process are business, management, comparison, strategy, analysis.

Comparison Business Percentage Ppt PowerPoint Presentation Infographic Template Elements
This is a comparison business percentage ppt powerpoint presentation infographic template elements. This is a three stage process. The stages in this process are compare, management, strategy, analysis, marketing.

Area Chart Product Percentage Ppt PowerPoint Presentation Infographic Template Slide
This is a area chart product percentage ppt powerpoint presentation infographic template slide. This is a four stage process. The stages in this process are area chart, finance, marketing, management, investment.

Ecommerce Percentage Ppt PowerPoint Presentation Infographic Template Model Cpb
Presenting this set of slides with name ecommerce percentage ppt powerpoint presentation infographic template model cpb. This is a seven stage process. The stages in this process are ecommerce percentage. This is a completely editable PowerPoint presentation and is available for immediate download. Download now and impress your audience.

Clustered Column Line Percentage Ppt PowerPoint Presentation Infographics Visual Aids
This is a clustered column line percentage ppt powerpoint presentation infographics visual aids. This is a three stage process. The stages in this process are.

Area Chart Percentage Product Ppt PowerPoint Presentation Infographic Template Slide
This is a area chart percentage product ppt powerpoint presentation infographic template slide. This is a two stage process. The stages in this process are area chart, finance, marketing, management, investment.
Personality Traits Percentage Scale Ppt PowerPoint Presentation Infographics Icon
This is a personality traits percentage scale ppt powerpoint presentation infographics icon. This is a six stage process. The stages in this process are circular, continuity, continuum.
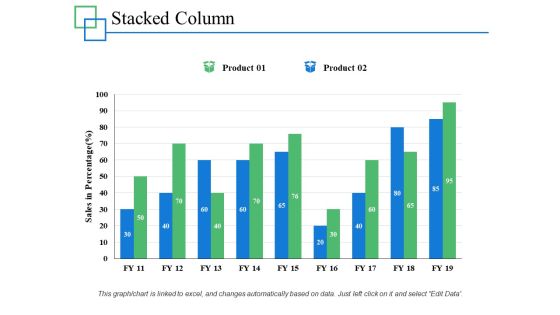
Stacked Column Percentage Product Ppt PowerPoint Presentation Infographics Outfit
This is a stacked column percentage product ppt powerpoint presentation infographics outfit. This is a two stage process. The stages in this process are marketing, business, management, percentage, product.

Customer Analysis Percentage Chart Ppt PowerPoint Presentation Infographics Master Slide
This is a customer analysis percentage chart ppt powerpoint presentation infographics master slide. This is a four stage process. The stages in this process are comparison chart, comparison table, comparison matrix.
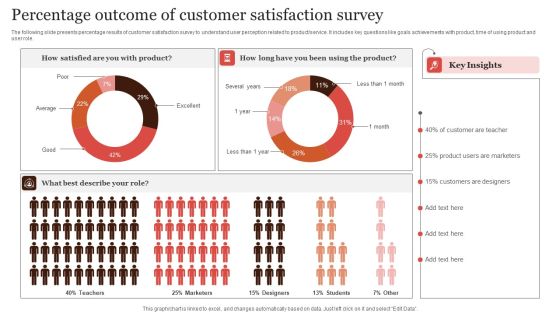
Percentage Outcome Of Customer Satisfaction Survey Infographics PDF
The following slide presents percentage results of customer satisfaction survey to understand user perception related to product or service. It includes key questions like goals achievements with product, time of using product and user role. Pitch your topic with ease and precision using this Percentage Outcome Of Customer Satisfaction Survey Infographics PDF. This layout presents information on Percentage Outcome, Customer Satisfaction Survey. It is also available for immediate download and adjustment. So, changes can be made in the color, design, graphics or any other component to create a unique layout.
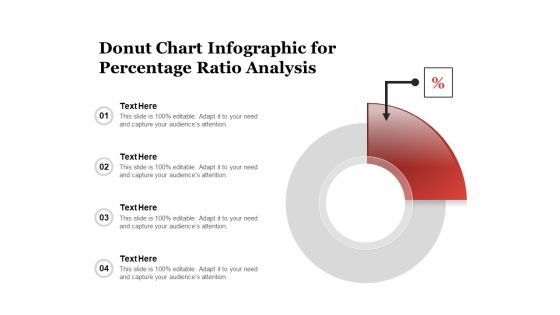
Donut Chart Infographic For Percentage Ratio Analysis Ppt PowerPoint Presentation File Graphics Example PDF
Persuade your audience using this donut chart infographic for percentage ratio analysis ppt powerpoint presentation file graphics example pdf. This PPT design covers four stages, thus making it a great tool to use. It also caters to a variety of topics including donut chart infographic for percentage ratio analysis. Download this PPT design now to present a convincing pitch that not only emphasizes the topic but also showcases your presentation skills.
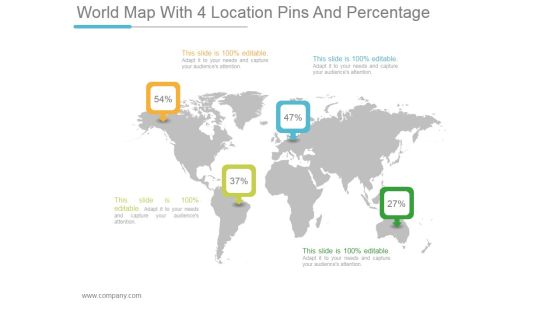
World Map With 4 Location Pins And Percentage Ppt PowerPoint Presentation Infographics
This is a world map with 4 location pins and percentage ppt powerpoint presentation infographics. This is a four stage process. The stages in this process are business, marketing, success, planning, map.

Summary Of Key Achievements With Percentage Values Ppt PowerPoint Presentation Infographics Graphics Design
Presenting this set of slides with name summary of key achievements with percentage values ppt powerpoint presentation infographics graphics design. This is a five stage process. The stages in this process are summary of key achievements with percentage values. This is a completely editable PowerPoint presentation and is available for immediate download. Download now and impress your audience.
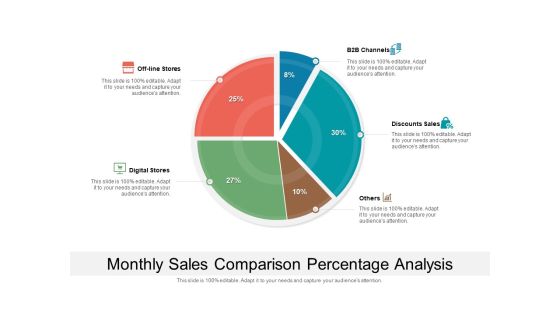
Monthly Sales Comparison Percentage Analysis Ppt PowerPoint Presentation File Infographic Template PDF
Pitch your topic with ease and precision using this monthly sales comparison percentage analysis ppt powerpoint presentation file infographic template pdf. This layout presents information on monthly sales comparison percentage analysis. It is also available for immediate download and adjustment. So, changes can be made in the color, design, graphics or any other component to create a unique layout.

Bar Chart For Facts Stats Growth And Percentage Analysis Ppt PowerPoint Presentation Styles Infographic Template
Presenting this set of slides with name bar chart for facts stats growth and percentage analysis ppt powerpoint presentation styles infographic template. This is a six stage process. The stages in this process are education, growth, pencil bar graph. This is a completely editable PowerPoint presentation and is available for immediate download. Download now and impress your audience.
Hands Showing Percentage Vector Icon Ppt PowerPoint Presentation Portfolio Infographic Template PDF
Presenting this set of slides with name hands showing percentage vector icon ppt powerpoint presentation portfolio infographic template pdf. This is a three stage process. The stages in this process are hands showing percentage vector icon. This is a completely editable PowerPoint presentation and is available for immediate download. Download now and impress your audience.

Business Percentage Shown On Monitor Vector Icon Ppt PowerPoint Presentation Infographic Template Slide PDF
Presenting this set of slides with name business percentage shown on monitor vector icon ppt powerpoint presentation infographic template slide pdf. This is a three stage process. The stages in this process are business percentage shown on monitor vector icon. This is a completely editable PowerPoint presentation and is available for immediate download. Download now and impress your audience.
Seven Percentage Bars With Business Icons Ppt PowerPoint Presentation Infographics Example Topics
Presenting this set of slides with name seven percentage bars with business icons ppt powerpoint presentation infographics example topics. This is a seven stage process. The stages in this process are seven percentage bars with business icons. This is a completely editable PowerPoint presentation and is available for immediate download. Download now and impress your audience.

Five Tags Displaying Percentage Growth Powerpoint Template
This diagram contains colored tags infographic set. Download this diagram slide to display business planning and growth. This diagram is editable you can edit text, color, shade and style as per you need.
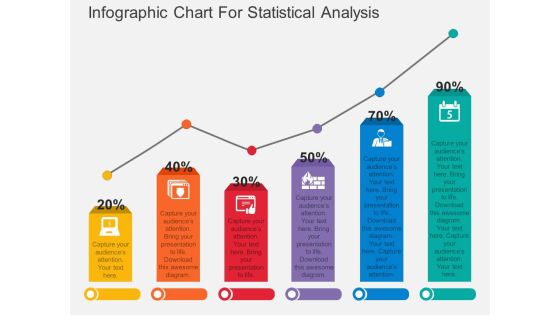
Infographic Chart For Statistical Analysis Powerpoint Template
Download this exclusive business diagram to display statistical analysis. This PowerPoint template contains bar chart with percentage values. This diagram is useful for business presentations.

Clustered Column Ppt PowerPoint Presentation Infographic Template
This is a clustered column ppt powerpoint presentation infographic template. This is a two stage process. The stages in this process are finance, percentage, bar graph, business, marketing.

Comparison Ppt PowerPoint Presentation Infographic Template Show
This is a comparison ppt powerpoint presentation infographic template show. This is a two stage process. The stages in this process are male, female, in percentage.
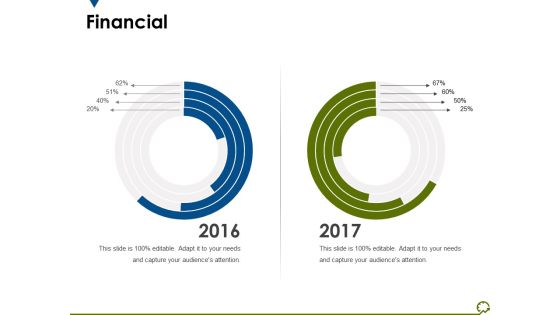
Financial Ppt PowerPoint Presentation Infographic Template Demonstration
This is a financial ppt powerpoint presentation infographic template demonstration. This is a two stage process. The stages in this process are finance, years, business, marketing, percentage.

Financial Ppt PowerPoint Presentation Infographic Template
This is a financial ppt powerpoint presentation infographic template. This is a three stage process. The stages in this process are beginner, advanced, professional, finance, percentage.

Comparison Ppt PowerPoint Presentation Infographic Template Files
This is a comparison ppt powerpoint presentation infographic template files. This is a two stage process. The stages in this process are male accounts, percentage, compare, business, management.

Financial Ppt PowerPoint Presentation Infographic Template Display
This is a financial ppt powerpoint presentation infographic template display. This is a three stage process. The stages in this process are business, percentage, finance, management, marketing.

Dashboard Ppt PowerPoint Presentation Infographic Template Show
This is a dashboard ppt powerpoint presentation infographic template show. This is one stage process. The stages in this process are business, dashboard, marketing, percentage, process.
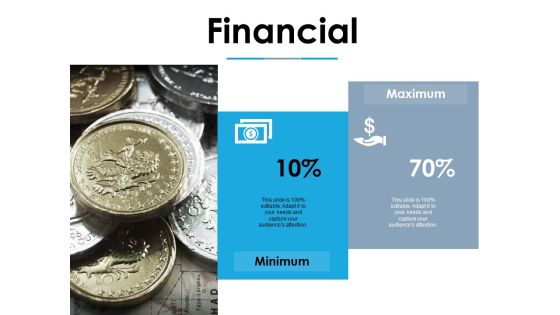
Financial Ppt PowerPoint Presentation Infographic Template Ideas
This is a financial ppt powerpoint presentation infographic template ideas. This is a two stage process. The stages in this process are business, minimum, maximum, financial, percentage, marketing.
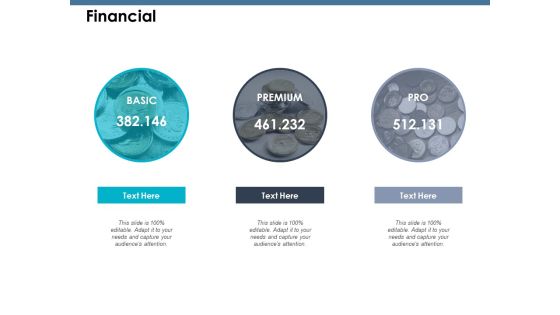
Financial Ppt PowerPoint Presentation Infographic Template Guide
This is a financial ppt powerpoint presentation infographic template guide. This is a three stage process. The stages in this process are product, percentage, marketing, business, financial.

Tasks Status Report Template Ppt PowerPoint Presentation Infographics Infographic Template
This is a tasks status report template ppt powerpoint presentation infographics infographic template. This is a five stage process. The stages in this process are task completion, assignment completion, work completion.

Area Chart Ppt PowerPoint Presentation Infographic Template Samples
This is a area chart ppt powerpoint presentation infographic template samples. This is a two stage process. The stages in this process are in percentage product, business, marketing, growth.

Analyzing Brands Key Financial Indicators Ppt Infographic Template Slides PDF
This slide showcases assessing key indicators for measuring financial performance of brand. It provides details about turnover, marketing costs, sales, administrative expenses, profit, percentage turnover, trade debtor days, headcount, etc. Are you in need of a template that can accommodate all of your creative concepts This one is crafted professionally and can be altered to fit any style. Use it with Google Slides or PowerPoint. Include striking photographs, symbols, depictions, and other visuals. Fill, move around, or remove text boxes as desired. Test out color palettes and font mixtures. Edit and save your work, or work with colleagues. Download Analyzing Brands Key Financial Indicators Ppt Infographic Template Slides PDF and observe how to make your presentation outstanding. Give an impeccable presentation to your group and make your presentation unforgettable.

Bar Chart Ppt PowerPoint Presentation Infographic Template Example
This is a bar chart ppt powerpoint presentation infographic template example. This is a seven stage process. The stages in this process are business, finance, marketing, percentage.
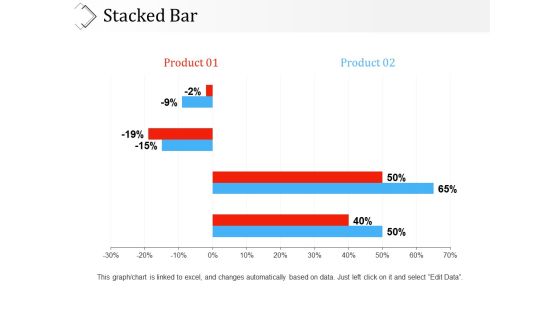
Stacked Bar Ppt PowerPoint Presentation Infographic Template Clipart
This is a stacked bar ppt powerpoint presentation infographic template clipart. This is a two stage process. The stages in this process are product, percentage, business, marketing, graph.

Pie Chart Ppt PowerPoint Presentation Outline Infographic Template
This is a pie chart ppt powerpoint presentation outline infographic template. This is a five stage process. The stages in this process are product, percentage, business, process.

Dashboard Ppt PowerPoint Presentation Infographic Template Background Image
This is a dashboard ppt powerpoint presentation infographic template background image. This is a three stage process. The stages in this process are dashboard, business, marketing, percentage, low.

Financial Ppt PowerPoint Presentation Infographic Template Graphics Pictures
This is a financial ppt powerpoint presentation infographic template graphics pictures. This is a three stage process. The stages in this process are percentage, coin, business, finance, marketing.
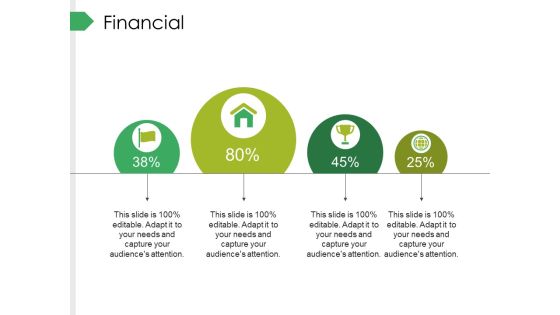
Financial Ppt PowerPoint Presentation Infographic Template Graphic Images
This is a financial ppt powerpoint presentation infographic template graphic images. This is a four stage process. The stages in this process are business, financial, marketing, percentage, strategy.

Pie Chart Ppt PowerPoint Presentation Infographic Template Topics
This is a pie chart ppt powerpoint presentation infographic template topics. This is a three stage process. The stages in this process are percentage, management, marketing, business.
Pie Chart Ppt PowerPoint Presentation Icon Infographic Template
This is a pie chart ppt powerpoint presentation icon infographic template. This is a three stage process. The stages in this process are percentage, product, management, business.

Area Chart Ppt PowerPoint Presentation Infographic Template Guidelines
This is a area chart ppt powerpoint presentation infographic template guidelines. This is a two stage process. The stages in this process are in percentage, chart, business, growth, strategy.
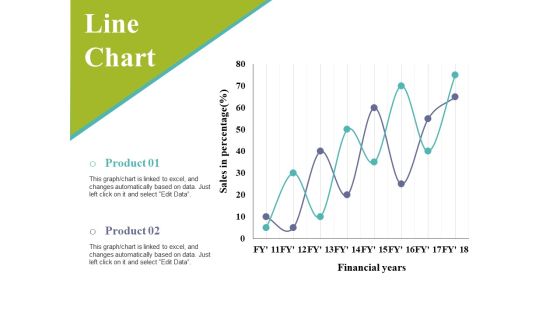
Line Chart Ppt PowerPoint Presentation Infographic Template Slides
This is a line chart ppt powerpoint presentation infographic template slides. This is a two stage process. The stages in this process are sales in percentage, financial years, business, marketing, graph.
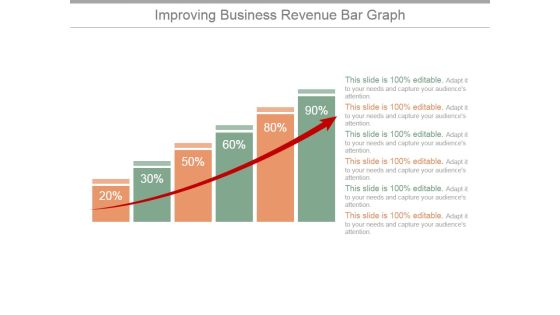
Improving Business Revenue Bar Graph Ppt PowerPoint Presentation Infographic Template
This is a improving business revenue bar graph ppt powerpoint presentation infographic template. This is a six stage process. The stages in this process are graph, arrow, finance, percentage, success.

Bar Chart Ppt PowerPoint Presentation Infographic Template Skills
This is a bar chart ppt powerpoint presentation infographic template skills. This is a nine stage process. The stages in this process are sales in percentage, finance, business, marketing, strategy, success.

Clustered Column Line Ppt PowerPoint Presentation Infographic Template Deck
This is a clustered column line ppt powerpoint presentation infographic template deck. This is a three stage process. The stages in this process are business, strategy, analysis, planning, sales in percentage, financial year.

Combo Chart Ppt PowerPoint Presentation Infographic Template Graphic Images
This is a combo chart ppt powerpoint presentation infographic template graphic images. This is a three stage process. The stages in this process are market size, growth rate, percentage, business, marketing.
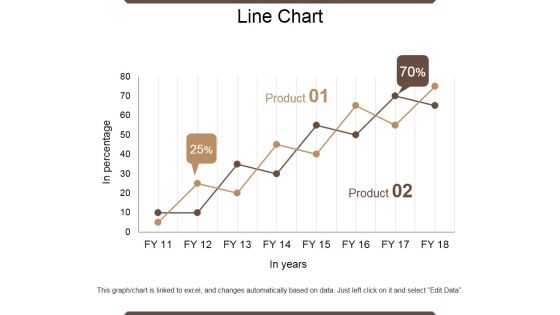
Line Chart Ppt PowerPoint Presentation Outline Infographic Template
This is a line chart ppt powerpoint presentation outline infographic template. This is a two stage process. The stages in this process are in percentage, product, in year, growth, success.
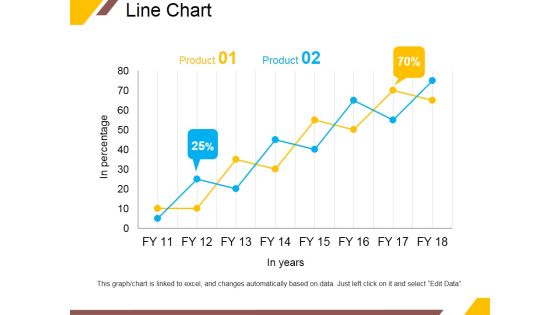
Line Chart Ppt PowerPoint Presentation Portfolio Infographic Template
This is a line chart ppt powerpoint presentation portfolio infographic template. This is a two stage process. The stages in this process are product, in years, business, percentage, growth.

Clustered Column Line Ppt PowerPoint Presentation Infographic Template Pictures
This is a clustered column line ppt powerpoint presentation infographic template pictures. This is a three stage process. The stages in this process are product, in percentage, bar graph, growth, success.

Area Chart Ppt PowerPoint Presentation Infographic Template Model
This is a area chart ppt powerpoint presentation infographic template model. This is a two stage process. The stages in this process are product, area chart, growth, percentage, success.

Bubble Chart Ppt PowerPoint Presentation Infographic Template Layouts
This is a bubble chart ppt powerpoint presentation infographic template layouts. This is a two stage process. The stages in this process are bubble chart, product, sales in percentage, growth.

Clustered Column Ppt PowerPoint Presentation Infographic Template Background Designs
This is a clustered column ppt powerpoint presentation infographic template background designs. This is a two stage process. The stages in this process are sales in percentage, bar, business, marketing, planning.

Line Chart Ppt PowerPoint Presentation Infographic Template Design Ideas
This is a line chart ppt powerpoint presentation infographic template design ideas. This is a two stage process. The stages in this process are product, in millions, percentage, line chart, success.

Line Chart Ppt PowerPoint Presentation Infographic Template Master Slide
This is a line chart ppt powerpoint presentation infographic template master slide. This is a two stage process. The stages in this process are product, financial years, sales in percentage.

Clustered Column Ppt PowerPoint Presentation Infographic Template Backgrounds
This is a clustered column ppt powerpoint presentation infographic template backgrounds. This is a two stage process. The stages in this process are sales in percentage, financial year, product.
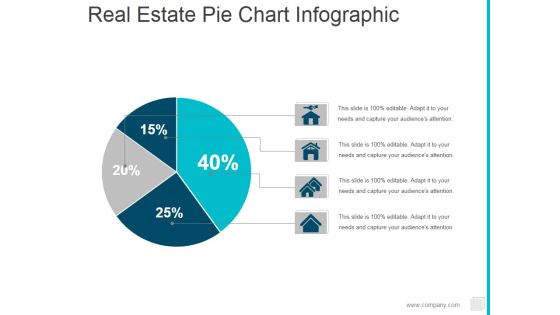
Real Estate Pie Chart Infographic Ppt PowerPoint Presentation Ideas Shapes
This is a real estate pie chart infographic ppt powerpoint presentation ideas shapes. This is a four stage process. The stages in this process are pie, finance, marketing, percentage.

Bar Graph Ppt PowerPoint Presentation Infographic Template Template
This is a bar graph ppt powerpoint presentation infographic template template. This is a three stage process. The stages in this process are bar graph, sales in percentage, product, planning, business.
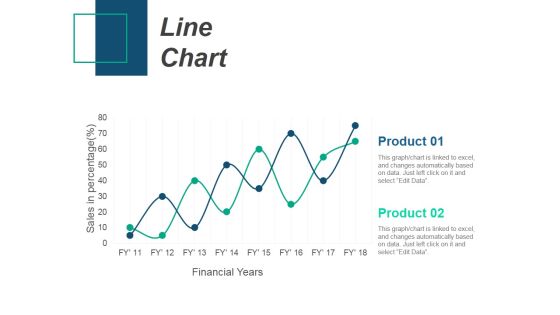
Line Chart Ppt PowerPoint Presentation Infographic Template Introduction
This is a line chart ppt powerpoint presentation infographic template introduction. This is a two stage process. The stages in this process are product, sales in percentage, financial years, line chart.
Line Chart Ppt PowerPoint Presentation Infographic Template Icons
This is a line chart ppt powerpoint presentation infographic template icons. This is a two stage process. The stages in this process are sales in percentage, financial years, product, line chart.

Clustered Column Line Ppt PowerPoint Presentation Outline Infographic Template
This is a clustered column line ppt powerpoint presentation outline infographic template. This is a three stage process. The stages in this process are product, sales in percentage, business, marketing, success.

Market Analysis Summary Ppt PowerPoint Presentation Infographic Template Example File
This is a market analysis summary ppt powerpoint presentation infographic template example file. This is a six stage process. The stages in this process are icons, percentage, finance, analysis, marketing.

Current Staff Composition Ppt PowerPoint Presentation Infographic Template Show
This is a current staff composition ppt powerpoint presentation infographic template show. This is a five stage process. The stages in this process are process, percentage, business, marketing, management.

External Analysis Industry Trends Ppt PowerPoint Presentation Infographic Template Visuals
This is a external analysis industry trends ppt powerpoint presentation infographic template visuals. This is a two stage process. The stages in this process are export, revenue, percentage, years, business, analysis.

Management Team Template 2 Ppt PowerPoint Presentation Slides Infographic Template
This is a management team template 2 ppt powerpoint presentation slides infographic template. This is a four stage process. The stages in this process are lily albert, john parker, mary finder, tom smith, percentage.

Stacked Line Ppt PowerPoint Presentation Infographic Template Graphics Template
This is a stacked line ppt powerpoint presentation infographic template graphics template. This is a three stage process. The stages in this process are product, in percentage, business, marketing, finance.
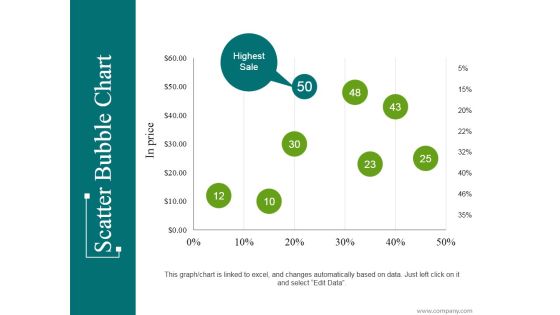
Scatter Bubble Chart Ppt PowerPoint Presentation Infographic Template Introduction
This is a scatter bubble chart ppt powerpoint presentation infographic template introduction. This is a eight stage process. The stages in this process are highest sale, business, marketing, percentage, finance.
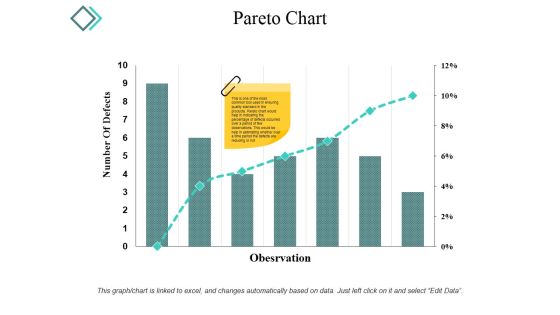
Pareto Chart Ppt PowerPoint Presentation Infographic Template Microsoft
This is a pareto chart ppt powerpoint presentation infographic template microsoft. This is a seven stage process. The stages in this process are number of defects, observation, graph, percentage, business.
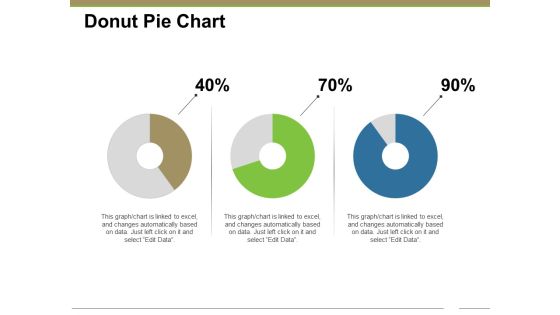
Donut Pie Chart Ppt PowerPoint Presentation Infographic Template Aids
This is a donut pie chart ppt powerpoint presentation infographic template aids. This is a three stage process. The stages in this process are chart, business, management, process, percentage.

Mind Map Ppt PowerPoint Presentation Infographic Template Graphics Tutorials
This is a mind map ppt powerpoint presentation infographic template graphics tutorials. This is a four stage process. The stages in this process are mind map, percentage, business, management, brainstorming.
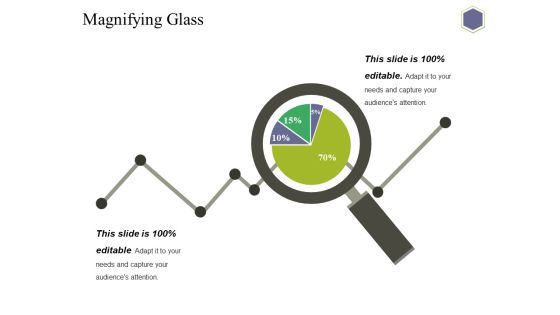
Magnifying Glass Ppt PowerPoint Presentation Infographic Template Graphics Download
This is a magnifying glass ppt powerpoint presentation infographic template graphics download. This is a two stage process. The stages in this process are magnifying glass, business, marketing, percentage, technology.
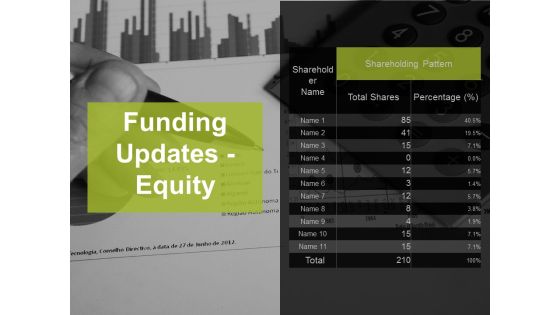
Funding Updates Equity Ppt PowerPoint Presentation Infographic Template Format
This is a funding updates equity ppt powerpoint presentation infographic template format. This is a three stage process. The stages in this process are total shares, percentage, business, marketing, planning.
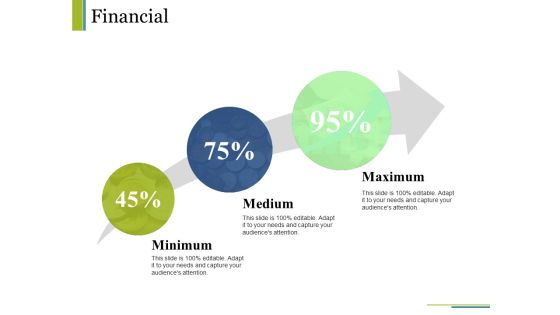
Financial Ppt PowerPoint Presentation Infographic Template Clipart Images
This is a financial ppt powerpoint presentation infographic template clipart images. This is a three stage process. The stages in this process are business, minimum, medium, maximum, financial, percentage.

Column Chart Ppt PowerPoint Presentation Infographic Template Icon
This is a column chart ppt powerpoint presentation infographic template icon. This is a two stage process. The stages in this process are business, marketing, sales in percentage, financial year, graph.

Donut Pie Chart Ppt PowerPoint Presentation File Infographic Template
This is a donut pie chart ppt powerpoint presentation file infographic template. This is a five stage process. The stages in this process are business, management, process, percentage, chart.

Bar Chart Ppt PowerPoint Presentation Infographic Template Picture
This is a bar chart ppt powerpoint presentation infographic template picture. This is a two stage process. The stages in this process are financial, in percentage, business, marketing, bar chart.

Bar Graph Ppt PowerPoint Presentation Infographic Template Demonstration
This is a bar graph ppt powerpoint presentation infographic template demonstration. This is a two stage process. The stages in this process are bar graph, product, sales, percentage, financial.
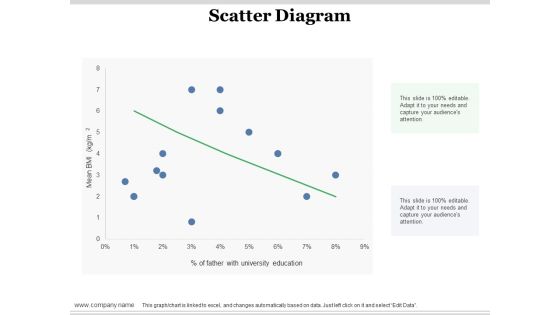
Scatter Diagram Ppt PowerPoint Presentation Infographic Template Design Ideas
This is a scatter diagram ppt powerpoint presentation infographic template design ideas. This is a one stage process. The stages in this process are scatter diagram, finance, in percentage, business, bar graph.

Bar Chart Ppt PowerPoint Presentation Infographic Template Graphics Design
This is a bar chart ppt powerpoint presentation infographic template graphics design. This is a five stage process. The stages in this process are management, marketing, business, percentage, product.

Donut Pie Chart Ppt PowerPoint Presentation Infographic Template Slides
This is a donut pie chart ppt powerpoint presentation infographic template slides. This is a three stage process. The stages in this process are percentage, product, business, management, marketing.

Clustered Column Product Ppt PowerPoint Presentation Outline Infographic Template
This is a clustered column product ppt powerpoint presentation outline infographic template. This is a three stage process. The stages in this process are product, percentage, business, management, marketing.
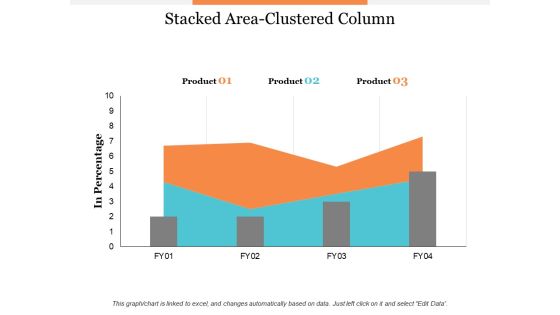
Stacked Area Clustered Column Ppt PowerPoint Presentation Infographic Template Summary
This is a stacked area clustered column ppt powerpoint presentation infographic template summary. This is a three stage process. The stages in this process are business, management, marketing, percentage, product.
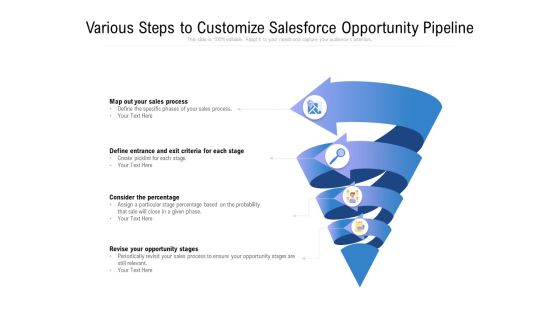
Market Analysis Funnel Infographic Ppt PowerPoint Presentation Portfolio Show PDF
Presenting this set of slides with name market analysis funnel infographic ppt powerpoint presentation portfolio show pdf. This is a four stage process. The stages in this process are map out your sales process, define entrance and exit criteria for each stage, consider the percentage, revise your opportunity stages. This is a completely editable PowerPoint presentation and is available for immediate download. Download now and impress your audience.

Companys Shareholder Structure With Details Ppt Infographic Template Tips PDF
This slide shows companys Shareholder structure with shareholder names and their respective percentages. Deliver an awe inspiring pitch with this creative companys shareholder structure with details ppt infographic template tips pdf bundle. Topics like shareholder, finance companies, investment bankers can be discussed with this completely editable template. It is available for immediate download depending on the needs and requirements of the user.

Task Matrix Marketing Ppt PowerPoint Presentation Infographic Template Design Inspiration
This is a task matrix marketing ppt powerpoint presentation infographic template design inspiration. The topics discussed in this diagram are business, management, planning, strategy, marketing. This is a completely editable PowerPoint presentation, and is available for immediate download.

Task Distribution Ppt PowerPoint Presentation Infographic Template Good
Presenting this set of slides with name task distribution ppt powerpoint presentation infographic template good. The topics discussed in these slides are development, research and development, ceo, digital department. This is a completely editable PowerPoint presentation and is available for immediate download. Download now and impress your audience.

Gantt Chart Management Ppt PowerPoint Presentation Infographic Template Designs
Presenting this set of slides with name gantt chart management ppt powerpoint presentation infographic template designs. The topics discussed in these slide is project, revision, tasks. This is a completely editable PowerPoint presentation and is available for immediate download. Download now and impress your audience.

Agile Methodologies Team Performance Measurement After Agile Implementation Infographics Ppt Infographic Template Ideas PDF
This slide shows team iteration metrics for the measurement of team performance based on parameters such as actual and planned velocity, planned and accepted stories, number of defects and test cases, percentage of automated tests etc. Deliver an awe inspiring pitch with this creative agile methodologies team performance measurement after agile implementation infographics ppt infographic template ideas pdf bundle. Topics like Team Performance Measurement After Agile Implementation can be discussed with this completely editable template. It is available for immediate download depending on the needs and requirements of the user.
Energy Tracking Device Establish Baselines Cost Ppt PowerPoint Presentation Infographic Template Background Image PDF
Deliver an awe-inspiring pitch with this creative energy tracking device establish baselines cost ppt powerpoint presentation infographic template background image pdf bundle. Topics like fuel, resource, productivity, total annual, consumption, production, total annual, cost, value, percentage total plant energy cost, production units can be discussed with this completely editable template. It is available for immediate download depending on the needs and requirements of the user.

Seed Funding Pre And Post Capitalization Table Ppt Infographic Template Design Inspiration PDF
This slide shows companys pre and post capitalization comparison table with total valuation of shares and their ownership percentage Deliver an awe-inspiring pitch with this creative seed funding pre and post capitalization table ppt infographic template design inspiration pdf. bundle. Topics like seed funding pre and post capitalization table can be discussed with this completely editable template. It is available for immediate download depending on the needs and requirements of the user.
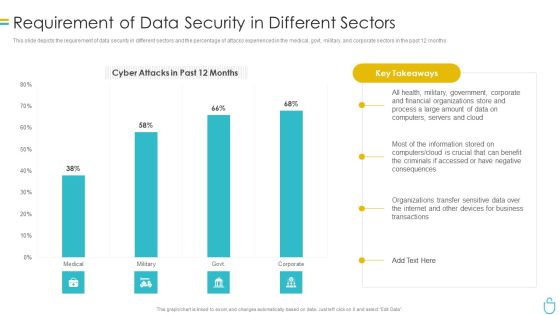
Information Security Requirement Of Data Security In Different Sectors Ppt File Infographic Template PDF
This slide depicts the requirement of data security in different sectors and the percentage of attacks experienced in the medical, govt, military, and corporate sectors in the past 12 months. Deliver an awe inspiring pitch with this creative information security requirement of data security in different sectors ppt file infographic template pdf bundle. Topics like process, financial, organizations, data, servers can be discussed with this completely editable template. It is available for immediate download depending on the needs and requirements of the user.

Employee Survey Results For Flexible Work Advantages Ppt Infographic Template Guidelines PDF
This slide shows the percentage wise results of survey conducted for employees regarding the advantages of flexible working culture. It includes main categories of adjustable work schedule, no travelling, family time and other advantages such as work life balance and focusing on physical health etc. Pitch your topic with ease and precision using this Employee Survey Results For Flexible Work Advantages Ppt Infographic Template Guidelines PDF. This layout presents information on Key Insights, Family Time, Adjustable Work Schedule, No Travelling. It is also available for immediate download and adjustment. So, changes can be made in the color, design, graphics or any other component to create a unique layout.

PPM Private Equity Key Streams Of Revenue Generation Ppt PowerPoint Presentation Infographic Template Show PDF
This slide shows Revenue Model of the Company with various revenue earning Channels that the Company has such as Online Stores, Product Sales, Subscription Fees etc. along with their respective percentage of the Total Revenue. Deliver an awe-inspiring pitch with this creative ppm private equity key streams of revenue generation ppt powerpoint presentation infographic template show pdf bundle. Topics like subscription fee technology, digital service, product sale, online sale, total revenue can be discussed with this completely editable template. It is available for immediate download depending on the needs and requirements of the user.

Information Technology Facilities Governance Measuring IT Staff Performance Ppt Infographic Template Graphics Download PDF
This slide helps in analyzing the performance of different IT executives representatives. It will help in tracking metrics such as cost per contact, percentage of tickets opened, etc. The staff performance will be assessed on various parameters such as cost, quality, productivity and service level. Deliver and pitch your topic in the best possible manner with this information technology facilities governance measuring IT staff performance ppt infographic template graphics download pdf. Use them to share invaluable insights on cost per contact, productivity, service level, technician, parameters and impress your audience. This template can be altered and modified as per your expectations. So, grab it now.

Your Mortgage Loan Plan For Hard Money Loan Services Proposal Ppt Infographic Template Design Ideas PDF
This slide showcases your mortgage loan plan for hard money loan services proposal. It provides details about loan amount, interest rate, rate type, annual percentage rate, term, 2nd mortgage, loan tenure, monthly payment, etc. Take your presentations to the next level with our Your Mortgage Loan Plan For Hard Money Loan Services Proposal Ppt Infographic Template Design Ideas PDF template. With its sleek design and seamless editing features, this single-slide PPT template is a game-changer for professionals who want to make an impact. Impress your audience with stunning visuals and engaging content that will capture their attention from start to finish. Get your hands on our template and elevate your presentations to new heights.

Changes In Competitive Environment Template 2 Ppt PowerPoint Presentation Infographic Template Themes
This is a changes in competitive environment template 2 ppt powerpoint presentation infographic template themes. This is a four stage process. The stages in this process are weekly, monthly, year, finance, percentage.
Stacked Column Ppt PowerPoint Presentation Icon Deck Ppt PowerPoint Presentation Pictures Infographic Template
This is a stacked column ppt powerpoint presentation icon deck ppt powerpoint presentation pictures infographic template. This is a two stage process. The stages in this process are stacked column, sales, percentage, product, growth.

Survey For Price Analysis Template 2 Ppt PowerPoint Presentation Infographic Template Aids
This is a survey for price analysis template 2 ppt powerpoint presentation infographic template aids. This is a five stage process. The stages in this process are analysis, business, management, marketing, percentage.
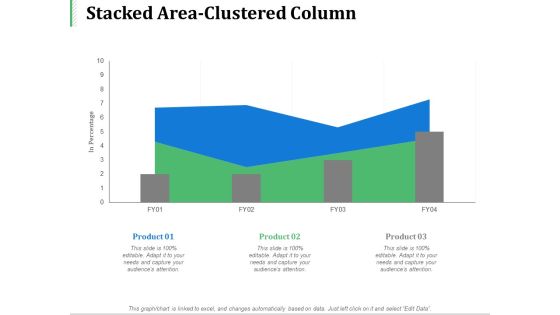
Stacked Area Clustered Column Marketing Ppt PowerPoint Presentation Infographic Template Vector
This is a stacked area clustered column marketing ppt powerpoint presentation infographic template vector. This is a three stage process. The stages in this process are business, management, marketing, product, percentage.

Employee Weekly Efficiency Dashboard Ppt PowerPoint Presentation Infographic Template Graphic Images
This is a employee weekly efficiency dashboard ppt powerpoint presentation infographic template graphic images. This is a six stage process. The stages in this process are percentage, product, business, management, marketing.

Business Chart Showing Economic Growth Trend Ppt PowerPoint Presentation Infographic Template Format
Presenting this set of slides with name business chart showing economic growth trend ppt powerpoint presentation infographic template format. The topics discussed in these slides are gdp growth rate, percentage. This is a completely editable PowerPoint presentation and is available for immediate download. Download now and impress your audience.
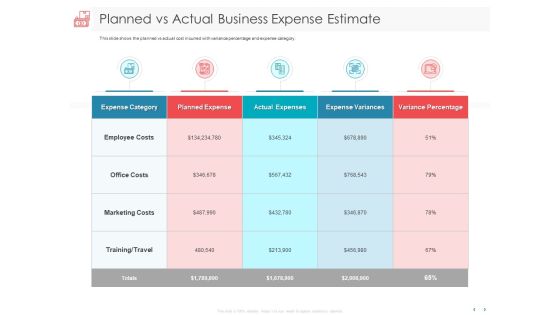
Managing CFO Services Planned Vs Actual Business Expense Estimate Ppt Infographic Template Slide Download PDF
Presenting this set of slides with name managing cfo services planned vs actual business expense estimate ppt infographic template slide download pdf. The topics discussed in these slides are expense category, planned expense, actual expenses, expense variances, variance percentage. This is a completely editable PowerPoint presentation and is available for immediate download. Download now and impress your audience.
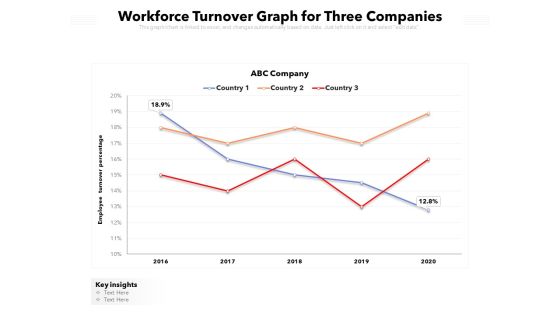
Workforce Turnover Graph For Three Companies Ppt PowerPoint Presentation Infographic Template Visuals PDF
Presenting this set of slides with name workforce turnover graph for three companies ppt powerpoint presentation infographic template visuals pdf. The topics discussed in these slides are key insights, 2016 to 2020, employee turnover percentage. This is a completely editable PowerPoint presentation and is available for immediate download. Download now and impress your audience.

Client Segmentation Analysis Customer Segmentation Layout Ppt Infographic Template Microsoft PDF
Presenting this set of slides with name client segmentation analysis customer segmentation layout ppt infographic template microsoft pdf. This is a two stage process. The stages in this process are target, market, percentage, aware, neutral. This is a completely editable PowerPoint presentation and is available for immediate download. Download now and impress your audience.

Number Of Female And Female Employees Of Companies Ppt PowerPoint Presentation Layouts Infographic Template PDF
Presenting this set of slides with name number of female and female employees of companies ppt powerpoint presentation layouts infographic template pdf. The topics discussed in these slides are male employee, female employee, global headcount percentage. This is a completely editable PowerPoint presentation and is available for immediate download. Download now and impress your audience

Attain Production Goals And Objectives Graph And Table Ppt Infographic Template Visuals PDF
This slide displays graphical representation of targeted and achieved production variance. It also includes critical insights such as target units, achieved production, achieved percentage, overachieved percentage, etc. Pitch your topic with ease and precision using this Attain Production Goals And Objectives Graph And Table Ppt Infographic Template Visuals PDF. This layout presents information on Target Vs Achieved, Key insight Table, Quarterly. It is also available for immediate download and adjustment. So, changes can be made in the color, design, graphics or any other component to create a unique layout.

PPM Private Equity Private Placement Capitalization Table Ppt PowerPoint Presentation Infographic Template Model PDF
This slide shows companys Private Placement pre and post capitalization comparison table with total valuation of shares and their ownership percentage. This is a ppm private equity private placement capitalization table ppt powerpoint presentation infographic template model pdf template with various stages. Focus and dispense information on two stages using this creative set, that comes with editable features. It contains large content boxes to add your information on topics like ownership percentage, total shares value, founders, seed investors, venture capitalist. You can also showcase facts, figures, and other relevant content using this PPT layout. Grab it now.

Sales Pipeline Management Funnel Infographic Ppt PowerPoint Presentation Show Designs Download PDF
Presenting this set of slides with name sales pipeline management funnel infographic ppt powerpoint presentation show designs download pdf. This is a four stage process. The stages in this process are map out your sales process, define entrance and exit criteria for each stage, consider the percentage, revise your opportunity stages. This is a completely editable PowerPoint presentation and is available for immediate download. Download now and impress your audience.

Integrating Logistics Automation Solution Current Order Accuracy Status In The Company Ppt Infographic Template Model PDF
This slide covers the current order accuracy status in the company in terms of accurate and inaccurate percentages. Presenting this PowerPoint presentation, titled Integrating Logistics Automation Solution Current Order Accuracy Status In The Company Ppt Infographic Template Model PDF, with topics curated by our researchers after extensive research. This editable presentation is available for immediate download and provides attractive features when used. Download now and captivate your audience. Presenting this Integrating Logistics Automation Solution Current Order Accuracy Status In The Company Ppt Infographic Template Model PDF. Our researchers have carefully researched and created these slides with all aspects taken into consideration. This is a completely customizable Integrating Logistics Automation Solution Current Order Accuracy Status In The Company Ppt Infographic Template Model PDF that is available for immediate downloading. Download now and make an impact on your audience. Highlight the attractive features available with our PPTs.
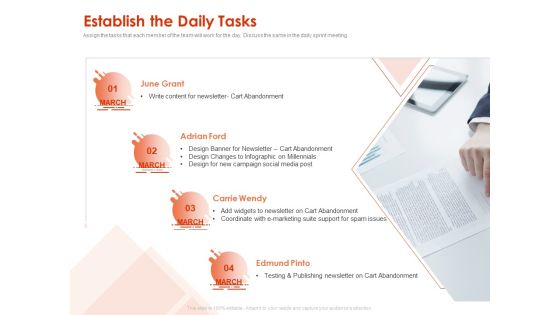
Implementing Agile Marketing In Your Organization Establish The Daily Tasks Ppt Infographic Template Outfit PDF
Presenting this set of slides with name implementing agile marketing in your organization establish the daily tasks ppt infographic template outfit pdf. This is a four stage process. The stages in this process are cart abandonment, infographic on millennials, social media post, testing and publishing. This is a completely editable PowerPoint presentation and is available for immediate download. Download now and impress your audience.

Project Information Worksheet With Task Status Ppt PowerPoint Presentation Infographic Template Master Slide
This is a project information worksheet with task status ppt powerpoint presentation infographic template master slide. This is a three stage process. The stages in this process are project closure, project completion, project accomplishment.
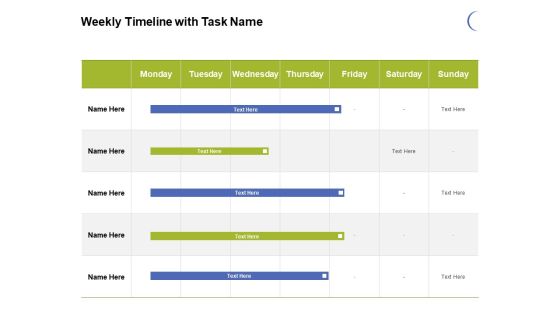
Weekly Timeline With Task Name Ppt PowerPoint Presentation Visual Aids Infographic Template
Presenting this set of slides with name weekly timeline with task name ppt powerpoint presentation visual aids infographic template. The topics discussed in these slide is weekly timeline task. This is a completely editable PowerPoint presentation and is available for immediate download. Download now and impress your audience.

Star Performer Monthly Timeline With Task Name Ppt Infographic Template Mockup PDF
Presenting this set of slides with name star performer monthly timeline with task name ppt infographic template mockup pdf. The topics discussed in these slides are monthly timeline with task name. This is a completely editable PowerPoint presentation and is available for immediate download. Download now and impress your audience.

Project Financial Plan With Task Details Ppt PowerPoint Presentation Infographic Template Graphics Tutorials PDF
Presenting this set of slides with name project financial plan with task details ppt powerpoint presentation infographic template graphics tutorials pdf. The topics discussed in these slide is project financial plan with task details. This is a completely editable PowerPoint presentation and is available for immediate download. Download now and impress your audience.
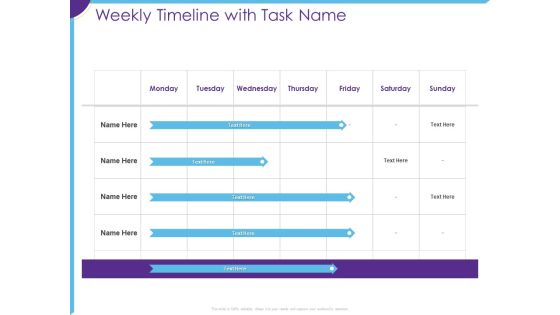
Optimization Restaurant Operations Weekly Timeline With Task Name Ppt Infographic Template Guide PDF
Deliver an awe-inspiring pitch with this creative optimization restaurant operations weekly timeline with task name ppt infographic template guide pdf bundle. Topics like weekly timeline with task name can be discussed with this completely editable template. It is available for immediate download depending on the needs and requirements of the user.

Manager Creating Plan For Marketing Campaign Tasks Ppt Infographic Template Background Image PDF
Presenting manager creating plan for marketing campaign tasks ppt infographic template background image pdf to dispense important information. This template comprises three stages. It also presents valuable insights into the topics including manager creating plan for marketing campaign tasks. This is a completely customizable PowerPoint theme that can be put to use immediately. So, download it and address the topic impactfully.
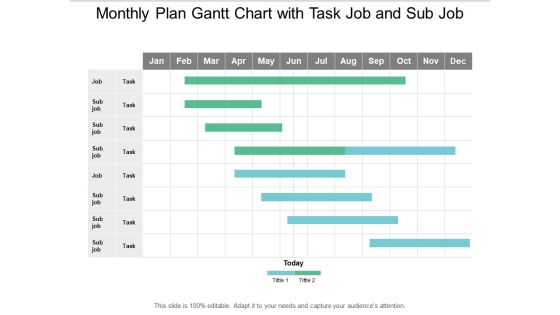
Monthly Plan Gantt Chart With Task Job And Sub Job Ppt PowerPoint Presentation Infographic Template Mockup
This is a monthly plan gantt chart with task job and sub job ppt powerpoint presentation infographic template mockup. The topics discussed in this diagram are critical path method, critical path analysis, cpm. This is a completely editable PowerPoint presentation, and is available for immediate download.
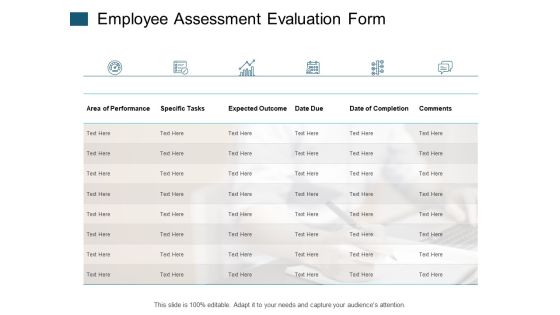
Employee Assessment Evaluation Form Specific Tasks Ppt PowerPoint Presentation Infographic Template Display
Presenting this set of slides with name employee assessment evaluation form specific tasks ppt powerpoint presentation infographic template display. The topics discussed in these slides are marketing, business, management, planning, strategy. This is a completely editable PowerPoint presentation and is available for immediate download. Download now and impress your audience.
Technology To Automate Tasks And Boost Productivity Ppt PowerPoint Presentation Infographic Template File Formats
Presenting this set of slides with name technology to automate tasks and boost productivity ppt powerpoint presentation infographic template file formats. The topics discussed in these slides are generation technology, big data analytics, technology. This is a completely editable PowerPoint presentation and is available for immediate download. Download now and impress your audience.

Calendar Icon For Task Schedule Ppt PowerPoint Presentation Infographic Template Example Topics
Presenting this set of slides with name calendar icon for task schedule ppt powerpoint presentation infographic template example topics. This is a one stage process. The stages in this process are program planning, evaluation phases, planning process. This is a completely editable PowerPoint presentation and is available for immediate download. Download now and impress your audience.
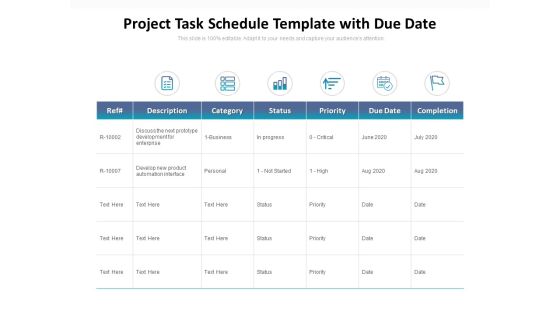
Project Task Schedule Template With Due Date Ppt PowerPoint Presentation Infographic Template Example Topics
Presenting this set of slides with name project task schedule template with due date ppt powerpoint presentation infographic template example topics. The topics discussed in these slides are prototype development enterprise, business, progress, product automation interface. This is a completely editable PowerPoint presentation and is available for immediate download. Download now and impress your audience.
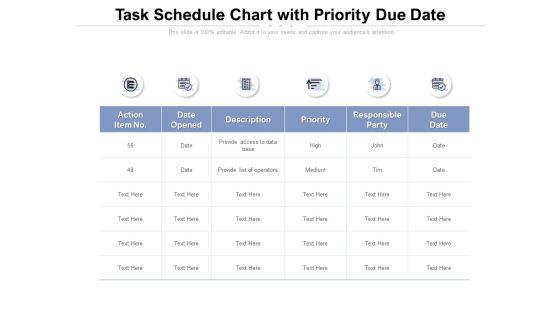
Task Schedule Chart With Priority Due Date Ppt PowerPoint Presentation Infographic Template Background
Presenting this set of slides with name task schedule chart with priority due date ppt powerpoint presentation infographic template background. The topics discussed in these slides are provide access, data base, provide list, operators. This is a completely editable PowerPoint presentation and is available for immediate download. Download now and impress your audience.

Project Task Assignment Template With Employee Names Ppt PowerPoint Presentation Styles Infographic Template
Presenting this set of slides with name project task assignment template with employee names ppt powerpoint presentation styles infographic template. The topics discussed in these slides are resources, software project, accounting project, designing project. This is a completely editable PowerPoint presentation and is available for immediate download. Download now and impress your audience.
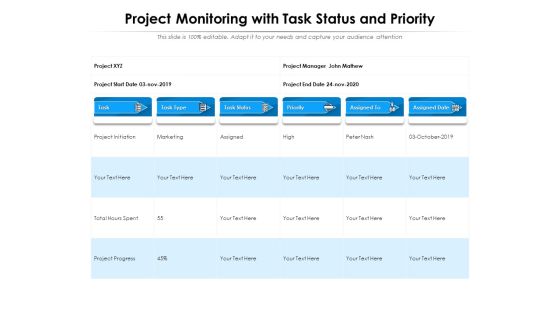
Project Monitoring With Task Status And Priority Ppt PowerPoint Presentation File Infographic Template PDF
Showcasing this set of slides titled project monitoring with task status and priority ppt powerpoint presentation file infographic template pdf. The topics addressed in these templates are priority, marketing, initiation. All the content presented in this PPT design is completely editable. Download it and make ajustments in color, background, font etc. as per your unique business setting.

Impact Effort Grid Chart With Business Tasks Ppt PowerPoint Presentation Infographic Template Template PDF
Presenting impact effort grid chart with business tasks ppt powerpoint presentation infographic template template pdf to dispense important information. This template comprises four stages. It also presents valuable insights into the topics including quick wins, big projects, fill ins, no thanks. This is a completely customizable PowerPoint theme that can be put to use immediately. So, download it and address the topic impactfully.

Business Product Launch Task List With Icons Ppt PowerPoint Presentation Infographic Template Tips PDF
Showcasing this set of slides titled business product launch task list with icons ppt powerpoint presentation infographic template tips pdf. The topics addressed in these templates are salience, communication, attraction, point purchase, endurance. All the content presented in this PPT design is completely editable. Download it and make adjustments in color, background, font etc. as per your unique business setting.
Essential Technology Management Tasks Displayed Through Eight Box Infographic Ppt PowerPoint Presentation Icon Ideas PDF
Presenting essential technology management tasks displayed through eight box infographic ppt powerpoint presentation icon ideas pdf to dispense important information. This template comprises eight stages. It also presents valuable insights into the topics including cloud integration, virtualization, it maintenance. This is a completely customizable PowerPoint theme that can be put to use immediately. So, download it and address the topic impactfully.

Essential Technology Management Tasks Displayed Through Five Box Infographic Ppt PowerPoint Presentation File Graphic Tips PDF
Presenting essential technology management tasks displayed through five box infographic ppt powerpoint presentation file graphic tips pdf to dispense important information. This template comprises five stages. It also presents valuable insights into the topics including cloud integration, virtualization, it maintenance. This is a completely customizable PowerPoint theme that can be put to use immediately. So, download it and address the topic impactfully.

Essential Technology Management Tasks Displayed Through Nine Box Infographic Ppt PowerPoint Presentation File Clipart PDF
Presenting essential technology management tasks displayed through nine box infographic ppt powerpoint presentation file clipart pdf to dispense important information. This template comprises nine stages. It also presents valuable insights into the topics including cloud integration, virtualization, it maintenance. This is a completely customizable PowerPoint theme that can be put to use immediately. So, download it and address the topic impactfully.

Essential Technology Management Tasks Displayed Through Six Box Infographic Ppt PowerPoint Presentation File Graphics Pictures PDF
Presenting essential technology management tasks displayed through six box infographic ppt powerpoint presentation file graphics pictures pdf to dispense important information. This template comprises six stages. It also presents valuable insights into the topics including cloud integration, virtualization, it maintenance. This is a completely customizable PowerPoint theme that can be put to use immediately. So, download it and address the topic impactfully.
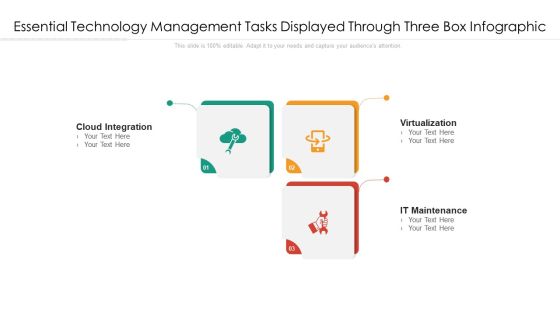
Essential Technology Management Tasks Displayed Through Three Box Infographic Ppt PowerPoint Presentation File Portfolio PDF
Presenting essential technology management tasks displayed through three box infographic ppt powerpoint presentation file portfolio pdf to dispense important information. This template comprises three stages. It also presents valuable insights into the topics including cloud integration, virtualization, it maintenance. This is a completely customizable PowerPoint theme that can be put to use immediately. So, download it and address the topic impactfully.
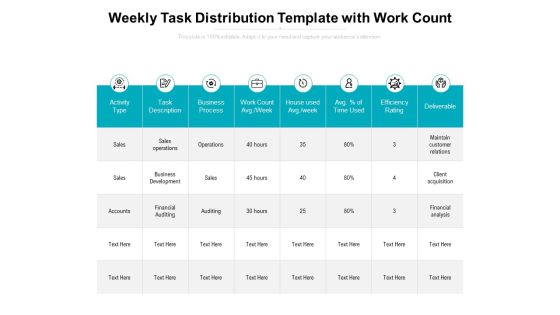
Weekly Task Distribution Template With Work Count Ppt PowerPoint Presentation Infographic Template Slide Download
Presenting this set of slides with name weekly task distribution template with work count ppt powerpoint presentation infographic template slide download. The topics discussed in these slides are activity type, task description, business process, work count avg week, house used avg week, avg percent of time used, efficiency rating, deliverable. This is a completely editable PowerPoint presentation and is available for immediate download. Download now and impress your audience.

Daily Task List Of Business Analyst Ppt PowerPoint Presentation Infographic Template Themes PDF
Presenting this set of slides with name daily task list of business analyst ppt powerpoint presentation infographic template themes pdf. This is a five stage process. The stages in this process are preparing and gathering business requirements, planning and documenting requirements, taking changes requests, analyze and model requirements, performance acceptance testing. This is a completely editable PowerPoint presentation and is available for immediate download. Download now and impress your audience.
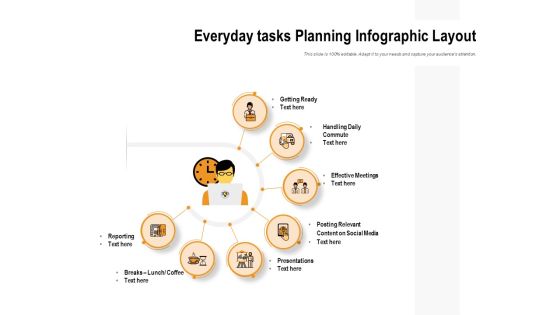
Everyday Tasks Planning Infographic Layout Ppt PowerPoint Presentation Show Mockup PDF
Presenting this set of slides with name everyday tasks planning infographic layout ppt powerpoint presentation show mockup pdf. This is a seven stage process. The stages in this process are getting ready, handling daily commute, effective meetings, posting relevant content on social medi, presentations, breaks lunch coffee, reporting. This is a completely editable PowerPoint presentation and is available for immediate download. Download now and impress your audience.
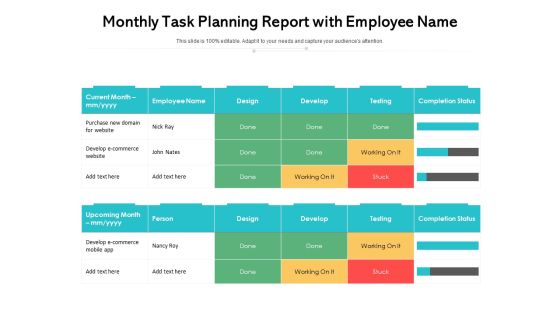
Monthly Task Planning Report With Employee Name Ppt PowerPoint Presentation Slides Infographic Template PDF
Pitch your topic with ease and precision using this monthly task planning report with employee name ppt powerpoint presentation slides infographic template pdf. This layout presents information on completion status, purchase new domain for website, develop e commerce mobile app. It is also available for immediate download and adjustment. So, changes can be made in the color, design, graphics or any other component to create a unique layout.

Workflow Status Update Status Report For Business Management Ppt Infographic Template Background PDF
This slide showcase business workstream updates report. It covers business deliverables, target date for completion, actual date, task status and comments. Showcasing this set of slides titled Workflow Status Update Status Report For Business Management Ppt Infographic Template Background PDF. The topics addressed in these templates are Planning, Research, Designing. All the content presented in this PPT design is completely editable. Download it and make adjustments in color, background, font etc. as per your unique business setting.

CRM For Real Estate Marketing Sales Team Productivity Assessment Ppt PowerPoint Presentation Infographic Template Brochure PDF
Presenting this set of slides with name crm for real estate marketing sales team productivity assessment ppt powerpoint presentation infographic template brochure pdf. The topics discussed in these slides are win ratios, top lost reasons, activity goals vs, performance this month, successful calls, planned meetings, tasks. This is a completely editable PowerPoint presentation and is available for immediate download. Download now and impress your audience.

Business Introduction To Customer With Work Environment Ppt PowerPoint Presentation Infographic Template Background Designs PDF
Presenting business introduction to customer with work environment ppt powerpoint presentation infographic template background designs pdf to dispense important information. This template comprises nine stages. It also presents valuable insights into the topics including content creabon, our strategy, marketing, productivity, office tasks, work environment, project management, outreach campaign, customer reviews, deaired experience, customer service, product advertising, trade shows. This is a completely customizable PowerPoint theme that can be put to use immediately. So, download it and address the topic impactfully.

Cybersecurity Timeline For The Implementation Of Electronic Information Security Ppt Infographic Template Information PDF
This slide shows the timeline for cyber security model implementation in an organization and the tasks to be performed every month. Deliver an awe inspiring pitch with this creative cybersecurity timeline for the implementation of electronic information security ppt infographic template information pdf bundle. Topics like security documentation, network can be discussed with this completely editable template. It is available for immediate download depending on the needs and requirements of the user.

Managing Information Technology Security 60 Days Ppt Infographic Template Samples PDF
This slide depicts how the network security model will work in the first 30 days and the tasks the organization should focus on. Deliver an awe inspiring pitch with this creative managing information technology security 60 days ppt infographic template samples pdf bundle. Topics like managing information technology security 60 days plan can be discussed with this completely editable template. It is available for immediate download depending on the needs and requirements of the user.

Business Project Management Calendar With Task Status Ppt Infographic Template Visual Aids PDF
This slide shows the project management timeline which focuses on project phases with different tasks such as reviewing testing materials, creating evaluation feedback, composing review questions, ensuring standard compliance, creating review and feedback, etc. with status in terms of duration, completion and at risk. Presenting Business Project Management Calendar With Task Status Ppt Infographic Template Visual Aids PDF to dispense important information. This template comprises one stages. It also presents valuable insights into the topics including Composing Review Question, Creating, Review And Feedback, Completion. This is a completely customizable PowerPoint theme that can be put to use immediately. So, download it and address the topic impactfully.
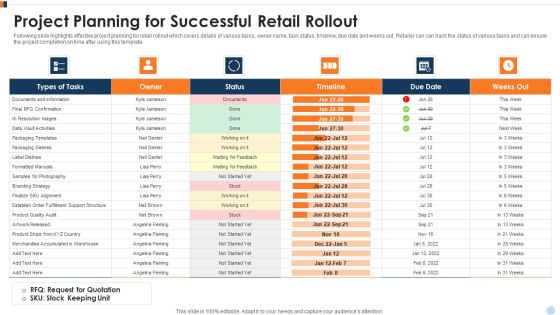
Project Planning For Successful Retail Rollout Ppt Infographic Template Model PDF
Following slide highlights effective project planning for retail rollout which covers details of various tasks, owner name, task status, timeline, due date and weeks out. Retailer can can track the status of various tasks and can ensure the project completion on time after using this template. Pitch your topic with ease and precision using this Project Planning For Successful Retail Rollout Ppt Infographic Template Model PDF. This layout presents information on Documents And Information, Final RFQ Confirmation, Establish Order Fulfillment. It is also available for immediate download and adjustment. So, changes can be made in the color, design, graphics or any other component to create a unique layout.

Sprint Process Management Approach In Web Development Ppt Infographic Template Slide PDF
This slide showcase agile approach in web development with sprint displaying task progress with risk involved. It includes task involved, sprint status and risk involved. Showcasing this set of slides titled Sprint Process Management Approach In Web Development Ppt Infographic Template Slide PDF. The topics addressed in these templates are Website Design, Login Credential, Account Page Design. All the content presented in this PPT design is completely editable. Download it and make adjustments in color, background, font etc. as per your unique business setting.
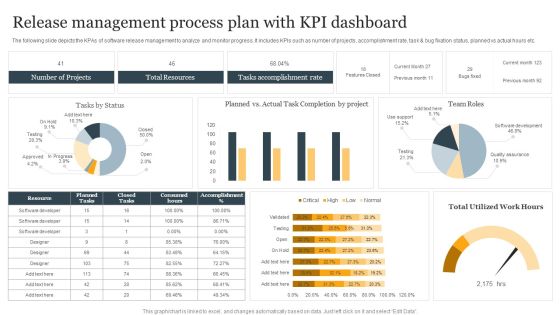
Release Management Process Plan With KPI Dashboard Ppt Infographic Template Structure PDF
The following slide depicts the KPAs of software release management to analyze and monitor progress. It includes KPIs such as number of projects, accomplishment rate, task and bug fixation status, planned vs actual hours etc. Showcasing this set of slides titled Release Management Process Plan With KPI Dashboard Ppt Infographic Template Structure PDF. The topics addressed in these templates are Number Of Projects, Total Resources, Tasks Accomplishment Rate. All the content presented in this PPT design is completely editable. Download it and make adjustments in color, background, font etc. as per your unique business setting.
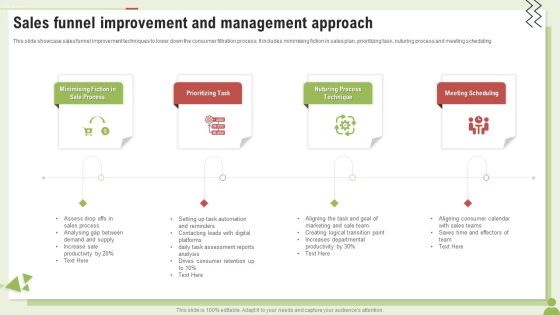
Sales Funnel Improvement And Management Approach Ppt PowerPoint Presentation Infographic Template Grid PDF
This slide showcase sales funnel improvement techniques to lower down the consumer filtration process. It includes minimising fiction in sales plan, prioritizing task, nuturing process and meeting scheduling. Presenting Sales Funnel Improvement And Management Approach Ppt PowerPoint Presentation Infographic Template Grid PDF to dispense important information. This template comprises four stages. It also presents valuable insights into the topics including Minimising Fiction, Prioritizing Task, Process Technique. This is a completely customizable PowerPoint theme that can be put to use immediately. So, download it and address the topic impactfully.

B2B Social Media Marketing Program With Allocated Budget Ppt Infographic Template Rules PDF
This slide shows the quarterly plan for b2b social media marketing. It includes details related to the tasks, person assigned, status, priority, goal and the allocated budget for each task. Showcasing this set of slides titled B2B Social Media Marketing Program With Allocated Budget Ppt Infographic Template Rules PDF. The topics addressed in these templates are Timeline, Goal, Budget. All the content presented in this PPT design is completely editable. Download it and make adjustments in color, background, font etc. as per your unique business setting.

Earned Value Management Analysis Of Different Activities Ppt Infographic Template Slides PDF
This slide represents earned value management analysis of different activities illustrating activities, budget at completion, planned value, actual cost etc use for valuing each activity performance in a project. Presenting Earned Value Management Analysis Of Different Activities Ppt Infographic Template Slides PDF to dispense important information. This template comprises one stages. It also presents valuable insights into the topics including Develop Scope, Develop Task Schedule, Create Risk Plan. This is a completely customizable PowerPoint theme that can be put to use immediately. So, download it and address the topic impactfully.

Project Administrative Procedure With Portfolio Planning Ppt PowerPoint Presentation Gallery Infographic Template PDF
This slide focuses on project portfolio management process which includes plan, select, capture, manage and execute that are helpful in managing project schedule, resources, time and cost by tasking strategic initiatives, managing portfolio, preparing progress report, etc. Presenting project administrative procedure with portfolio planning ppt powerpoint presentation gallery infographic template pdf to dispense important information. This template comprises five stages. It also presents valuable insights into the topics including project management, collaboration, portfolio planning, portfolio management, demand management. This is a completely customizable PowerPoint theme that can be put to use immediately. So, download it and address the topic impactfully.

90 Days Employee Onboarding Of Project Management Team Ppt Infographic Template Show PDF
This slide covers the 90 day plan for the project management team onboarding. I covers the tasks on weekly and 30 days gap basis i.e. 30, 60, 90. Presenting 90 Days Employee Onboarding Of Project Management Team Ppt Infographic Template Show PDF to dispense important information. This template comprises five stages. It also presents valuable insights into the topics including Prestart, 30 Days, 60 Days, 90 Days. This is a completely customizable PowerPoint theme that can be put to use immediately. So, download it and address the topic impactfully..

Monthly Business Project Management Calendar With System Designing Ppt Show Infographic Template PDF
This slide shows the monthly project management timeline for website development which includes two teams such as UX and Backend team whose main tasks are system designing, getting approval from client, creating wireframes of pages, defining website policies, etc. Pitch your topic with ease and precision using this Monthly Business Project Management Calendar With System Designing Ppt Show Infographic Template PDF. This layout presents information on Completed, Backend Team, Defining Website Policy. It is also available for immediate download and adjustment. So, changes can be made in the color, design, graphics or any other component to create a unique layout.

Monthly For Calendar Business Project Management Ppt Infographic Template Show PDF
This slide focuses on the monthly project management timeline which covers project schedule that includes events, approved projects with different phases such as writing first draft, gathering source material, adding new task, printing brochure, website project, online support, etc. Showcasing this set of slides titled Monthly For Calendar Business Project Management Ppt Infographic Template Show PDF. The topics addressed in these templates are Brochure Project, Approved Projects, Online Support Hub. All the content presented in this PPT design is completely editable. Download it and make adjustments in color, background, font etc. as per your unique business setting.

Sprint Planner For Event Management And Planning Ppt Infographic Template Design Templates PDF
This slide shows sprint calendar for two weeks to assure proper and efficient event management planning. It includes activities such as team selection, create time box, set daily tasks, event refinement meeting, resource allocation and retrospective sessions. Presenting Sprint Planner For Event Management And Planning Ppt Infographic Template Design Templates PDF to dispense important information. This template comprises two stages. It also presents valuable insights into the topics including Daily Scrum, Resource Allocation, Develop Time Box. This is a completely customizable PowerPoint theme that can be put to use immediately. So, download it and address the topic impactfully.
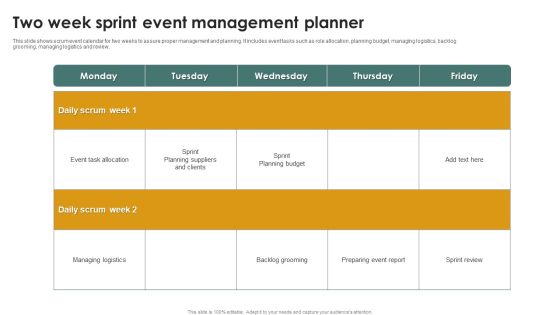
Two Week Sprint Event Management Planner Ppt Infographic Template Example PDF
This slide shows scrum event calendar for two weeks to assure proper management and planning. It includes event tasks such as role allocation, planning budget, managing logistics, backlog grooming, managing logistics and review. Presenting Two Week Sprint Event Management Planner Ppt Infographic Template Example PDF to dispense important information. This template comprises two stages. It also presents valuable insights into the topics including Daily Scrum Week, Managing Logistics, Backlog Grooming . This is a completely customizable PowerPoint theme that can be put to use immediately. So, download it and address the topic impactfully.
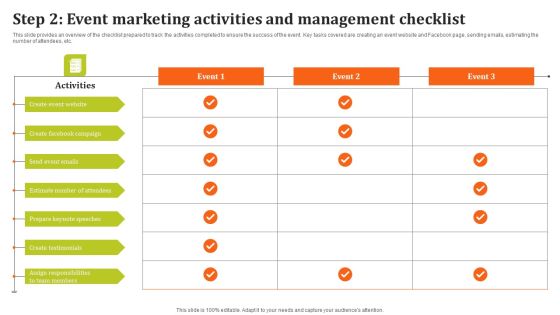
Step 2 Event Marketing Activities And Management Checklist Ppt Infographic Template File Formats PDF
This slide provides an overview of the checklist prepared to track the activities completed to ensure the success of the event. Key tasks covered are creating an event website and Facebook page, sending emails, estimating the number of attendees, etc. Slidegeeks has constructed Step 2 Event Marketing Activities And Management Checklist Ppt Infographic Template File Formats PDF after conducting extensive research and examination. These presentation templates are constantly being generated and modified based on user preferences and critiques from editors. Here, you will find the most attractive templates for a range of purposes while taking into account ratings and remarks from users regarding the content. This is an excellent jumping off point to explore our content and will give new users an insight into our top notch PowerPoint Templates.
Intellectual Property Gantt Chart Ppt PowerPoint Presentation Icon Infographic Template PDF
Our Gantt Chart PowerPoint Template is a modern and professional layout designed to create some of the vital components that help you to create timelines, roadmaps, project plans, etc. Communicate your project activity durations, milestones, tasks, subtasks, dependencies and other attributes with this content ready PowerPoint template. Further, showcase precedence against time by employing this fully editable PowerPoint chart into your business tasks. With a single glance at this resourceful PPT layout, the audiences can get a complete overview of the tasks, duration, resources employed, and overlapping of the activities in a particular project, making it an ideal choice for project managers and leaders. Not only this, but the color scheme of this template is also such that it is sure to impress your audience, no matter which niche they belong to. Thus steer your project meetings, meetups, and conferences with this Gantt Chart PPT slide

Auto Insurance Policies Claims Management Dashboard Infographics PDF
This slide illustrates graphical representation of data that helps the insurer company manages the car insurance policy claims. It includes no. of claims, percentage of claims, claims by usage, claims by type of vehicle etc. Pitch your topic with ease and precision using this Auto Insurance Policies Claims Management Dashboard Infographics PDF. This layout presents information on Percentage Claims, Claims Usage, Claims Type Vehicle. It is also available for immediate download and adjustment. So, changes can be made in the color, design, graphics or any other component to create a unique layout.

Line Chart Ppt PowerPoint Presentation Infographics Infographics
This is a line chart ppt powerpoint presentation infographics infographics. This is a two stage process. The stages in this process are product, sales in percentage, financial year, line chart, finance.
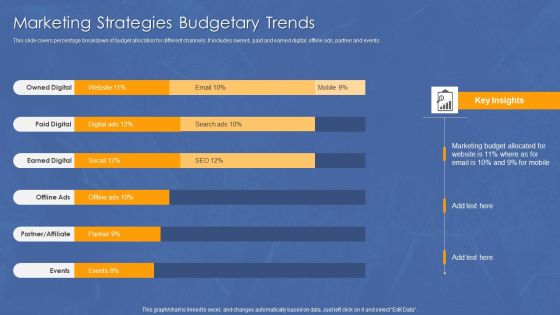
Marketing Strategies Budgetary Trends Infographics PDF
This slide covers percentage breakdown of budget allocation for different channels. It includes owned , paid and earned digital, offline ads, partner and events.Showcasing this set of slides titled Marketing Strategies Budgetary Trends Infographics PDF. The topics addressed in these templates are Owned Digital, Partner Affiliate, Earned Digital. All the content presented in this PPT design is completely editable. Download it and make adjustments in color, background, font etc. as per your unique business setting.
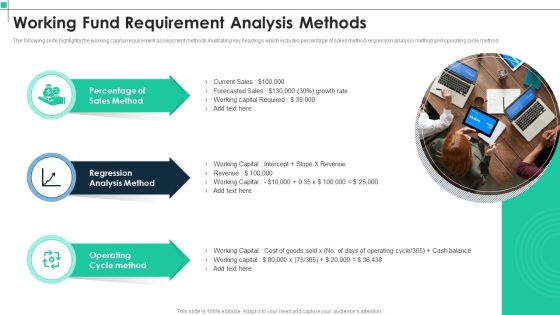
Working Fund Requirement Analysis Methods Infographics PDF
The following slide highlights the working capital requirement assessment methods illustrating key headings which includes percentage of sales method, regression analysis method and operating cycle method. Persuade your audience using this Working Fund Requirement Analysis Methods Infographics PDF. This PPT design covers three stages, thus making it a great tool to use. It also caters to a variety of topics including Sales Method, Regression Analysis Method, Operating Cycle Method. Download this PPT design now to present a convincing pitch that not only emphasizes the topic but also showcases your presentation skills.
Task Tracker Template Ppt Infographics
This is a task tracker template ppt infographics. This is a five stage process. The stages in this process are task management, create task, assign task to employee, update task, task complete.

Cost Allotment Technique Cost Allocation Method Used Infographics PDF
This slide covers the final allocation base percentage of the allocation base with its numerator, denominator and percentage of the total multiplied by indirect cost.Presenting Cost Allotment Technique Cost Allocation Method Used Infographics PDF to provide visual cues and insights. Share and navigate important information on one stage that need your due attention. This template can be used to pitch topics like Allocation Base, Allocated Cost, Allocation Base. In addtion, this PPT design contains high resolution images, graphics, etc, that are easily editable and available for immediate download.

Area Chart Ppt PowerPoint Presentation Infographics Good
This is a area chart ppt powerpoint presentation infographics good. This is a two stage process. The stages in this process are sales in percentage, product, area chart, business, percentage.
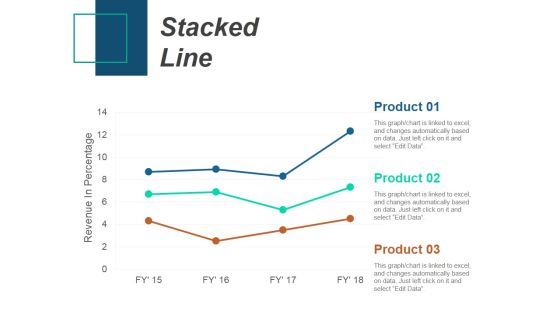
Stacked Line Ppt PowerPoint Presentation Infographics Slideshow
This is a stacked line ppt powerpoint presentation infographics slideshow. This is a three stage process. The stages in this process are stacked line, revenue in percentage, product.

Column Chart Ppt PowerPoint Presentation Infographics Model
This is a column chart ppt powerpoint presentation infographics model. This is a two stage process. The stages in this process are bar graph, growth, product, percentage, year.

Comparison Ppt PowerPoint Presentation Infographics Layout Ideas
This is a comparison ppt powerpoint presentation infographics layout ideas. This is a two stage process. The stages in this process are female, male, finance, percentage, compare.

Bubble Ppt PowerPoint Presentation Infographics Example
This is a bubble ppt powerpoint presentation infographics example. This is a eight stage process. The stages in this process are business, marketing, bubbles, finance, percentage.
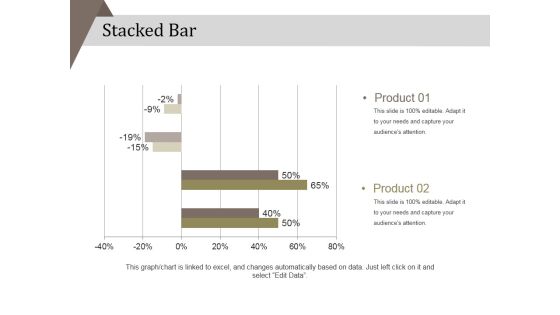
Stacked Bar Ppt PowerPoint Presentation Infographics Inspiration
This is a stacked bar ppt powerpoint presentation infographics inspiration. This is a two stage process. The stages in this process are product, percentage, finance, business, marketing.

Comparison Ppt PowerPoint Presentation Infographics Graphic Tips
This is a comparison ppt powerpoint presentation infographics graphic tips. This is a two stage process. The stages in this process are male, business, marketing, female, percentage, comparison.

Comparison Ppt PowerPoint Presentation Infographics Pictures
This is a comparison ppt powerpoint presentation infographics pictures. This is a two stage process. The stages in this process are female, business, marketing, male, percentage.
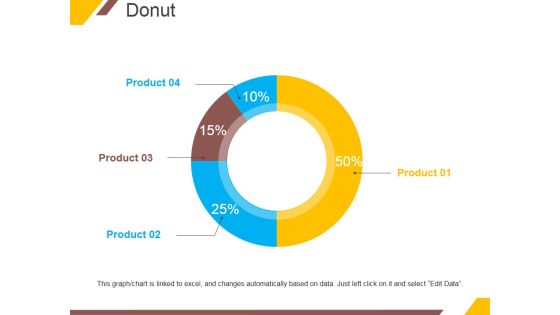
Donut Ppt PowerPoint Presentation Infographics Ideas
This is a donut ppt powerpoint presentation infographics ideas. This is a four stage process. The stages in this process are product, percentage, finance, donut, business.

Pie Chart Ppt PowerPoint Presentation Infographics Templates
This is a pie chart ppt powerpoint presentation infographics templates. This is a five stage process. The stages in this process are business, percentage, management, process.

Dashboard Ppt PowerPoint Presentation Infographics Tips
This is a dashboard ppt powerpoint presentation infographics tips. This is a three stage process. The stages in this process are low, medium, high, dashboard, business, percentage.

Stacked Line Ppt PowerPoint Presentation Infographics Tips
This is a stacked line ppt powerpoint presentation infographics tips. This is a three stage process. The stages in this process are product, business, percentage, finance.

Brand Distribution Ppt PowerPoint Presentation Infographics Clipart
This is a brand distribution ppt powerpoint presentation infographics clipart. This is a six stage process. The stages in this process are distribution, percentage, business, management, location.
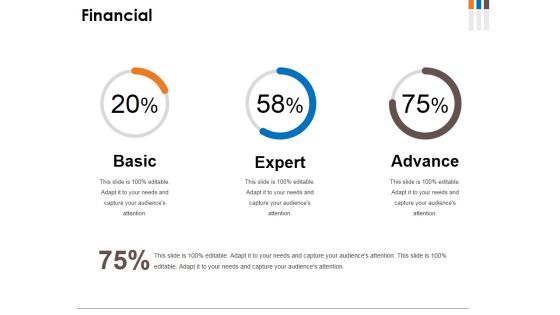
Financial Ppt PowerPoint Presentation Infographics Portfolio
This is a financial ppt powerpoint presentation infographics portfolio. This is a three stage process. The stages in this process are basic, expert, advance, percentage, finance.
 Home
Home