Percentage Infographic

Line Chart Ppt PowerPoint Presentation Infographics Graphic Images
This is a line chart ppt powerpoint presentation infographics graphic images. This is a two stage process. The stages in this process are sales in percentage, financial years, growth, business, marketing.

Stock Chart Management Investment Ppt PowerPoint Presentation Infographics Professional
This is a stock chart management investment ppt powerpoint presentation infographics professional. This is a two stage process. The stages in this process are marketing, business, management, percentage, product.
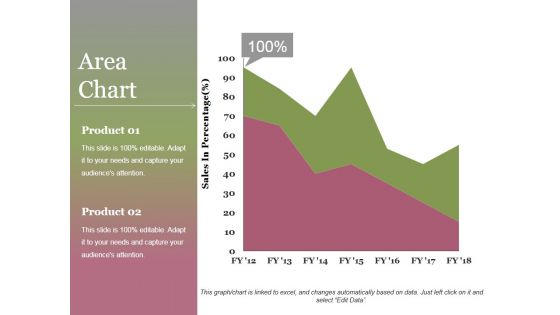
Area Chart Ppt PowerPoint Presentation Infographics File Formats
This is a area chart ppt powerpoint presentation infographics file formats. This is a two stage process. The stages in this process are area chart, product, sales in percentage, growth, success.

Bar Chart Ppt PowerPoint Presentation Infographics Format Ideas
This is a bar chart ppt powerpoint presentation infographics format ideas. This is a two stage process. The stages in this process are bar graph, product, financial year, sales in percentage.

Area Chart Ppt PowerPoint Presentation Infographics Visual Aids
This is a area chart ppt powerpoint presentation infographics visual aids. This is a two stage process. The stages in this process are product, area chart, in percentage, growth, success.

Scatter Line Ppt PowerPoint Presentation Infographics Background Images
This is a scatter line ppt powerpoint presentation infographics background images. This is a one stage process. The stages in this process are dollar in millions, product, sales in percentage.
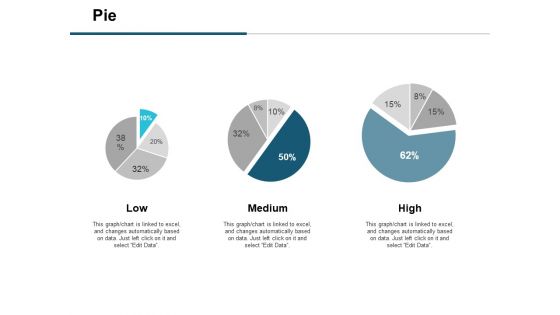
Pie Financial Ppt PowerPoint Presentation Infographics Master Slide
This is a pie financial ppt powerpoint presentation infographics master slide. This is a three stage process. The stages in this process are business strategy, marketing, management, percentage, pie, financial.
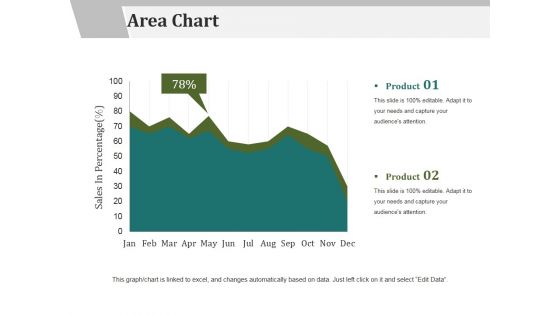
Area Chart Ppt PowerPoint Presentation Infographics Graphics Tutorials
This is a area chart ppt powerpoint presentation infographics graphics tutorials. This is a two stage process. The stages in this process are product, area chart, sales in percentage.
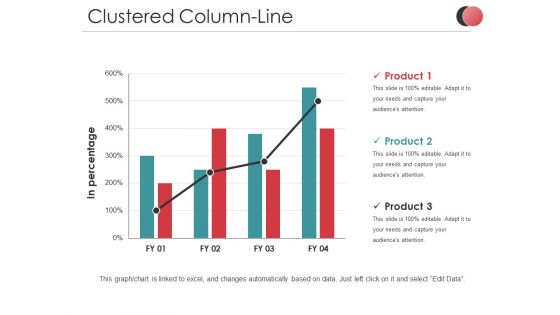
Clustered Column Line Ppt PowerPoint Presentation Infographics Templates
This is a clustered column line ppt powerpoint presentation infographics templates. This is a three stage process. The stages in this process are in percentage, business, marketing, product, finance, graph.
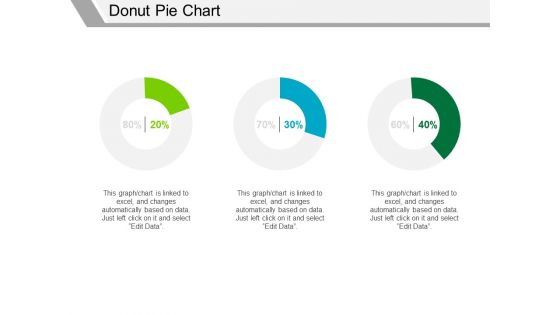
Donut Pie Chart Ppt PowerPoint Presentation Infographics Background Designs
This is a donut pie chart ppt powerpoint presentation infographics background designs. This is a three stage process. The stages in this process are finance, business, marketing, strategy, percentage.
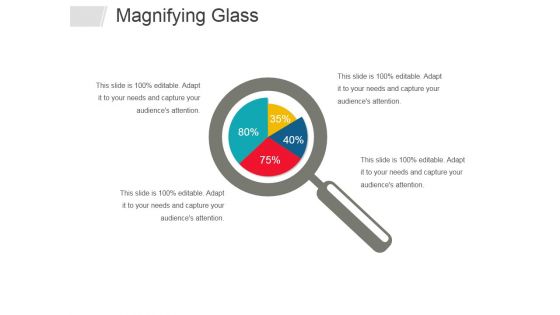
Magnifying Glass Ppt PowerPoint Presentation Infographics Slide Portrait
This is a magnifying glass ppt powerpoint presentation infographics slide portrait. This is a four stage process. The stages in this process are magnifying glass, management, marketing, business, percentage.

Stacked Bar Template 2 Ppt PowerPoint Presentation Infographics Graphics Design
This is a stacked bar template 2 ppt powerpoint presentation infographics graphics design. This is a two stage process. The stages in this process are percentage, business, marketing, finance.
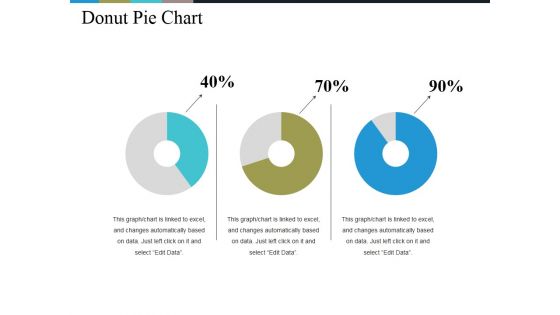
Donut Pie Chart Ppt PowerPoint Presentation Infographics Background Images
This is a donut pie chart ppt powerpoint presentation infographics background images. This is a three stage process. The stages in this process are chart, percentage, business, management, process.

Area Chart Ppt PowerPoint Presentation Infographics Graphics Pictures
This is a area chart ppt powerpoint presentation infographics graphics pictures. This is a two stage process. The stages in this process are business, sales in percentage, area chart, marketing, graph.

Control Charts Sample Value Ppt PowerPoint Presentation Infographics Demonstration
This is a control charts sample value ppt powerpoint presentation infographics demonstration. This is a five stage process. The stages in this process are product, percentage, marketing, business, management.

Pie Capability Maturity Matrix Ppt PowerPoint Presentation Infographics Visual Aids
This is a pie capability maturity matrix ppt powerpoint presentation infographics visual aids. This is a three stage process. The stages in this process are pie, low, medium, high, percentage.

Stacked Area Clustered Column Ppt PowerPoint Presentation Infographics Portrait
This is a stacked area clustered column ppt powerpoint presentation infographics portrait. This is a three stage process. The stages in this process are percentage, product, business, management, marketing.

Cost Performance Index Ppt PowerPoint Presentation Infographics Mockup
This is a cost performance index ppt powerpoint presentation infographics mockup. This is a three stage process. The stages in this process are finance, marketing, management, investment, product, percentage.

Checklist For Transition Project Information Technology Change Implementation Plan Infographics PDF
The following slide illustrates the checklist of key tasks of the transition project. It also provides information about the task priority and percentage of its completion. Deliver and pitch your topic in the best possible manner with this Checklist For Transition Project Information Technology Change Implementation Plan Infographics PDF. Use them to share invaluable insights on Status, Priority, Complete and impress your audience. This template can be altered and modified as per your expectations. So, grab it now.
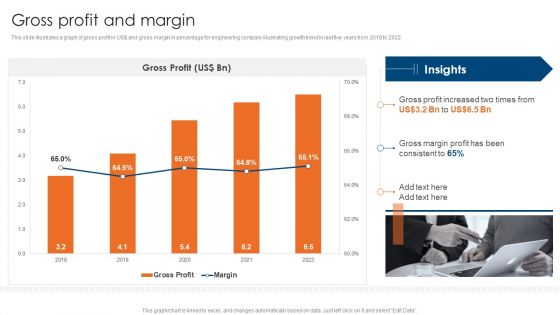
Engineering Consultancy Works Company Profile Gross Profit And Margin Infographics PDF
This slide illustrates a graph of gross profit in US doller and gross margin in percentage for engineering company illustrating growth trend in last five years from 2018 to 2022. Deliver an awe inspiring pitch with this creative Engineering Consultancy Works Company Profile Gross Profit And Margin Infographics PDF bundle. Topics like Gross Profit, Margin can be discussed with this completely editable template. It is available for immediate download depending on the needs and requirements of the user.
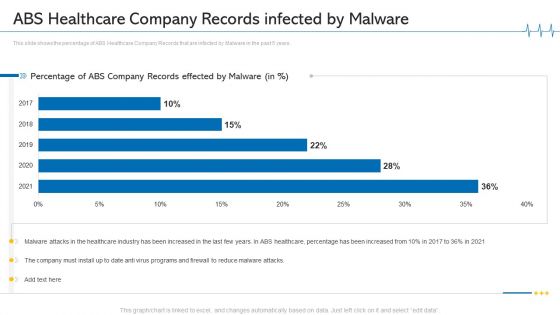
ABS Healthcare Company Records Infected By Malware Ppt File Infographics PDF
This slide shows the percentage of ABS Healthcare Company Records that are infected by Malware in the past 5 years. Deliver an awe inspiring pitch with this creative ABS healthcare company records infected by malware ppt file infographics pdf bundle. Topics like ABS healthcare company records infected by malware, 2017 to 2021 can be discussed with this completely editable template. It is available for immediate download depending on the needs and requirements of the user.
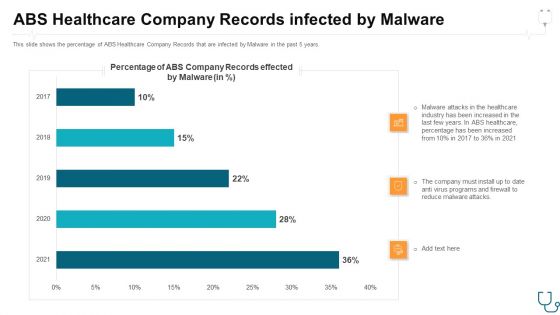
Abs Healthcare Company Records Infected By Malware Ppt Infographics Rules PDF
This slide shows the percentage of ABS Healthcare Company Records that are infected by Malware in the past 5 years. Deliver an awe-inspiring pitch with this creative abs healthcare company records infected by malware ppt infographics rules pdf. bundle. Topics like abs healthcare company records infected by malware can be discussed with this completely editable template. It is available for immediate download depending on the needs and requirements of the user.

Cloud Based Service Models Infrastructure As A Service Iaas Infographics PDF
This slide represents the market rate of cloud computing, and it is showing the percentage of users who are using public cloud, private cloud, and hybrid cloud services.Deliver and pitch your topic in the best possible manner with this Cloud Based Service Models Infrastructure As A Service Iaas Infographics PDF. Use them to share invaluable insights on Cloud Services, Private Cloud, Private And Public and impress your audience. This template can be altered and modified as per your expectations. So, grab it now.
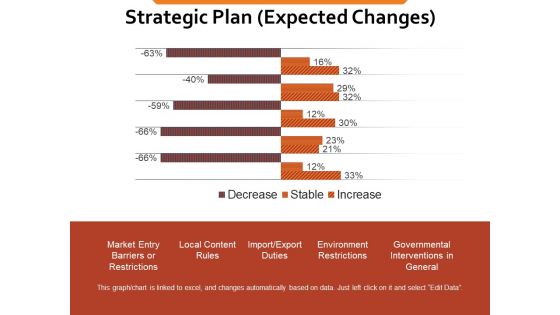
Strategic Plan Expected Changes Ppt PowerPoint Presentation Infographics Template
This is a strategic plan expected changes ppt powerpoint presentation infographics template. This is a two stage process. The stages in this process are market entry barriers or restrictions, local content rules, import export duties, environment restrictions, governmental interventions in general, percentage.

Dashboard For Successful FSM System Ppt Visual Aids Infographics PDF
Showcasing this set of slides titled dashboard for successful fsm system ppt visual aids infographics pdf. The topics addressed in these templates are resource percentage, duration compliance, priority. All the content presented in this PPT design is completely editable. Download it and make adjustments in color, background, font etc. as per your unique business setting.
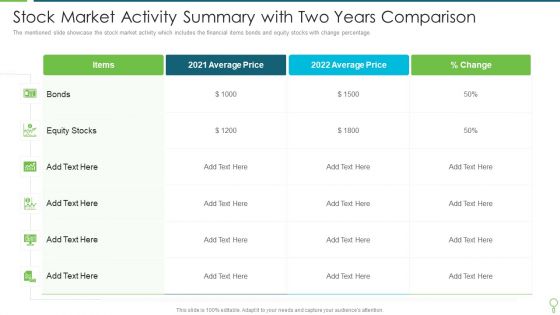
Stock Market Activity Summary With Two Years Comparison Infographics PDF
The mentioned slide showcase the stock market activity which includes the financial items bonds and equity stocks with change percentage. Pitch your topic with ease and precision using this Stock Market Activity Summary With Two Years Comparison Infographics PDF. This layout presents information on Average, Price, Equity Stocks. It is also available for immediate download and adjustment. So, changes can be made in the color, design, graphics or any other component to create a unique layout.

Domestic Market Share By Company And Product Sales Infographics PDF
This slide shows the domestic market share by company as well as by product. Product 2 is the most selling among other products with a share of 34 percentage. Deliver an awe inspiring pitch with this creative domestic market share by company and product sales infographics pdf bundle. Topics like domestic market share by company and product can be discussed with this completely editable template. It is available for immediate download depending on the needs and requirements of the user.

Shareholder Structure Of The Company With Details Infographics PDF
This slide shows companys Shareholder structure with shareholder names and their respective percentages. Deliver an awe inspiring pitch with this creative shareholder structure of the company with details infographics pdf bundle. Topics like institutional investors, livestock companies, state farm investors, mutual fund holders, agri business investors can be discussed with this completely editable template. It is available for immediate download depending on the needs and requirements of the user.

Key Phases Of Change Management Protocols Ppt Infographics Deck Pdf
This slide shows essential phases of change control procedure that can be considered for smooth implementation of planned change in organization. It include change management phases such as involvement, task implementation and process optimization, etc. Showcasing this set of slides titled Key Phases Of Change Management Protocols Ppt Infographics Deck Pdf. The topics addressed in these templates are Involvement, Task Implementation, Process Optimization. All the content presented in this PPT design is completely editable. Download it and make adjustments in color, background, font etc. as per your unique business setting.

Project Task List Template 1 Ppt PowerPoint Presentation Infographics Portrait
This is a project task list template 1 ppt powerpoint presentation infographics portrait. This is a three stage process. The stages in this process are priority, start, plan end, actual end, complete, incomplete.

Impact Effort Task Prioritization Matrix Ppt PowerPoint Presentation Infographics Show
This is a impact effort task prioritization matrix ppt powerpoint presentation infographics show. The topics discussed in this diagram are priority matrix, responsibility matrix, action matrix. This is a completely editable PowerPoint presentation, and is available for immediate download.
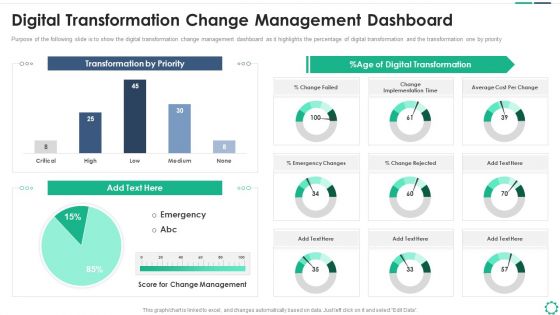
Digitalization Plan For Business Modernization Digital Transformation Change Management Dashboard Infographics PDF
Purpose of the following slide is to show the digital transformation change management dashboard as it highlights the percentage of digital transformation and the transformation one by priority. Deliver and pitch your topic in the best possible manner with this digitalization plan for business modernization digital transformation change management dashboard infographics pdf. Use them to share invaluable insights on transformation by priority, percent age of digital transformation and impress your audience. This template can be altered and modified as per your expectations. So, grab it now.

Problem And Solution 4 Decrease In Customer Loyalty Level Infographics PDF
This slide shows the problem that the company is facing related to decrease in the percentage of Customer Loyalty as a result of Declining Customer Retention Rate of the Company. The solution is to provide additional value and offers to the customers in order to gain competitive edge.Deliver an awe-inspiring pitch with this creative problem and solution 4 decrease in customer loyalty level infographics pdf. bundle. Topics like customer engagement index, 2017 to 2021 can be discussed with this completely editable template. It is available for immediate download depending on the needs and requirements of the user.

Stock Inventory Acquisition Issues With Current Inventory Management System Infographics PDF
This slide showcases issues faced by organization due to inefficient inventory management process. It shows increase in inventory shrinkage percentage and cost of carrying inventory. Slidegeeks is one of the best resources for PowerPoint templates. You can download easily and regulate Stock Inventory Acquisition Issues With Current Inventory Management System Infographics PDF for your personal presentations from our wonderful collection. A few clicks is all it takes to discover and get the most relevant and appropriate templates. Use our Templates to add a unique zing and appeal to your presentation and meetings. All the slides are easy to edit and you can use them even for advertisement purposes.

Customer Behavior Analytics Dashboard To Improve Satisfaction Ppt File Infographics PDF
The following slide provides an insight of websites performance that includes date parameters. The dashboard includes sessions, users, pageviews, bounce rate and percentage of new sessions. Pitch your topic with ease and precision using this Customer Behavior Analytics Dashboard To Improve Satisfaction Ppt File Infographics PDF. This layout presents information on Session, Avg Session Duration, Bounce Rate. It is also available for immediate download and adjustment. So, changes can be made in the color, design, graphics or any other component to create a unique layout.
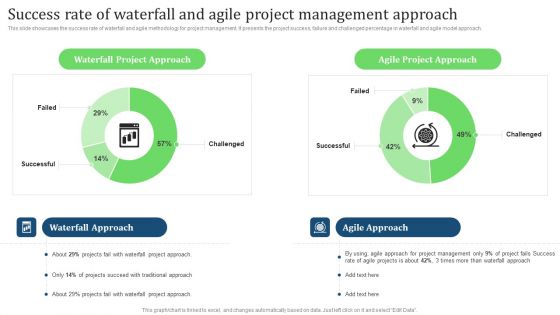
Success Rate Of Waterfall And Agile Project Management Approach Infographics PDF
This slide showcases the success rate of waterfall and agile methodology for project management. It presents the project success, failure and challenged percentage in waterfall and agile model approach. If your project calls for a presentation, then Slidegeeks is your go-to partner because we have professionally designed, easy-to-edit templates that are perfect for any presentation. After downloading, you can easily edit Success Rate Of Waterfall And Agile Project Management Approach Infographics PDF and make the changes accordingly. You can rearrange slides or fill them with different images. Check out all the handy templates
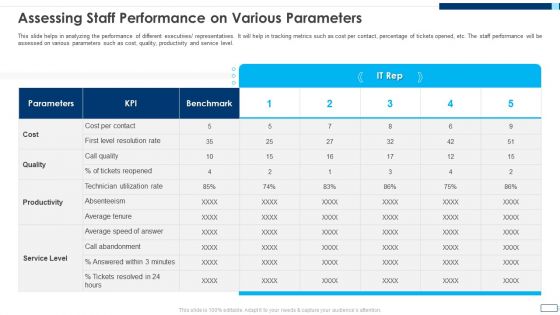
Evolving BI Infrastructure Assessing Staff Performance On Various Parameters Infographics PDF
This slide helps in analyzing the performance of different executives or representatives. It will help in tracking metrics such as cost per contact, percentage of tickets opened, etc. The staff performance will be assessed on various parameters such as cost, quality, productivity and service level. Deliver an awe inspiring pitch with this creative evolving bi infrastructure assessing staff performance on various parameters infographics pdf bundle. Topics like cost, quality, productivity, service level, parameters can be discussed with this completely editable template. It is available for immediate download depending on the needs and requirements of the user.

Customer Support Services Company Profile Integrated Performance Of The Company Infographics PDF
This slide highlights the integrated performance of call center which covers different elements such as jobs created, percentage of women, renewable energy consumption, employees trained on data security and code of conduct Presenting Customer Support Services Company Profile Integrated Performance Of The Company Infographics PDF to provide visual cues and insights. Share and navigate important information on one stages that need your due attention. This template can be used to pitch topics like Technology, Analytics Experts, Data Security. In addtion, this PPT design contains high resolution images, graphics, etc, that are easily editable and available for immediate download.
Annual Employee Attrition Tracking Report With Separation And Appointment Rates Infographics PDF
This slide covers summary report of employees separation rates with reasons. It also includes total appointments including transfers and promotion rates with percentage for cumulative turnover. Showcasing this set of slides titled Annual Employee Attrition Tracking Report With Separation And Appointment Rates Infographics PDF. The topics addressed in these templates are Organizational, Separation And Appointment Rates, Employee Attrition. All the content presented in this PPT design is completely editable. Download it and make adjustments in color, background, font etc. as per your unique business setting.
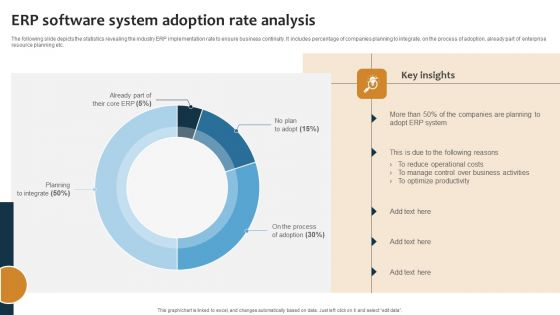
Improving Business Procedures Enterprise Resource Planning System ERP Software System Adoption Rate Infographics PDF
The following slide depicts the statistics revealing the industry ERP implementation rate to ensure business continuity. It includes percentage of companies planning to integrate, on the process of adoption, already part of enterprise resource planning etc. Make sure to capture your audiences attention in your business displays with our gratis customizable Improving Business Procedures Enterprise Resource Planning System ERP Software System Adoption Rate Infographics PDF. These are great for business strategies, office conferences, capital raising or task suggestions. If you desire to acquire more customers for your tech business and ensure they stay satisfied, create your own sales presentation with these plain slides.
Marketers Guide To Data Analysis Optimization Tracking Unsubscribe Rate For Improving Email Content Infographics PDF
This slide covers an overview of the unsubscribe rate to identify the percentage of recipients that opt out of the mailing list. It also includes strategies to reduce unsubscribe rates, such as creating an optimized list, using automation, etc. From laying roadmaps to briefing everything in detail, our templates are perfect for you. You can set the stage with your presentation slides. All you have to do is download these easy to edit and customizable templates. Marketers Guide To Data Analysis Optimization Tracking Unsubscribe Rate For Improving Email Content Infographics PDF will help you deliver an outstanding performance that everyone would remember and praise you for. Do download this presentation today.

Major Players Of Global Workflow Automation Market Ppt Infographics Design Templates PDF
This slide showcases the comparison of market share percentage among the major player of workflow automation market. It includes companies such as IBM, oracle, Ipsoft, Bizagi, newgen software technology, etc. Take your projects to the next level with our ultimate collection of Major Players Of Global Workflow Automation Market Ppt Infographics Design Templates PDF. Slidegeeks has designed a range of layouts that are perfect for representing task or activity duration, keeping track of all your deadlines at a glance. Tailor these designs to your exact needs and give them a truly corporate look with your own brand colors they will make your projects stand out from the rest.

Shareholding Pattern Pet Care Company Investor Funding Elevator Pitch Deck Infographics Pdf
The slide highlights the company ownership structure highlighting percentage of shareholders. Shareholders consists of venture capitalists, founder, employees and investors. Make sure to capture your audiences attention in your business displays with our gratis customizable Shareholding Pattern Pet Care Company Investor Funding Elevator Pitch Deck Infographics Pdf. These are great for business strategies, office conferences, capital raising or task suggestions. If you desire to acquire more customers for your tech business and ensure they stay satisfied, create your own sales presentation with these plain slides.

Project Capabilities Task Matrix Ppt Infographics File Formats PDF
Presenting this set of slides with name project capabilities task matrix ppt infographics file formats pdf. The topics discussed in these slides are main tasks, competencies, responsibilities. This is a completely editable PowerPoint presentation and is available for immediate download. Download now and impress your audience.

Organizational Event Management Weekly Timeline With Task Name Infographics PDF
Deliver an awe-inspiring pitch with this creative organizational event management weekly timeline with task name infographics pdf. bundle. Topics like weekly timeline with task name can be discussed with this completely editable template. It is available for immediate download depending on the needs and requirements of the user.
Employees Task Management Vector Icon Ppt Infographics Maker PDF
Presenting employees task management vector icon ppt infographics maker pdf to dispense important information. This template comprises three stages. It also presents valuable insights into the topics including employees task management vector icon. This is a completely customizable PowerPoint theme that can be put to use immediately. So, download it and address the topic impactfully.
Project Task Management With Time Monitoring Icon Infographics PDF
Presenting project task management with time monitoring icon infographics pdf to dispense important information. This template comprises four stages. It also presents valuable insights into the topics including project task management with time monitoring icon. This is a completely customizable PowerPoint theme that can be put to use immediately. So, download it and address the topic impactfully.

Duties And Tasks Of Information System Management Team Infographics PDF
Presenting duties and tasks of information system management team infographics pdf to dispense important information. This template comprises three stages. It also presents valuable insights into the topics including knowledge management database, preparation of documentation, training of employees. This is a completely customizable PowerPoint theme that can be put to use immediately. So, download it and address the topic impactfully.
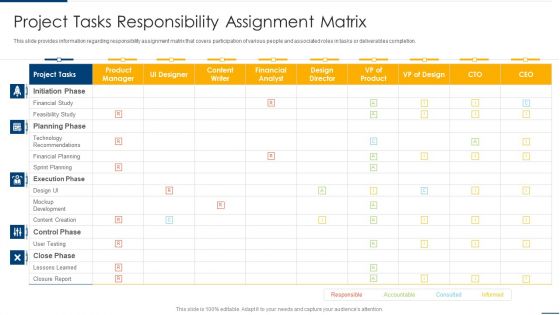
Project Organizing Playbook Project Tasks Responsibility Assignment Matrix Infographics PDF
This slide provides information regarding responsibility assignment matrix that covers participation of various people and associated roles in tasks or deliverables completion. Deliver an awe inspiring pitch with this creative project organizing playbook project tasks responsibility assignment matrix infographics pdf bundle. Topics like initiation phase, planning phase, execution phase can be discussed with this completely editable template. It is available for immediate download depending on the needs and requirements of the user.
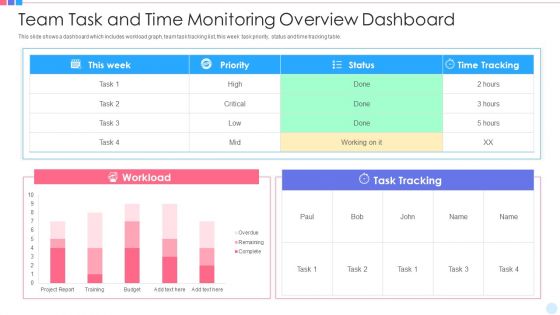
Team Task And Time Monitoring Overview Dashboard Infographics PDF
This slide shows a dashboard which includes workload graph, team task tracking list, this week task priority, status and time tracking table. Showcasing this set of slides titled team task and time monitoring overview dashboard infographics pdf. The topics addressed in these templates are team task and time monitoring overview dashboard. All the content presented in this PPT design is completely editable. Download it and make adjustments in color, background, font etc. as per your unique business setting.
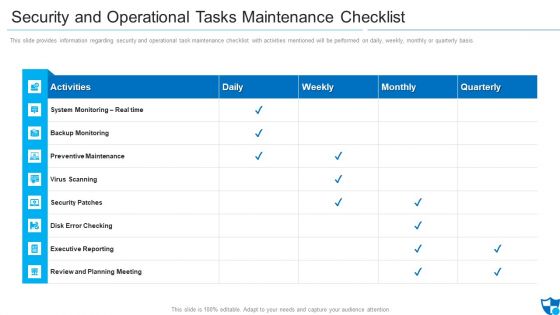
Security And Operational Tasks Maintenance Checklist Infographics PDF
This slide provides information regarding security and operational task maintenance checklist with activities mentioned will be performed on daily, weekly, monthly or quarterly basis.Deliver an awe inspiring pitch with this creative security and operational tasks maintenance checklist infographics pdf bundle. Topics like preventive maintenance, security patches, review and planning meeting can be discussed with this completely editable template. It is available for immediate download depending on the needs and requirements of the user.
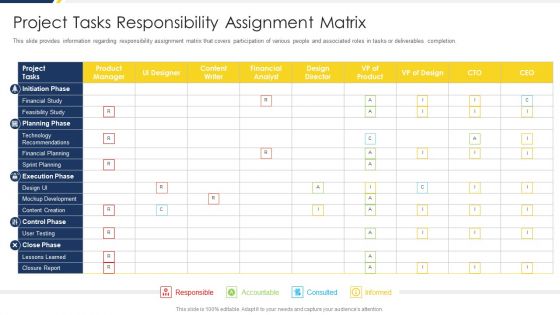
Project Management Development Project Tasks Responsibility Assignment Matrix Infographics PDF
This slide provides information regarding responsibility assignment matrix that covers participation of various people and associated roles in tasks or deliverables completion. Deliver and pitch your topic in the best possible manner with this Project Management Development Project Tasks Responsibility Assignment Matrix Infographics PDF. Use them to share invaluable insights on Product Manager, Financial Study, Technology Recommendations and impress your audience. This template can be altered and modified as per your expectations. So, grab it now.
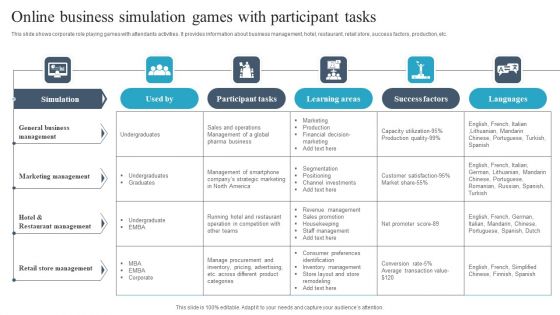
Online Business Simulation Games With Participant Tasks Infographics PDF
This slide shows corporate role playing games with attendants activities. It provides information about business management, hotel, restaurant, retail store, success factors, production, etc. Showcasing this set of slides titled Online Business Simulation Games With Participant Tasks Infographics PDF. The topics addressed in these templates are Simulation, Participant Tasks, Learning Areas, Success Factors. All the content presented in this PPT design is completely editable. Download it and make adjustments in color, background, font etc. as per your unique business setting.

Employee Separation Checklist With Tasks Status Infographics PDF
This slide contains the required tasks that has to be done before the separation of an employee from the company. It includes employee details , tasks and the date on which they are completed.Presenting Employee Separation Checklist With Tasks Status Infographics PDF to dispense important information. This template comprises one stage. It also presents valuable insights into the topics including Employee Experience, Required Department, Account Including This is a completely customizable PowerPoint theme that can be put to use immediately. So, download it and address the topic impactfully.

Task Management For Waterfall Project With Work Status Infographics PDF
This slide focuses on the task management for waterfall project which covers tasks name, status, scheduled start and finish date, duration and efforts, actual start and finish date with web interfacing, gathering requirements, completing documents, prototyping, purchasing, etc. Showcasing this set of slides titled Task Management For Waterfall Project With Work Status Infographics PDF. The topics addressed in these templates are Gathering Requirements, Service, Purchasing. All the content presented in this PPT design is completely editable. Download it and make adjustments in color, background, font etc. as per your unique business setting.
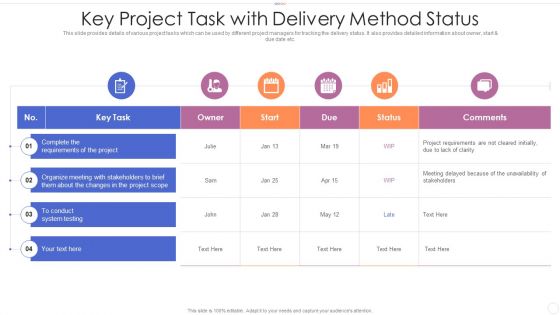
Key Project Task With Delivery Method Status Infographics PDF
This slide provides details of various project tasks which can be used by different project managers for tracking the delivery status. It also provides detailed information about owner, start and due date etc. Showcasing this set of slides titled key project task with delivery method status infographics pdf. The topics addressed in these templates are key project task with delivery method status. All the content presented in this PPT design is completely editable. Download it and make adjustments in color, background, font etc. as per your unique business setting.

Content Marketing Roadmap With Task Assignment Infographics PDF
This slide displays the roadmap which helps to ascertain the accountability of all activities involved in the process of content marketing. It also includes the various stages involved in the process such as ideation, content writing, editing, designing, and publishing. Presenting Content Marketing Roadmap With Task Assignment Infographics PDF to dispense important information. This template comprises one stage. It also presents valuable insights into the topics including Research Target Audience, Targeted Email Campaign, Feature Launch . This is a completely customizable PowerPoint theme that can be put to use immediately. So, download it and address the topic impactfully.
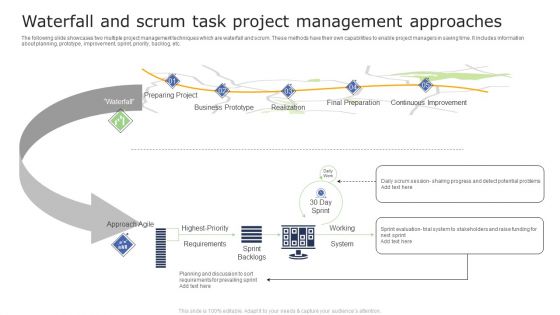
Waterfall And Scrum Task Project Management Approaches Infographics PDF
The following slide showcases two multiple project management techniques which are waterfall and scrum. These methods have their own capabilities to enable project managers in saving time. It includes information about planning, prototype, improvement, sprint, priority, backlog, etc. Showcasing this set of slides titled Waterfall And Scrum Task Project Management Approaches Infographics PDF. The topics addressed in these templates are Business Prototype, Preparing Project, Requirements. All the content presented in this PPT design is completely editable. Download it and make adjustments in color, background, font etc. as per your unique business setting.
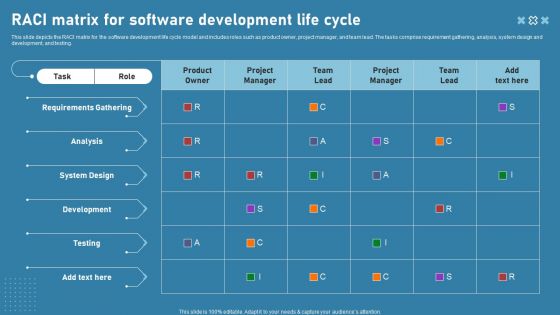
RACI Matrix For Software Development Life Cycle Infographics PDF
This slide depicts the RACI matrix for the software development life cycle model and includes roles such as product owner, project manager, and team lead. The tasks comprise requirement gathering, analysis, system design and development, and testing. Presenting this PowerPoint presentation, titled RACI Matrix For Software Development Life Cycle Infographics PDF, with topics curated by our researchers after extensive research. This editable presentation is available for immediate download and provides attractive features when used. Download now and captivate your audience. Presenting this RACI Matrix For Software Development Life Cycle Infographics PDF. Our researchers have carefully researched and created these slides with all aspects taken into consideration. This is a completely customizable RACI Matrix For Software Development Life Cycle Infographics PDF that is available for immediate downloading. Download now and make an impact on your audience. Highlight the attractive features available with our PPTs.

Action Plan Objectives Ppt PowerPoint Presentation Infographics Design Inspiration
Presenting this set of slides with name action plan objectives ppt powerpoint presentation infographics design inspiration. The topics discussed in these slides are objectives, tasks, success crieteria, time frame, resources. This is a completely editable PowerPoint presentation and is available for immediate download. Download now and impress your audience.

 Home
Home