Percentage Charts
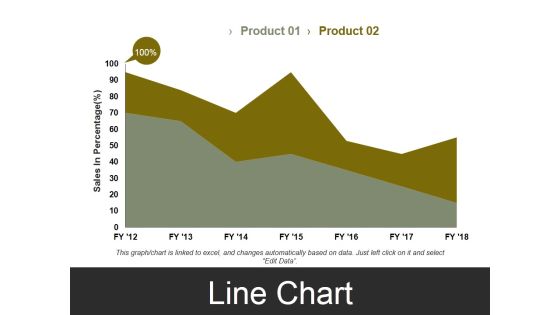
Line Chart Template 3 Ppt PowerPoint Presentation Styles Visual Aids
This is a line chart template 3 ppt powerpoint presentation styles visual aids. This is a two stage process. The stages in this process are sales in percentage, business, marketing, finance, graph.
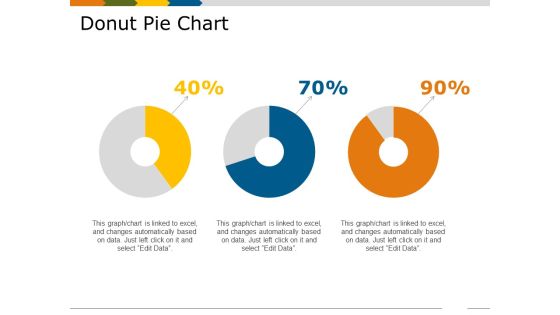
Donut Pie Chart Template 2 Ppt PowerPoint Presentation Show Skills
This is a donut pie chart template 2 ppt powerpoint presentation show skills. This is a three stage process. The stages in this process are percentage, business, marketing, process, finance.

Donut Pie Chart Ppt PowerPoint Presentation Infographic Template Slides
This is a donut pie chart ppt powerpoint presentation infographic template slides. This is a three stage process. The stages in this process are percentage, product, business, management, marketing.
Donut Pie Chart Ppt PowerPoint Presentation Icon Background Designs
This is a donut pie chart ppt powerpoint presentation icon background designs. This is a four stage process. The stages in this process are product, percentage, finance, donut, business.
Open High Low Close Chart Ppt PowerPoint Presentation Icon Portrait
This is a open high low close chart ppt powerpoint presentation icon portrait. This is a two stage process. The stages in this process are business, management, marketing, percentage, product.

High Low Close Chart Ppt PowerPoint Presentation Ideas Brochure
This is a high low close chart ppt powerpoint presentation ideas brochure. This is a three stage process. The stages in this process are in percentage, product, business, marketing, finance.
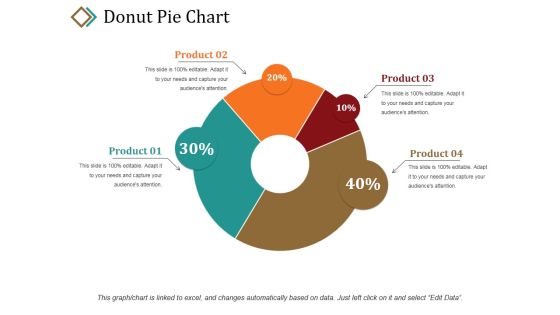
Donut Pie Chart Ppt PowerPoint Presentation Portfolio Graphic Tips
This is a donut pie chart ppt powerpoint presentation portfolio graphic tips. This is a four stage process. The stages in this process are product, percentage, business, marketing, donut.

Donut Pie Chart Ppt PowerPoint Presentation Professional Example File
This is a donut pie chart ppt powerpoint presentation professional example file. This is a four stage process. The stages in this process are percentage, finance, donut, business, process.

Clustered Column Chart Ppt PowerPoint Presentation Show Slideshow
This is a clustered column chart ppt powerpoint presentation show slideshow. This is a six stage process. The stages in this process are financial year in, sales in percentage, business, marketing, finance.
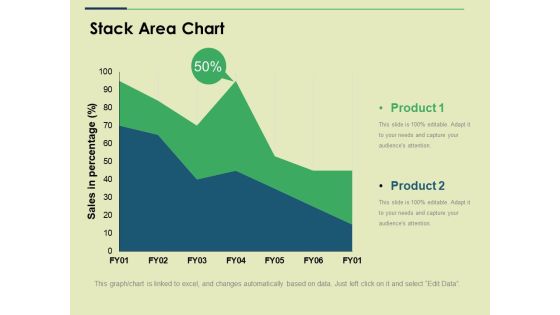
Stack Area Chart Ppt PowerPoint Presentation Show Slide
This is a stack area chart ppt powerpoint presentation show slide. This is a two stage process. The stages in this process are sales in percentage, business, marketing, strategy, graph.

Scatter Bubble Chart Ppt PowerPoint Presentation Gallery Show
This is a scatter bubble chart ppt powerpoint presentation gallery show. This is a two stage process. The stages in this process are profit, in percentage, finance, marketing, business.

Area Chart Ppt PowerPoint Presentation Portfolio Graphics Design
This is a area chart ppt powerpoint presentation portfolio graphics design. This is a two stage process. The stages in this process are business, marketing, in percentage, graph, finance.
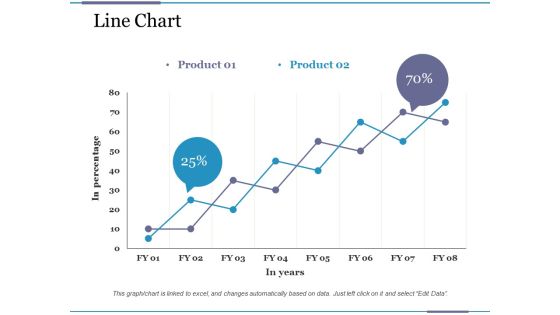
Line Chart Ppt PowerPoint Presentation Pictures File Formats
This is a line chart ppt powerpoint presentation pictures file formats. This is a two stage process. The stages in this process are business, financial, in percentage, in years, graph.

Donut Pie Chart Ppt PowerPoint Presentation Visual Aids Model
This is a donut pie chart ppt powerpoint presentation visual aids model. This is a four stage process. The stages in this process are product, percentage, finance, donut, business.

Combo Chart Ppt PowerPoint Presentation Gallery Design Ideas
This is a combo chart ppt powerpoint presentation gallery design ideas. This is a three stage process. The stages in this process are business, financial years, sales in percentage, finance, graph.

Donut Pie Chart Ppt PowerPoint Presentation Pictures Layout Ideas
This is a donut pie chart ppt powerpoint presentation pictures layout ideas. This is a four stage process. The stages in this process are percentage, finance, donut, business, product.

Area Chart Ppt PowerPoint Presentation Outline Graphics Pictures
This is a area chart ppt powerpoint presentation outline graphics pictures. This is a two stage process. The stages in this process are financial year, in percentage, business, marketing, finance.

Combo Chart Ppt PowerPoint Presentation Summary Background Images
This is a combo chart ppt powerpoint presentation summary background images. This is a two stage process. The stages in this process are business, marketing, financial year, in percentage, graph.

Area Chart Ppt PowerPoint Presentation Layouts Graphic Images
This is a area chart ppt powerpoint presentation layouts graphic images. This is a three stage process. The stages in this process are business, in years, marketing, in percentage, finance, graph.
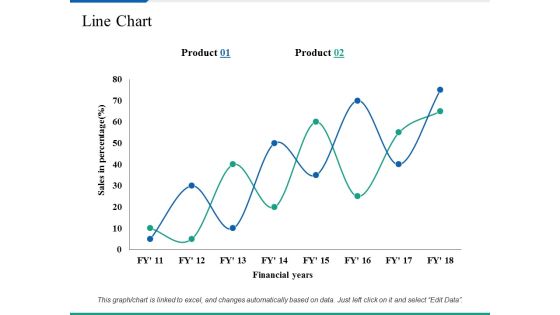
Line Chart Ppt PowerPoint Presentation Summary Clipart Images
This is a line chart ppt powerpoint presentation summary clipart images. This is a two stage process. The stages in this process are business, marketing, sales in percentage, financial years, strategy.

Clustered Column Chart Ppt PowerPoint Presentation Professional Ideas
This is a clustered column chart ppt powerpoint presentation professional ideas. This is a three stage process. The stages in this process are product, sales in percentage, column, years.
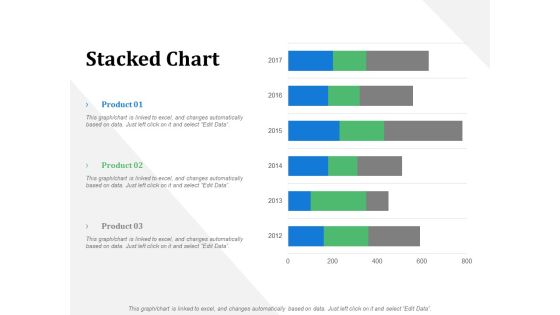
Stacked Chart Business Marketing Ppt PowerPoint Presentation File Design Ideas
This is a stacked chart business marketing ppt powerpoint presentation file design ideas. This is a three stage process. The stages in this process are business, management, marketing, product, percentage.

Donut Chart Marketing Product Ppt PowerPoint Presentation Slides Background Designs
This is a donut chart marketing product ppt powerpoint presentation slides background designs. This is a three stage process. The stages in this process are business, management, marketing, percentage, product.

Bubble Chart Product Ppt PowerPoint Presentation Inspiration Design Ideas
This is a bubble chart product ppt powerpoint presentation inspiration design ideas. This is a one stage process. The stages in this process are business, management, marketing, product, percentage.
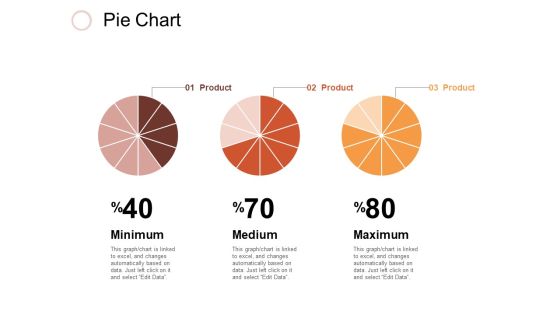
Pie Chart Investment Ppt PowerPoint Presentation Inspiration Design Inspiration
This is a pie chart investment ppt powerpoint presentation inspiration design inspiration. This is a three stage process. The stages in this process are business, management, marketing, percentage, product.

Column Chart Marketing Strategy Ppt PowerPoint Presentation Layouts Slide Portrait
This is a column chart marketing strategy ppt powerpoint presentation layouts slide portrait. This is a two stage process. The stages in this process are percentage, product, business, management, marketing.

Bar Chart Ppt PowerPoint Presentation Icon Design Templates
This is a bar chart ppt powerpoint presentation icon design templates. This is a nine stage process. The stages in this process are sales in percentage, bar graph, business, marketing, growth.

Scatter Chart Template 2 Ppt PowerPoint Presentation Styles Visual Aids
This is a scatter chart template 2 ppt powerpoint presentation styles visual aids. This is a two stage process. The stages in this process are product, business, marketing, in percentage, growth.

Area Chart Financial Ppt PowerPoint Presentation Outline Professional
This is a area chart financial ppt powerpoint presentation outline professional. This is a four stage process. The stages in this process are product, sales in percentage, financial year.

Clustered Column Line Chart Ppt PowerPoint Presentation File Pictures
This is a clustered column line chart ppt powerpoint presentation file pictures. This is a four stage process. The stages in this process are clustered bar, product, planning, business, sales in percentage.
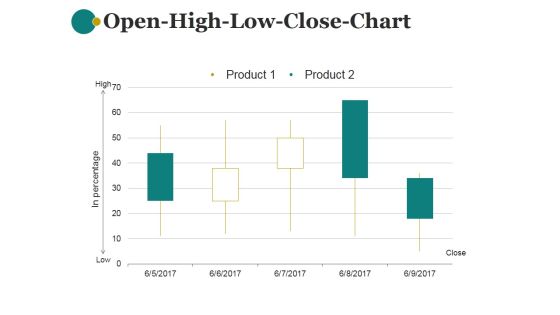
Open High Low Close Chart Ppt PowerPoint Presentation Information
This is a open high low close chart ppt powerpoint presentation information. This is a five stage process. The stages in this process are product, in percentage, close, low, high.

Combo Chart Ppt PowerPoint Presentation Infographic Template Graphic Images
This is a combo chart ppt powerpoint presentation infographic template graphic images. This is a three stage process. The stages in this process are market size, growth rate, percentage, business, marketing.

Scatter Chart Template 3 Ppt PowerPoint Presentation Styles Demonstration
This is a scatter chart template 3 ppt powerpoint presentation styles demonstration. This is a one stage process. The stages in this process are sales in percentage, finance, business, marketing, growth.

Column Chart Ppt PowerPoint Presentation Layouts Design Inspiration
This is a column chart ppt powerpoint presentation layouts design inspiration. This is a two stage process. The stages in this process are sales in percentage, financial year in, graph, business, finance, marketing.

Line Chart Ppt PowerPoint Presentation Layouts Background Image
This is a line chart ppt powerpoint presentation layouts background image. This is a two stage process. The stages in this process are in percentage, in years, product.

Column Chart Ppt PowerPoint Presentation Styles Background Image
This is a column chart ppt powerpoint presentation styles background image. This is a two stage process. The stages in this process are business, graph, percentage, marketing, strategy.

Combo Chart Product Ppt PowerPoint Presentation Ideas Styles
This is a combo chart product ppt powerpoint presentation ideas styles. This is a three stage process. The stages in this process are business, management, marketing, percentage, product.

Overall Revenue Analysis Bar Chart Powerpoint Slide Information
This is a overall revenue analysis bar chart powerpoint slide information. This is a nine stage process. The stages in this process are finance, success, business, marketing, percentage.
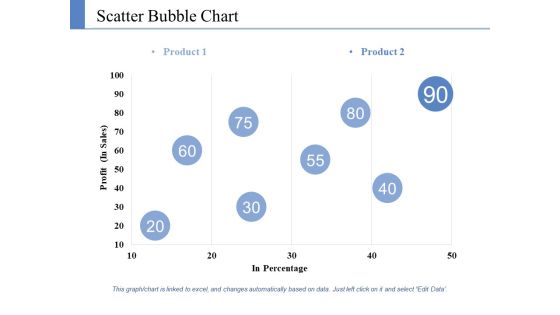
Scatter Bubble Chart Ppt PowerPoint Presentation Styles Information
This is a scatter bubble chart ppt powerpoint presentation styles information. This is a two stage process. The stages in this process are product, profit, in percentage.

Stacked Column Chart Ppt PowerPoint Presentation Professional Diagrams
This is a stacked column chart ppt powerpoint presentation professional diagrams. This is a three stage process. The stages in this process are percentage, product, management, marketing.
Donut Chart Ppt PowerPoint Presentation Icon Example Topics
This is a donut chart ppt powerpoint presentation icon example topics. This is a six stage process. The stages in this process are management, process, business, percentage.
Scatter Chart Ppt PowerPoint Presentation Icon Background Images
This is a scatter chart ppt powerpoint presentation icon background images. This is a one stage process. The stages in this process are percentage, product, business, marketing, management.

Donut Pie Chart Ppt PowerPoint Presentation Inspiration Templates
This is a donut pie chart ppt powerpoint presentation inspiration templates. This is a four stage process. The stages in this process are icon, percentage, business, marketing, management.
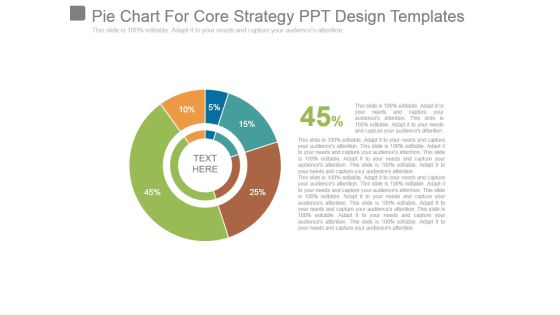
Pie Chart For Core Strategy Ppt Design Templates
This is a pie chart for core strategy ppt design templates. This is a five stage process. The stages in this process are business, marketing, strategy, finance, percentage.

Pie Chart For Result Analysis Ppt Example File
This is a pie chart for result analysis ppt example file. This is a seven stage process. The stages in this process are pie, marketing, strategy, finance, percentage.
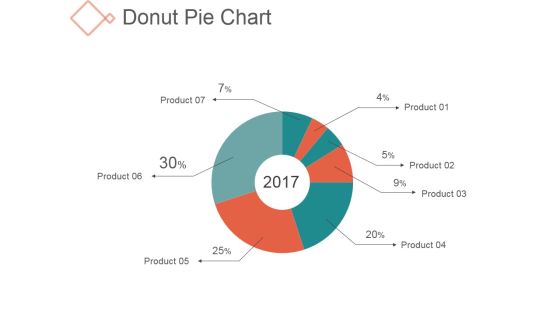
Donut Pie Chart Ppt PowerPoint Presentation Background Images
This is a donut pie chart ppt powerpoint presentation background images. This is a seven stage process. The stages in this process are management, business, finance, percentage.

Bar Chart Ppt PowerPoint Presentation Infographic Template Example
This is a bar chart ppt powerpoint presentation infographic template example. This is a seven stage process. The stages in this process are business, finance, marketing, percentage.

Daunt Pie Chart Ppt PowerPoint Presentation Layouts Portrait
This is a daunt pie chart ppt powerpoint presentation layouts portrait. This is a three stage process. The stages in this process are percentage, finance, donut, business.

Donut Pie Chart Ppt PowerPoint Presentation Outline Graphics Example
This is a donut pie chart ppt powerpoint presentation outline graphics example. This is a five stage process. The stages in this process are percentage, finance, donut, business.

Doughnut Chart Ppt PowerPoint Presentation Visual Aids Files
This is a doughnut chart ppt powerpoint presentation visual aids files. This is a three stage process. The stages in this process are finance, donut, percentage, business, marketing.

Radar Chart Ppt PowerPoint Presentation Portfolio Design Inspiration
This is a radar chart ppt powerpoint presentation portfolio design inspiration. This is a two stage process. The stages in this process are product, percentage, business, marketing, finance.
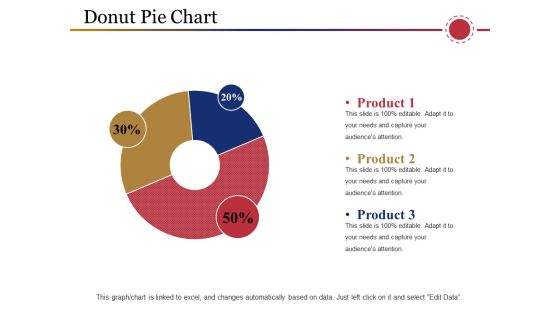
Donut Pie Chart Ppt PowerPoint Presentation Show Ideas
This is a donut pie chart ppt powerpoint presentation show ideas. This is a three stage process. The stages in this process are product, business, process, percentage, management.

Donut Pie Chart Ppt PowerPoint Presentation Show Topics
This is a donut pie chart ppt powerpoint presentation show topics. This is a three stage process. The stages in this process are percentage, finance, donut, business.
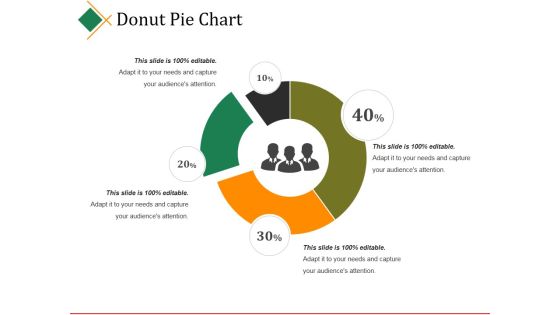
Donut Pie Chart Ppt PowerPoint Presentation Outline Microsoft
This is a donut pie chart ppt powerpoint presentation outline microsoft. This is a four stage process. The stages in this process are percentage, finance, donut, business.

Area Chart Ppt PowerPoint Presentation Model Example Topics
This is a area chart ppt powerpoint presentation model example topics. This is a two stage process. The stages in this process are product, percentage, business, marketing, finance.
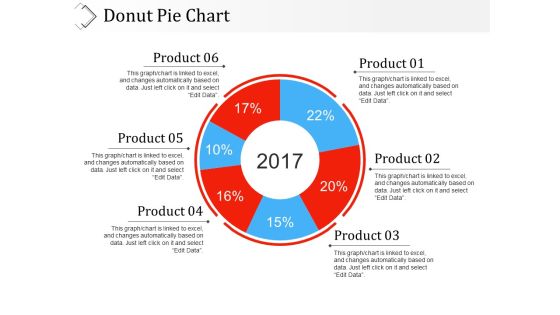
Donut Pie Chart Ppt PowerPoint Presentation Professional Slideshow
This is a donut pie chart ppt powerpoint presentation professional slideshow. This is a six stage process. The stages in this process are product, percentage, years, business, process.

Donut Pie Chart Ppt PowerPoint Presentation File Mockup
This is a donut pie chart ppt powerpoint presentation file mockup. This is a three stage process. The stages in this process are finance, business, percentage, marketing.
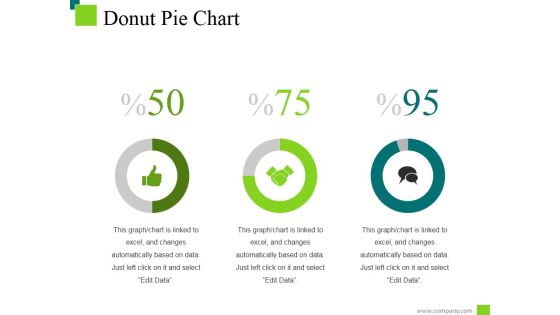
Donut Pie Chart Ppt PowerPoint Presentation Inspiration Deck
This is a donut pie chart ppt powerpoint presentation inspiration deck. This is a three stage process. The stages in this process are percentage, finance, donut, business.
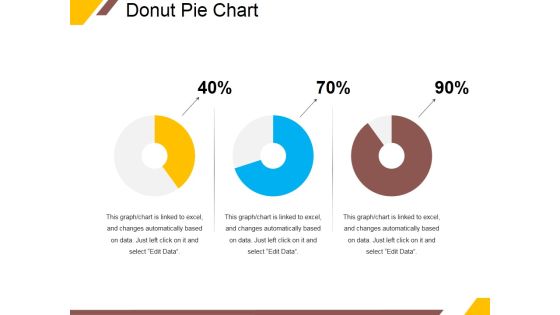
Donut Pie Chart Ppt PowerPoint Presentation Ideas Portrait
This is a donut pie chart ppt powerpoint presentation ideas portrait. This is a three stage process. The stages in this process are percentage, finance, donut, business.
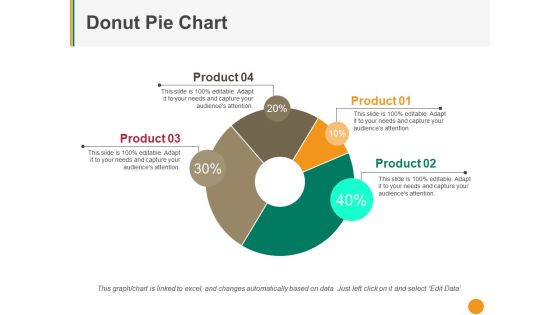
Donut Pie Chart Ppt PowerPoint Presentation Pictures Background
This is a donut pie chart ppt powerpoint presentation pictures background. This is a four stage process. The stages in this process are product, percentage, business, management, process.

Donut Pie Chart Ppt PowerPoint Presentation Slides Outfit
This is a donut pie chart ppt powerpoint presentation slides outfit. This is a three stage process. The stages in this process are product, percentage, business, process, management.
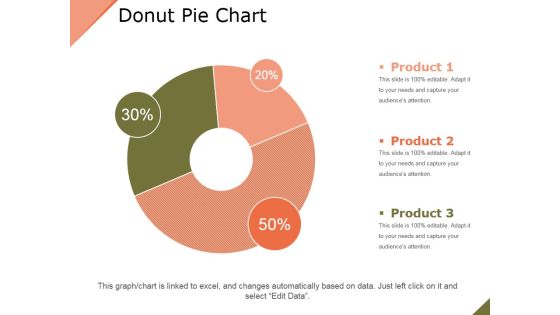
Donut Pie Chart Ppt PowerPoint Presentation Layouts Outfit
This is a donut pie chart ppt powerpoint presentation layouts outfit. This is a three stage process. The stages in this process are product, business, percentage, finance, marketing.
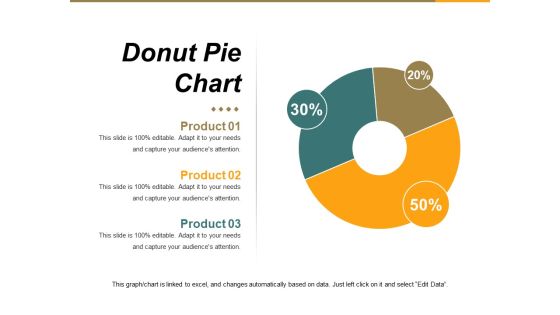
Donut Pie Chart Ppt PowerPoint Presentation Portfolio Background
This is a donut pie chart ppt powerpoint presentation portfolio background. This is a three stage process. The stages in this process are percentage, business, marketing, process.

Donut Pie Chart Ppt PowerPoint Presentation Model Pictures
This is a donut pie chart ppt powerpoint presentation model pictures. This is a six stage process. The stages in this process are product, percentage, finance, year, business.
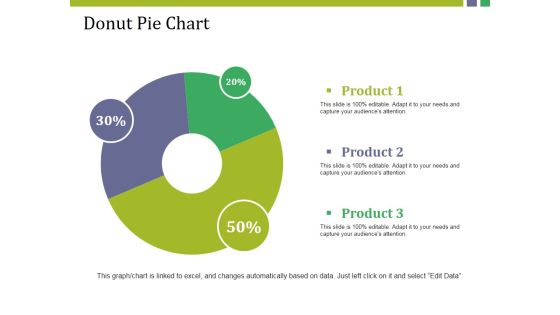
Donut Pie Chart Ppt PowerPoint Presentation Model Show
This is a donut pie chart ppt powerpoint presentation model show. This is a three stage process. The stages in this process are product, donut, percentage, finance, business.
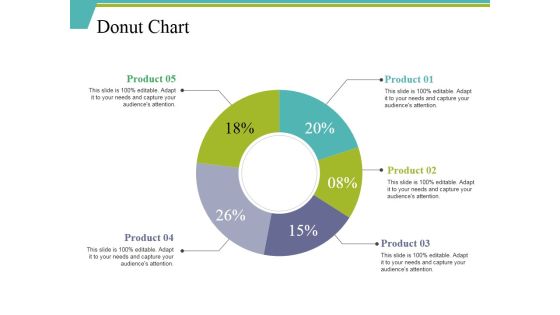
Donut Chart Ppt PowerPoint Presentation Ideas Background Designs
This is a donut chart ppt powerpoint presentation ideas background designs. This is a five stage process. The stages in this process are percentage, finance, donut, business, product.
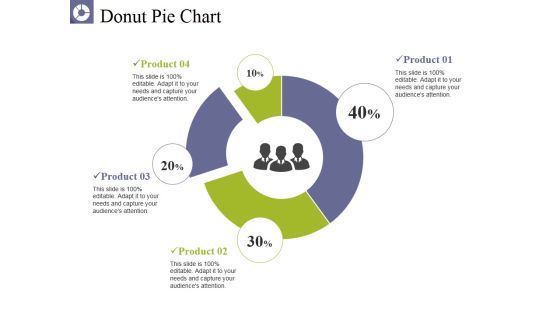
Donut Pie Chart Ppt PowerPoint Presentation Pictures Graphics
This is a donut pie chart ppt powerpoint presentation pictures graphics. This is a four stage process. The stages in this process are product, business, percentage, donut, finance.
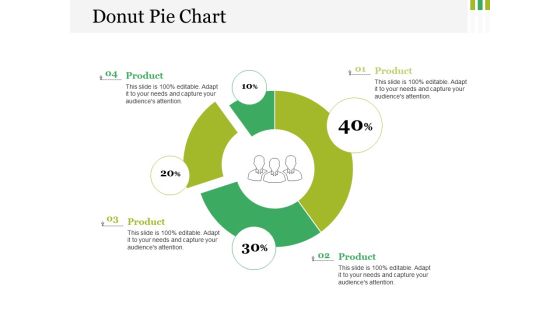
Donut Pie Chart Ppt PowerPoint Presentation Styles Clipart
This is a donut pie chart ppt powerpoint presentation styles clipart. This is a four stage process. The stages in this process are business, marketing, management, circular, percentage.

Donut Pie Chart Ppt PowerPoint Presentation Outline Mockup
This is a donut pie chart ppt powerpoint presentation outline mockup. This is a four stage process. The stages in this process are product, donut, percentage, finance, business.
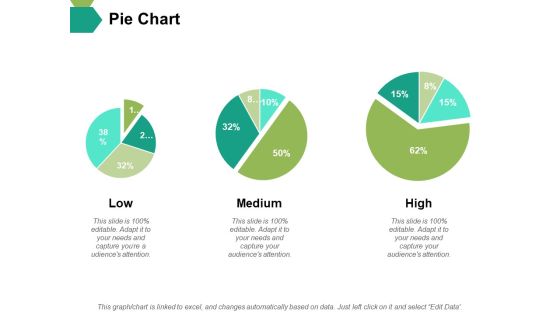
Pie Chart Ppt PowerPoint Presentation Slides Master Slide
This is a pie chart ppt powerpoint presentation slides master slide. This is a three stage process. The stages in this process are pie, process, percentage, finance, business.

Column Chart Ppt PowerPoint Presentation Infographics Graphics Template
This is a column chart ppt powerpoint presentation infographics graphics template. This is a two stage process. The stages in this process are percentage, product, business, management, marketing.

Pie Chart Ppt PowerPoint Presentation Infographic Template Topics
This is a pie chart ppt powerpoint presentation infographic template topics. This is a three stage process. The stages in this process are percentage, management, marketing, business.
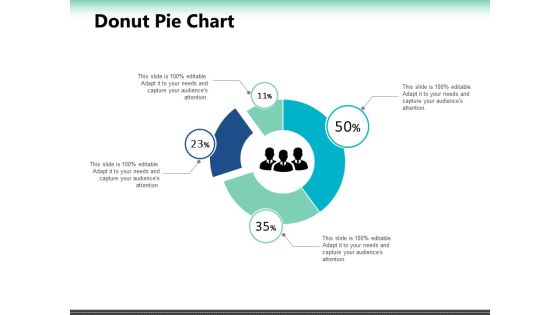
Donut Pie Chart Ppt PowerPoint Presentation Outline Deck
This is a donut pie chart ppt powerpoint presentation outline deck. This is a four stage process. The stages in this process are finance, business, marketing, management, percentage.

Scatter Bubble Chart Ppt PowerPoint Presentation Inspiration Demonstration
This is a scatter bubble chart ppt powerpoint presentation inspiration demonstration. This is a two stage process. The stages in this process are percentage, product, business, management, marketing.

Clustered Column Chart Ppt PowerPoint Presentation Ideas Picture
This is a clustered column chart ppt powerpoint presentation ideas picture. This is a three stage process. The stages in this process are percentage, product, management, marketing.
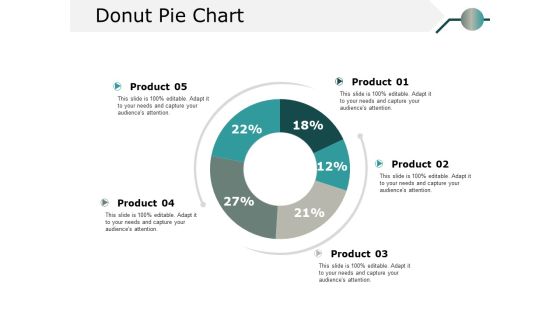
Donut Pie Chart Ppt PowerPoint Presentation Model Information
This is a donut pie chart ppt powerpoint presentation model information. This is a five stage process. The stages in this process are percentage, product, business.

Donut Pie Chart Ppt PowerPoint Presentation Model Outline
This is a donut pie chart ppt powerpoint presentation model outline. This is a four stage process. The stages in this process are percentage, product, business.

Stacked Column Chart Ppt PowerPoint Presentation Slides Files
This is a stacked column chart ppt powerpoint presentation slides files. This is a three stage process. The stages in this process are percentage, product, business, marketing.
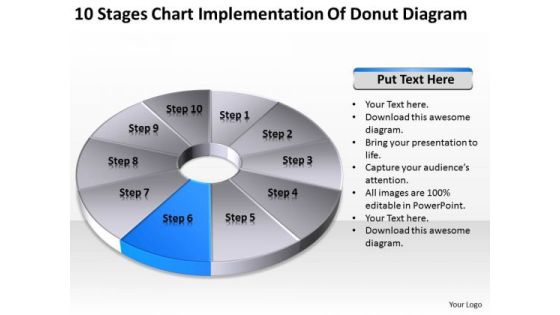
Chart Implementation Of Donut Diagram Simple Business Plan Templates PowerPoint
We present our chart implementation of donut diagram simple business plan templates PowerPoint.Present our Ring Charts PowerPoint Templates because Our PowerPoint Templates and Slides will steer your racing mind. Hit the right buttons and spur on your audience. Download and present our Process and Flows PowerPoint Templates because Our PowerPoint Templates and Slides will let Your superior ideas hit the target always and everytime. Use our Flow Charts PowerPoint Templates because Our PowerPoint Templates and Slides have the Brilliant backdrops. Guaranteed to illuminate the minds of your audience. Use our Marketing PowerPoint Templates because our PowerPoint Templates and Slides will give your ideas the shape. Use our Business PowerPoint Templates because You are an avid believer in ethical practices. Highlight the benefits that accrue with our PowerPoint Templates and Slides.Use these PowerPoint slides for presentations relating to Pie, chart, isolated, white, bar, business, concept, sign, render, spectrum, bright, diagram, circle, percentage, light, graphic,element, digital, report, marketing, abstract, graph, modern, creative, illustration, icon, up, web, design, painting, set, art, progress, effect, style, steps,ten,pattern, financial. The prominent colors used in the PowerPoint template are Gray, White, Blue.
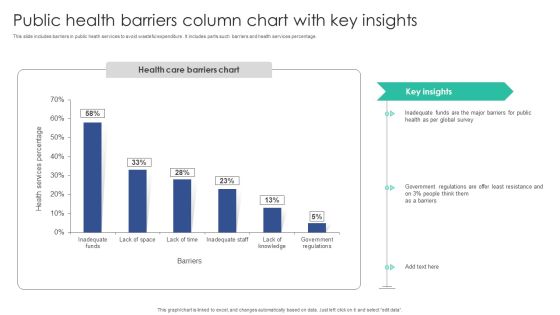
Public Health Barriers Column Chart With Key Insights Portrait PDF
This slide includes barriers in public heath services to avoid wasteful expenditure . It includes parts such barriers and health services percentage.Pitch your topic with ease and precision using this Public Health Barriers Column Chart With Key Insights Portrait PDF. This layout presents information on Inadequate Funds, Global Survey, Government Regulations. It is also available for immediate download and adjustment. So, changes can be made in the color, design, graphics or any other component to create a unique layout.
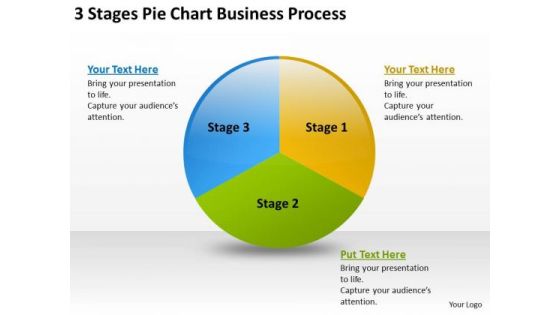
Chart Business PowerPoint Theme Process Writing Simple Plan Templates
We present our chart business powerpoint theme process writing simple plan templates.Download and present our Circle Charts PowerPoint Templates because Our PowerPoint Templates and Slides are aesthetically designed to attract attention. We gaurantee that they will grab all the eyeballs you need. Download and present our Flow Charts PowerPoint Templates because It is Aesthetically crafted by artistic young minds. Our PowerPoint Templates and Slides are designed to display your dexterity. Present our Business PowerPoint Templates because You can Stir your ideas in the cauldron of our PowerPoint Templates and Slides. Cast a magic spell on your audience. Download and present our Shapes PowerPoint Templates because you can Break through with our PowerPoint Templates and Slides. Bring down the mental barriers of your audience. Present our Marketing PowerPoint Templates because It can Bubble and burst with your ideas.Use these PowerPoint slides for presentations relating to Analyzing, business, capital, commerce, communication, company, decrease, descending, direction, earnings, economic, economy, finance, financial, graph,grow, growth, index, information, investment, leader, manage, management, marketing, money, organization, part, partition, percentage, pie, piechart, graph, piece, plan, presentation, process, profit, progress, report, resource, results, selling, slice, statistic, success, system, team, theory. The prominent colors used in the PowerPoint template are Green, Yellow, Blue.
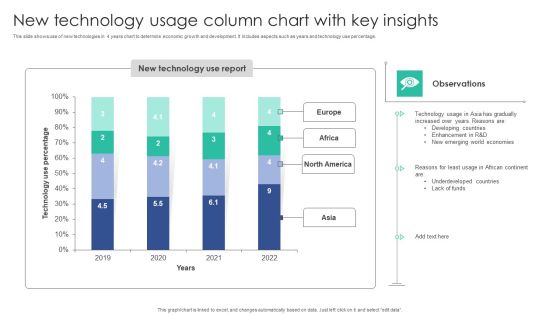
New Technology Usage Column Chart With Key Insights Brochure PDF
This slide shows use of new technologies in 4 years chart to determine economic growth and development. It Includes aspects such as years and technology use percentage.Pitch your topic with ease and precision using this New Technology Usage Column Chart With Key Insights Brochure PDF. This layout presents information on Technology Gradually, Increased Reasons, Developing Countries. It is also available for immediate download and adjustment. So, changes can be made in the color, design, graphics or any other component to create a unique layout.

Bar Chart Ppt PowerPoint Presentation Infographics Format Ideas
This is a bar chart ppt powerpoint presentation infographics format ideas. This is a two stage process. The stages in this process are bar graph, product, financial year, sales in percentage.

Column Chart Ppt PowerPoint Presentation Gallery Slide Portrait
This is a column chart ppt powerpoint presentation gallery slide portrait. This is a two stage process. The stages in this process are sales in percentage, financial year, product, bar graph, growth.

Column Chart Ppt PowerPoint Presentation Model Graphics Download
This is a column chart ppt powerpoint presentation model graphics download. This is a two stage process. The stages in this process are product, financial year, sales in percentage, bar graph, success.

Area Chart Ppt PowerPoint Presentation File Graphic Tips
This is a area chart ppt powerpoint presentation file graphic tips. This is a two stage process. The stages in this process are product, in percentage, financial year, business, growth.

Line Chart Ppt PowerPoint Presentation Model Design Templates
This is a line chart ppt powerpoint presentation model design templates. This is a two stage process. The stages in this process are sales in percentage, financial years, product.
Scatter Line Chart Ppt PowerPoint Presentation Icon Files
This is a scatter line chart ppt powerpoint presentation icon files. This is a one stage process. The stages in this process are dollar in millions, product, sales in percentage.

Bar Chart Ppt PowerPoint Presentation Infographic Template Skills
This is a bar chart ppt powerpoint presentation infographic template skills. This is a nine stage process. The stages in this process are sales in percentage, finance, business, marketing, strategy, success.

Area Chart Ppt PowerPoint Presentation Show Layout Ideas
This is a area chart ppt powerpoint presentation show layout ideas. This is a two stage process. The stages in this process are product, in percentage, financial year, growth.
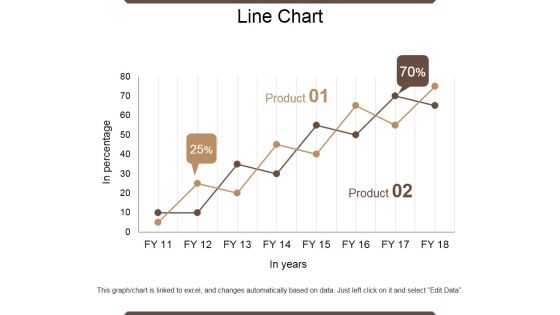
Line Chart Ppt PowerPoint Presentation Outline Infographic Template
This is a line chart ppt powerpoint presentation outline infographic template. This is a two stage process. The stages in this process are in percentage, product, in year, growth, success.
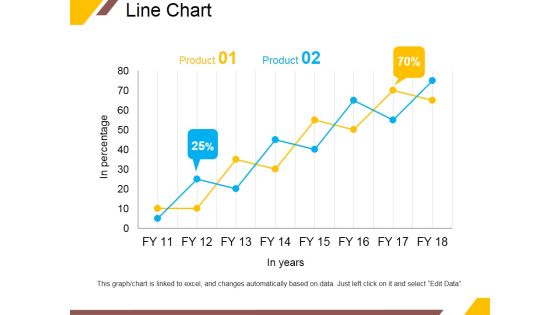
Line Chart Ppt PowerPoint Presentation Portfolio Infographic Template
This is a line chart ppt powerpoint presentation portfolio infographic template. This is a two stage process. The stages in this process are product, in years, business, percentage, growth.

Scatter Chart Ppt PowerPoint Presentation Ideas Designs Download
This is a scatter chart ppt powerpoint presentation ideas designs download. This is a one stage process. The stages in this process are product, dollar, in percentage, growth, success.

Scatter Bubble Chart Ppt PowerPoint Presentation Styles Objects
This is a scatter bubble chart ppt powerpoint presentation styles objects. This is a two stage process. The stages in this process are product, in price, highest sale, percentage, finance.
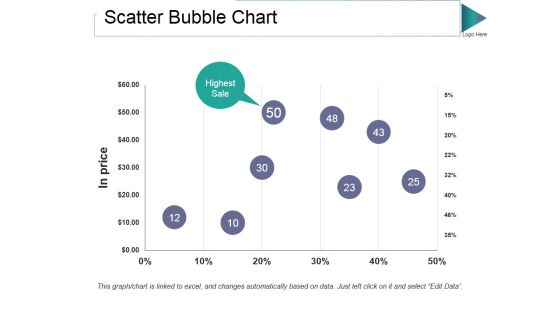
Scatter Bubble Chart Ppt PowerPoint Presentation Gallery Guidelines
This is a scatter bubble chart ppt powerpoint presentation gallery guidelines. This is a one stage process. The stages in this process are in price, highest sale, percentage, finance, business.

Bar Chart Ppt PowerPoint Presentation Pictures Background Image
This is a bar chart ppt powerpoint presentation pictures background image. This is a seven stage process. The stages in this process are financial years, sales in percentage, graph, business.
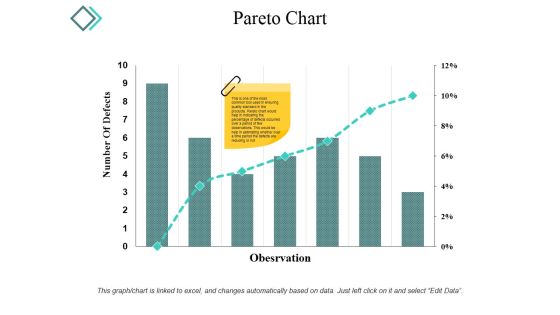
Pareto Chart Ppt PowerPoint Presentation Infographic Template Microsoft
This is a pareto chart ppt powerpoint presentation infographic template microsoft. This is a seven stage process. The stages in this process are number of defects, observation, graph, percentage, business.
Donut Pie Chart Ppt PowerPoint Presentation Icon Background Images
This is a donut pie chart ppt powerpoint presentation icon background images. This is a four stage process. The stages in this process are donut, process, planning, percentage, finance.

Scatter Bubble Chart Ppt PowerPoint Presentation Diagram Ppt
This is a scatter bubble chart ppt powerpoint presentation diagram ppt. This is a two stage process. The stages in this process are product, in price, highest sale, percentage, business, marketing.
Donut Pie Chart Ppt PowerPoint Presentation Icon Slide Portrait
This is a donut pie chart ppt powerpoint presentation icon slide portrait. This is a five stage process. The stages in this process are product, percentage, finance, donut, business.

Area Chart Ppt PowerPoint Presentation Layouts Graphics Example
This is a area chart ppt powerpoint presentation layouts graphics example. This is a two stage process. The stages in this process are sales in percentage, financial year, business, marketing, presentation.

Pie Chart For Current Sources Of Profit Ppt Background Template
This is a pie chart for current sources of profit ppt background template. This is a five stage process. The stages in this process are finance, success, business, marketing, percentage, donut.
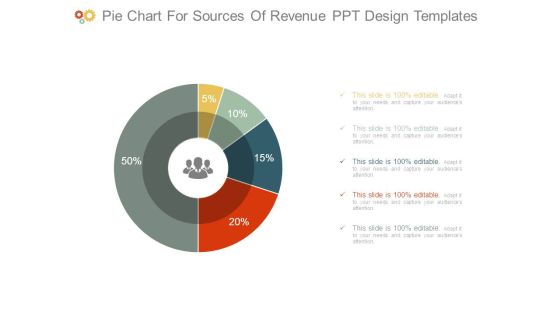
Pie Chart For Sources Of Revenue Ppt Design Templates
This is a pie chart for sources of revenue ppt design templates. This is a five stage process. The stages in this process are finance, success, business, marketing, percentage, donut.
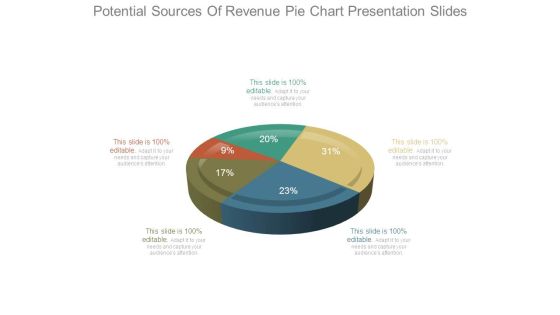
Potential Sources Of Revenue Pie Chart Presentation Slides
This is a potential sources of revenue pie chart presentation slides. This is a five stage process. The stages in this process are finance, success, business, marketing, percentage, pie.

Financial Reporting And Analysis Pie Chart Ppt PowerPoint Presentation Guidelines
This is a financial reporting and analysis pie chart ppt powerpoint presentation guidelines. This is a four stage process. The stages in this process are process, percentage, business, marketing, finance.
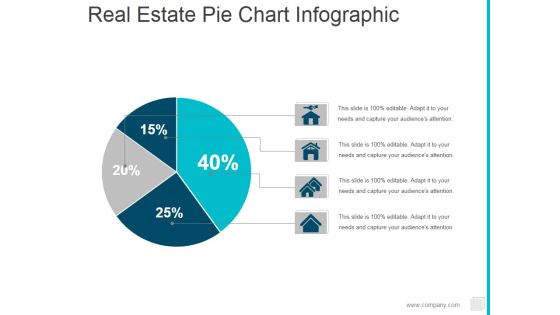
Real Estate Pie Chart Infographic Ppt PowerPoint Presentation Ideas Shapes
This is a real estate pie chart infographic ppt powerpoint presentation ideas shapes. This is a four stage process. The stages in this process are pie, finance, marketing, percentage.

Donut Pie Chart Ppt PowerPoint Presentation Inspiration Background Image
This is a donut pie chart ppt powerpoint presentation inspiration background image. This is a three stage process. The stages in this process are product, percentage, business, marketing, process.

Donut Pie Chart Ppt PowerPoint Presentation Infographics Background Designs
This is a donut pie chart ppt powerpoint presentation infographics background designs. This is a three stage process. The stages in this process are finance, business, marketing, strategy, percentage.
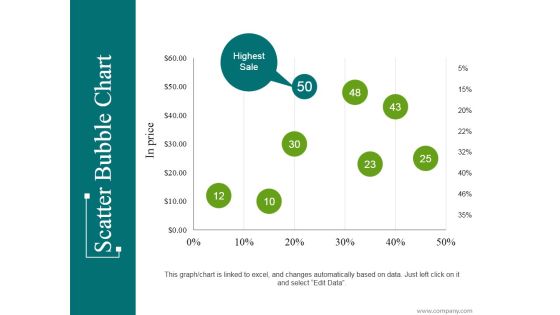
Scatter Bubble Chart Ppt PowerPoint Presentation Infographic Template Introduction
This is a scatter bubble chart ppt powerpoint presentation infographic template introduction. This is a eight stage process. The stages in this process are highest sale, business, marketing, percentage, finance.
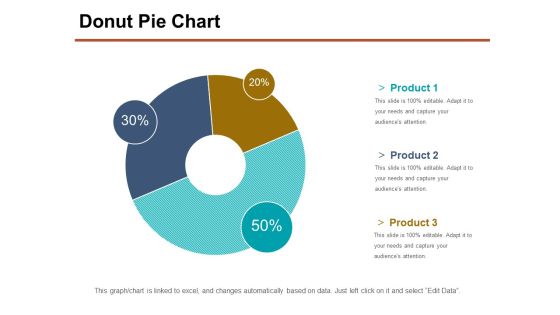
Donut Pie Chart Ppt PowerPoint Presentation Professional Slide Portrait
This is a donut pie chart ppt powerpoint presentation professional slide portrait. This is a three stage process. The stages in this process are product, percentage, business, management, process.
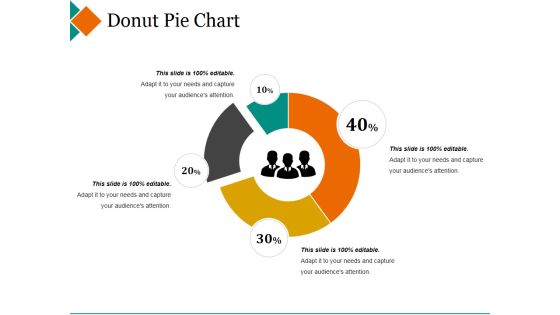
Donut Pie Chart Ppt PowerPoint Presentation Pictures Design Inspiration
This is a donut pie chart ppt powerpoint presentation pictures design inspiration. This is a four stage process. The stages in this process are maximum, donut, minimum, percentage, finance.
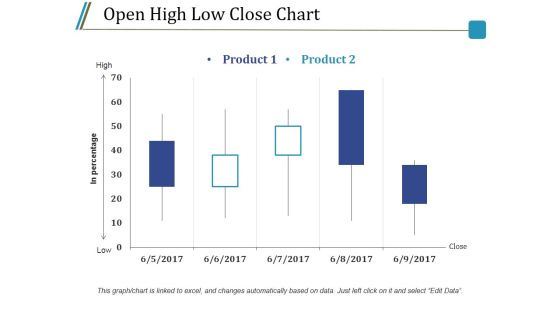
Open High Low Close Chart Ppt PowerPoint Presentation Styles Model
This is a open high low close chart ppt powerpoint presentation styles model. This is a five stage process. The stages in this process are product, high, low, in percentage, close.

Open High Low Close Chart Ppt PowerPoint Presentation Outline Rules
This is a open high low close chart ppt powerpoint presentation outline rules. This is a two stage process. The stages in this process are product, high, low, close, in percentage.
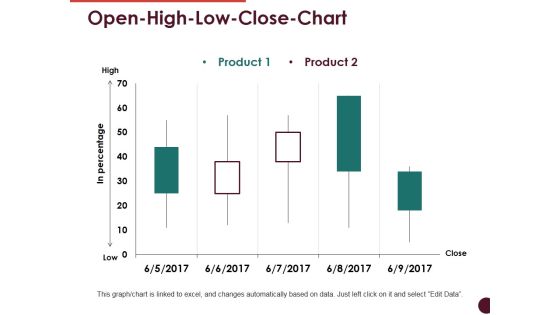
Open High Low Close Chart Ppt PowerPoint Presentation Professional Visuals
This is a open high low close chart ppt powerpoint presentation professional visuals. This is a two stage process. The stages in this process are high, low, in percentage, product, close.

Donut Pie Chart Ppt PowerPoint Presentation Professional Graphic Images
This is a donut pie chart ppt powerpoint presentation professional graphic images. This is a three stage process. The stages in this process are percentage, finance, donut, business, marketing.

Bar Chart Ppt PowerPoint Presentation Slides Example File
This is a bar chart ppt powerpoint presentation slides example file. This is a two stage process. The stages in this process are product, financial years, sales in percentage.

Donut Pie Chart Ppt PowerPoint Presentation Show Graphics Download
This is a donut pie chart ppt powerpoint presentation show graphics download. This is a three stage process. The stages in this process are percentage, finance, donut, business, marketing.

Bar Chart Ppt PowerPoint Presentation Infographic Template Graphics Design
This is a bar chart ppt powerpoint presentation infographic template graphics design. This is a five stage process. The stages in this process are management, marketing, business, percentage, product.
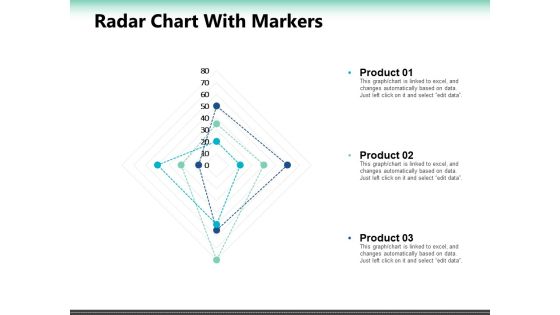
Radar Chart With Markers Ppt PowerPoint Presentation Summary Slide Portrait
This is a radar chart with markers ppt powerpoint presentation summary slide portrait. This is a seven stage process. The stages in this process are percentage, product, business, marketing.
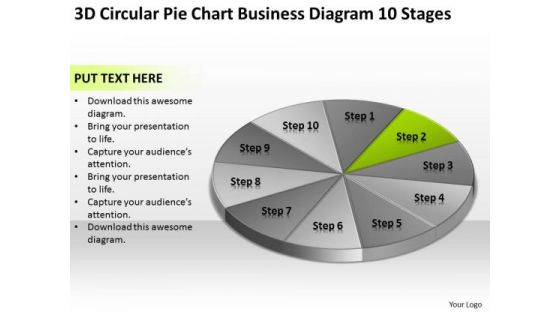
Circular Pie Chart Business Diagram 10 Stages Plan PowerPoint Slides
We present our circular pie chart business diagram 10 stages plan PowerPoint Slides.Present our Business PowerPoint Templates because Our PowerPoint Templates and Slides are conceived by a dedicated team. Use them and give form to your wondrous ideas. Present our Finance PowerPoint Templates because Our PowerPoint Templates and Slides are created with admirable insight. Use them and give your group a sense of your logical mind. Use our Circle Charts PowerPoint Templates because Our PowerPoint Templates and Slides come in all colours, shades and hues. They help highlight every nuance of your views. Download our Shapes PowerPoint Templates because Our PowerPoint Templates and Slides will let your team Walk through your plans. See their energy levels rise as you show them the way. Download and present our Process and Flows PowerPoint Templates because Timeline crunches are a fact of life. Meet all deadlines using our PowerPoint Templates and Slides.Use these PowerPoint slides for presentations relating to Chart, donut, market, isolated, diminishing, rate, downtrend, business, three-dimensional, success, presentation, diagram, circle, uptrend, percentage, graphic, finance, data, stock, holdings, report, marketing, analyzing, trading, graph, illustration, pie, sale, up, money, design, currency, growth, descriptive, representing, painting, moving, progress, part, increases, background, investment, index, financial, multi, counter. The prominent colors used in the PowerPoint template are Green, Gray, White.
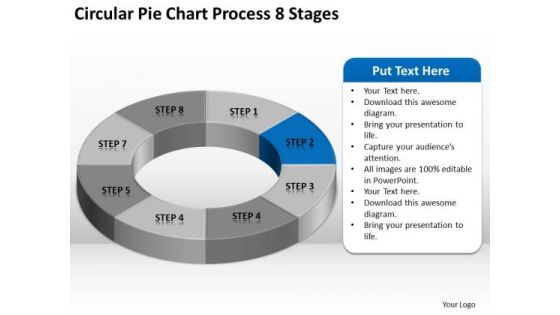
Circular Pie Chart Process 8 Stages Business Plan PowerPoint Slides
We present our circular pie chart process 8 stages business plan PowerPoint Slides.Download our Marketing PowerPoint Templates because Our PowerPoint Templates and Slides are designed to help you succeed. They have all the ingredients you need. Use our Finance PowerPoint Templates because It can be used to Set your controls for the heart of the sun. Our PowerPoint Templates and Slides will be the propellant to get you there. Download our Business PowerPoint Templates because It can Leverage your style with our PowerPoint Templates and Slides. Charm your audience with your ability. Use our Circle Charts PowerPoint Templates because you should once Tap the ingenuity of our PowerPoint Templates and Slides. They are programmed to succeed. Download our Shapes PowerPoint Templates because You can Hit the nail on the head with our PowerPoint Templates and Slides. Embed your ideas in the minds of your audience.Use these PowerPoint slides for presentations relating to Chart, Pie, Graph, Vector, 3d, Icon, Diagram, Progress, Business, Circular, Design, Information, Market, Opinion, Corporate, Sign, Symbol, Shadow, Percentage, Graphic, Finance, Data, Element, Drawing, Report, Marketing, Shape, Illustration, Earnings, Number, Strategy, Money, Dimensional, Survey, Growth, Colorful, Global, Account, Part, Investment, Statistic, Financial. The prominent colors used in the PowerPoint template are Blue, Gray, White.

Circular Pie Chart Process 8 Stages Business Plan PowerPoint Slide
We present our circular pie chart process 8 stages business plan PowerPoint Slide.Download our Marketing PowerPoint Templates because Our PowerPoint Templates and Slides are designed to help you succeed. They have all the ingredients you need. Download our Finance PowerPoint Templates because Our PowerPoint Templates and Slides are the chords of your song. String them along and provide the lilt to your views. Present our Business PowerPoint Templates because Our PowerPoint Templates and Slides are the chords of your song. String them along and provide the lilt to your views. Use our Circle Charts PowerPoint Templates because Our PowerPoint Templates and Slides will provide weight to your words. They will bring out the depth of your thought process. Present our Shapes PowerPoint Templates because Our PowerPoint Templates and Slides are created with admirable insight. Use them and give your group a sense of your logical mind.Use these PowerPoint slides for presentations relating to Chart, Pie, Graph, Vector, 3d, Icon, Diagram, Progress, Business, Circular, Design, Information, Market, Opinion, Corporate, Sign, Symbol, Shadow, Percentage, Graphic, Finance, Data, Element, Drawing, Report, Marketing, Shape, Illustration, Earnings, Number, Strategy, Money, Dimensional, Survey, Growth, Colorful, Global, Account, Part, Investment, Statistic, Financial. The prominent colors used in the PowerPoint template are Blue, Gray, White.

Business Editable PowerPoint Templates Business Beveled Column Chart Ppt Slides
Business Editable PowerPoint Templates Business beveled column chart PPT Slides-This PowerPoint slide is a data driven Columns Chart. The number of columns depend on the data.-Business Editable PowerPoint Templates Business beveled column chart PPT Slides-This ppt can be used for concepts relating to-chart,, graph, growth, investment, , market, percentage, , presentation report, results, statistics, stock, success and business.

Quantitative Risk Assessment Project Iteration Burn Down Chart Sample PDF
This slide provides the glimpse about the project iteration burn down chart which focuses on 21 days plan along with completed tasks, remaining effort, ideal burndown and remaining tasks. Deliver an awe inspiring pitch with this creative Quantitative Risk Assessment Project Iteration Burn Down Chart Sample PDF bundle. Topics like Project Iteration Burn Down Chart can be discussed with this completely editable template. It is available for immediate download depending on the needs and requirements of the user.
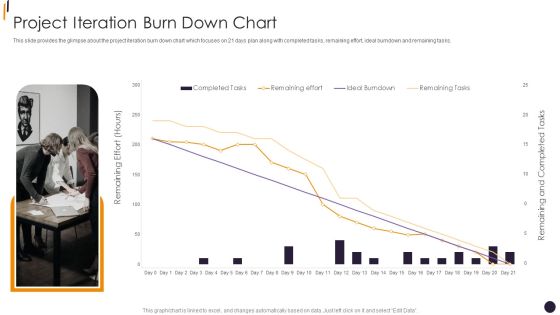
PMP Tools Project Iteration Burn Down Chart Slides PDF
This slide provides the glimpse about the project iteration burn down chart which focuses on 21 days plan along with completed tasks, remaining effort, ideal burndown and remaining tasks.Deliver an awe inspiring pitch with this creative PMP Tools Project Iteration Burn Down Chart Slides PDF bundle. Topics like Remaining Effort, Remaining Tasks, Completed Tasks can be discussed with this completely editable template. It is available for immediate download depending on the needs and requirements of the user.

Sprint Overview Summary Report With Burndown Chart Rules PDF
This slide illustrates facts and figures related to sprint overview summary for agile project management. It includes current week story summary, weekly development tasks, sprint task planning, etc. Showcasing this set of slides titled Sprint Overview Summary Report With Burndown Chart Rules PDF. The topics addressed in these templates are Current Week Story Summary, Weekly Development Tasks, Sprint Task Planning. All the content presented in this PPT design is completely editable. Download it and make adjustments in color, background, font etc. as per your unique business setting.

Business Diagrams Templates 3d Persons Colorful Pie Chart Marketing PowerPoint
We present our business diagrams templates 3d persons colorful pie chart marketing PowerPoint.Use our Marketing PowerPoint Templates because It can be used to Set your controls for the heart of the sun. Our PowerPoint Templates and Slides will be the propellant to get you there. Download our Business PowerPoint Templates because It will Strengthen your hand with your thoughts. They have all the aces you need to win the day. Download and present our Finance PowerPoint Templates because It is Aesthetically crafted by artistic young minds. Our PowerPoint Templates and Slides are designed to display your dexterity. Use our Sales PowerPoint Templates because Our PowerPoint Templates and Slides has conjured up a web of all you need with the help of our great team. Use them to string together your glistening ideas. Download our Shapes PowerPoint Templates because our PowerPoint Templates and Slides are the string of your bow. Fire of your ideas and conquer the podium.Use these PowerPoint slides for presentations relating to 3d, Bank, Banking, Business, Businessman, Character, Chart, Circle, Deal, Deposit, Diagram, Discount, Distribution, Earn, Earnings, Economics, Fair, Fee, Finance, Financial, Graph, Human, Income, Interest, Man, Marketing, Money, Part, Pay, Payment, Percent, Percentage, Person, Pie, Price, Profit, Quarter, Quota, Rate, Revenue, Royalties, Sale, Satisfied, Sell. The prominent colors used in the PowerPoint template are Yellow, Red, Blue. Presenters tell us our business diagrams templates 3d persons colorful pie chart marketing PowerPoint will help you be quick off the draw. Just enter your specific text and see your points hit home. PowerPoint presentation experts tell us our Deal PowerPoint templates and PPT Slides are effectively colour coded to prioritise your plans They automatically highlight the sequence of events you desire. Professionals tell us our business diagrams templates 3d persons colorful pie chart marketing PowerPoint help you meet deadlines which are an element of today's workplace. Just browse and pick the slides that appeal to your intuitive senses. People tell us our Banking PowerPoint templates and PPT Slides are second to none. The feedback we get is that our business diagrams templates 3d persons colorful pie chart marketing PowerPoint will make the presenter look like a pro even if they are not computer savvy. Customers tell us our Businessman PowerPoint templates and PPT Slides are topically designed to provide an attractive backdrop to any subject.

Business Task Planning Chart Ppt PowerPoint Presentation Show Portfolio
Presenting this set of slides with name business task planning chart ppt powerpoint presentation show portfolio. The topics discussed in these slides are business task, planning chart. This is a completely editable PowerPoint presentation and is available for immediate download. Download now and impress your audience.
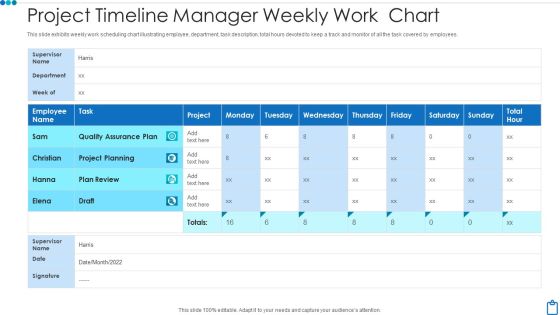
Project Timeline Manager Weekly Work Chart Demonstration PDF
This slide exhibits weekly work scheduling chart illustrating employee, department, task description, total hours devoted to keep a track and monitor of all the task covered by employees. Showcasing this set of slides titled project timeline manager weekly work chart demonstration pdf. The topics addressed in these templates are project timeline manager weekly work chart. All the content presented in this PPT design is completely editable. Download it and make adjustments in color, background, font etc. as per your unique business setting.

Supply Chain Management Process With Gantt Chart Ideas PDF
This slide covers Gantt chart which will be helpful in providing task directions to different department involved in procurement process. The chart illustrates different tasks required to do by department for successful completion of project.Showcasing this set of slides titled Supply Chain Management Process With Gantt Chart Ideas PDF. The topics addressed in these templates are Supply Chain Management Process With Gantt Chart. All the content presented in this PPT design is completely editable. Download it and make adjustments in color, background, font etc. as per your unique business setting.

Project Task Resource Allocation Gantt Chart Rules PDF
This slide showcase a Gantt chart for project activity allocation. It covers tasks such as planning, policymaking, developing scope, budgeting, etc., that ensure balanced workload among members. Showcasing this set of slides titled Project Task Resource Allocation Gantt Chart Rules PDF. The topics addressed in these templates are Planning, Software Development, Budgeting. All the content presented in this PPT design is completely editable. Download it and make adjustments in color, background, font etc. as per your unique business setting.
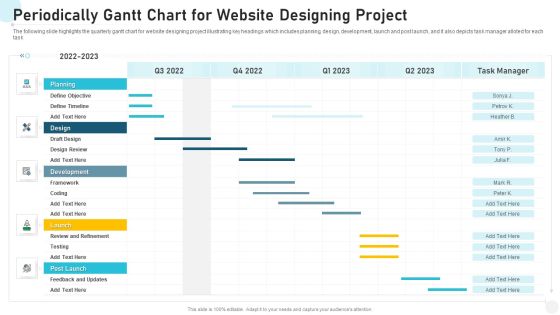
Periodically Gantt Chart For Website Designing Project Portrait PDF
The following slide highlights the quarterly gantt chart for website designing project illustrating key headings which includes planning, design, development, launch and post launch, and it also depicts task manager alloted for each task Showcasing this set of slides titled periodically gantt chart for website designing project portrait pdf. The topics addressed in these templates are periodically gantt chart for website designing project. All the content presented in this PPT design is completely editable. Download it and make adjustments in color, background, font etc. as per your unique business setting.

Agile Kanban Methodology Chart With Stories Formats PDF
This slide explains Kanban Methodology through a chart that shows User Story Details, Tasks to be done, Tasks in progress Product Development, Software Quality Check, Testing to be done Automation Processes, Cycle Time Analysis and the activities that are ready to be deployed. Deliver an awe-inspiring pitch with this creative agile kanban methodology chart with stories formats pdf bundle. Topics like agile kanban methodology chart with stories can be discussed with this completely editable template. It is available for immediate download depending on the needs and requirements of the user.

Agile Kanban Methodology Chart With Stories Ppt Model Show PDF
This slide explains Kanban Methodology through a chart that shows User Story Details, Tasks to be done, Tasks in progress Product Development, Software Quality Check, Testing to be done Automation Processes, Cycle Time Analysis and the activities that are ready to be deployed. Deliver an awe inspiring pitch with this creative agile kanban methodology chart with stories ppt model show pdf bundle. Topics like product development, process enhancements to timely deliver the project, agile kanban methodology chart with stories can be discussed with this completely editable template. It is available for immediate download depending on the needs and requirements of the user.

Work Flow Chart Of An Online Transaction Payment Inspiration PDF
The following slide shows the task flow chart of transaction payment. It includes information about recipient details, amount of money to be sent, confirming and sending the amount. Presenting Work Flow Chart Of An Online Transaction Payment Inspiration PDF to dispense important information. This template comprises one stages. It also presents valuable insights into the topics including Work Flow Chart, Online Transaction Payment. This is a completely customizable PowerPoint theme that can be put to use immediately. So, download it and address the topic impactfully.

Gantt Chart Of Project Tracking And Management Template PDF
This slide illustrates timeline for various tasks of project. It shows monthly time limit of tasks assigned. Showcasing this set of slides titled Gantt Chart Of Project Tracking And Management Template PDF. The topics addressed in these templates are Gantt Chart, Project Tracking And Management. All the content presented in this PPT design is completely editable. Download it and make adjustments in color, background, font etc. as per your unique business setting.

Project Time Scheduling Chart With Task Details Pictures PDF
This slide delineates project time management chart with task details that businesses can use during their routine projects . It also contains information about analysis, design, development and testing which can assist project managers in effective time management. Showcasing this set of slides titled project time scheduling chart with task details pictures pdf. The topics addressed in these templates are design, analysis, development. All the content presented in this PPT design is completely editable. Download it and make adjustments in color, background, font etc. as per your unique business setting.

Project Work Resource Allocation Gantt Chart Elements PDF
This slide represents Gantt chart for project task allocation. It also showcase project activities, duration, priority, initiation date and end date for task completion. Showcasing this set of slides titled Project Work Resource Allocation Gantt Chart Elements PDF. The topics addressed in these templates are Interpreting Requirements, Benchmarking Products, Customer Identification. All the content presented in this PPT design is completely editable. Download it and make adjustments in color, background, font etc. as per your unique business setting.
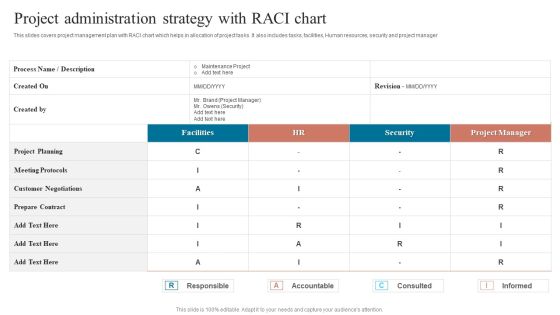
Project Administration Strategy With Raci Chart Rules PDF
This slides covers project management plan with RACI chart which helps in allocation of project tasks. It also includes tasks, facilities, Human resources, security and project manager. Showcasing this set of slides titled Project Administration Strategy With Raci Chart Rules PDF. The topics addressed in these templates are Meeting Protocols, Customer Negotiations, Meeting Protocols. All the content presented in this PPT design is completely editable. Download it and make adjustments in color, background, font etc. as per your unique business setting.
Project Task Management Chart For Tracking Progress Themes PDF
This slide exhibits project task planning chart for tracking progress illustrating task description, starting date, planned ending date, actual end date, planned work days etc that helps in tracking project progress. Showcasing this set of slides titled Project Task Management Chart For Tracking Progress Themes PDF. The topics addressed in these templates are Requirements Analysis, Business Case, Configuration Management. All the content presented in this PPT design is completely editable. Download it and make adjustments in color, background, font etc. as per your unique business setting.
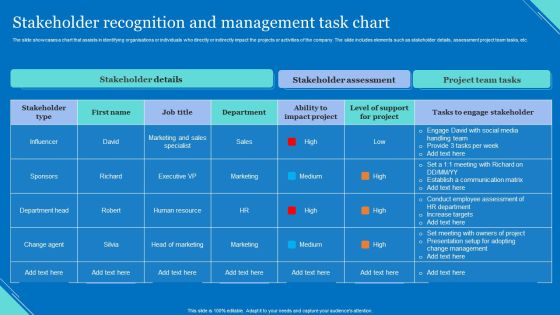
Stakeholder Recognition And Management Task Chart Clipart PDF
The slide showcases a chart that assists in identifying organisations or individuals who directly or indirectly impact the projects or activities of the company. The slide includes elements such as stakeholder details, assessment project team tasks, etc. Showcasing this set of slides titled Stakeholder Recognition And Management Task Chart Clipart PDF. The topics addressed in these templates are Stakeholder Details, Stakeholder Assessment, Project Team Tasks. All the content presented in this PPT design is completely editable. Download it and make adjustments in color, background, font etc. as per your unique business setting.

New Product Launch Task Timeline Chart Demonstration PDF
This slide illustrates Gantt chart with new product release activities. It also includes process stages such as idea generation, idea screening, concept development, business analysis, beta testing, technical implementation, and commercialization. Showcasing this set of slides titled New Product Launch Task Timeline Chart Demonstration PDF. The topics addressed in these templates are Idea Generation, Idea Screening, Concept Development. All the content presented in this PPT design is completely editable. Download it and make adjustments in color, background, font etc. as per your unique business setting.

Project Status Report Gantt Chart With Milestones Information PDF
This slide showcases the project status reporting summary gantt chart. Its key element is task timeline that can help organization to track any disparity in schedule of project. Showcasing this set of slides titled Project Status Report Gantt Chart With Milestones Information PDF. The topics addressed in these templates are Research, Sitemap Creation, Content Creation. All the content presented in this PPT design is completely editable. Download it and make adjustments in color, background, font etc. as per your unique business setting.

Organization Chart And Corporate Model Transformation Organizational Restructuring Background PDF
This a Gantt chart representing the various tasks and subtasks to be performed along with there duration and degree of completion. Deliver and pitch your topic in the best possible manner with this organization chart and corporate model transformation organizational restructuring background pdf. Use them to share invaluable insights on organizational restructuring transition plan and impress your audience. This template can be altered and modified as per your expectations. So, grab it now.

Monthly Content Calendar Roadmap With Gantt Chart Professional PDF
This slide covers a content calendar roadmap illustrating upcoming campaigns content. It also includes the progress chart to determine the current completion status of each enlisted activity. Introducing our Monthly Content Calendar Roadmap With Gantt Chart Professional PDF that is designed to showcase some of the vital components that will help you create timelines, roadmaps, and project plans. In addition, also communicate your project durations, milestones, tasks, subtasks, dependencies, and other attributes using this well structured Monthly Content Calendar Roadmap With Gantt Chart Professional PDF template. You can also exhibit preeminence against time by deploying this easily adaptable slide to your business presentation. Our experts have designed this template in such a way that it is sure to impress your audience. Thus, download it and steer your project meetings, meetups, and conferences.

Project Performance Progress Monitoring Calendar Chart Pictures PDF
This slide covers the project performance measurement schedule chart. It includes the project details along with the project status, task assigned to, start date, end date, and duration of completing each task. Showcasing this set of slides titled Project Performance Progress Monitoring Calendar Chart Pictures PDF. The topics addressed in these templates are Plan Risk Management, Project Definition And Planning, Execution. All the content presented in this PPT design is completely editable. Download it and make adjustments in color, background, font etc. as per your unique business setting.

Agile Project Incremental Life Cycles Plan Gantt Chart Guidelines PDF
This slide covers gantt chart of agile project iteration tasks. It includes tasks such as sprint planning, set up staging environment, configure multilingual features, create base theme, etc. Along with assigned persons and task progress bars. Showcasing this set of slides titled Agile Project Incremental Life Cycles Plan Gantt Chart Guidelines PDF. The topics addressed in these templates are Agile Project Plan, Sprint Planning, Assemble Template. All the content presented in this PPT design is completely editable. Download it and make adjustments in color, background, font etc. as per your unique business setting.
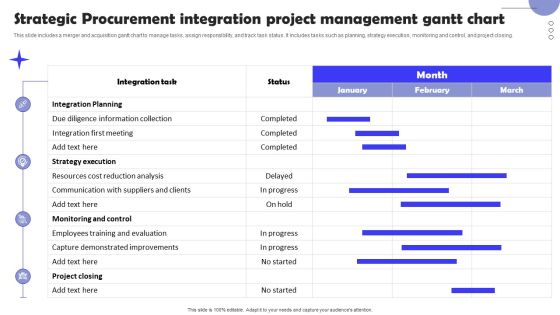
Strategic Procurement Integration Project Management Gantt Chart Summary PDF
This slide includes a merger and acquisition gantt chart to manage tasks, assign responsibility, and track task status. It includes tasks such as planning, strategy execution, monitoring and control, and project closing. Showcasing this set of slides titled Strategic Procurement Integration Project Management Gantt Chart Summary PDF. The topics addressed in these templates are Integration Planning, Monitoring And Control, Strategy Execution. All the content presented in this PPT design is completely editable. Download it and make adjustments in color, background, font etc. as per your unique business setting.

Automated New Staff Onboarding Process Flow Chart Themes PDF
This slide depicts a flow chart for streamlining the entire automated staff onboarding process. It includes various steps such as adding new employee names, preparing an onboarding checklist, task assignment, etc. Showcasing this set of slides titled Automated New Staff Onboarding Process Flow Chart Themes PDF. The topics addressed in these templates are Automatic Notification, Portal, Employees. All the content presented in this PPT design is completely editable. Download it and make adjustments in color, background, font etc. as per your unique business setting.

Gantt Chart Presenting Waterfall Project Management In Healthcare Pictures PDF
This slide shows the Gantt chart that is presenting waterfall project management in healthcare which covers name of the tasks such as analysis, designing, development, testing, implementation with on site meetings, documenting current system, designing database, etc. Showcasing this set of slides titled Gantt Chart Presenting Waterfall Project Management In Healthcare Pictures PDF. The topics addressed in these templates are Documenting Current System, Designing Database, Development. All the content presented in this PPT design is completely editable. Download it and make adjustments in color, background, font etc. as per your unique business setting.

Gantt Chart Management Ppt PowerPoint Presentation Infographic Template Designs
Presenting this set of slides with name gantt chart management ppt powerpoint presentation infographic template designs. The topics discussed in these slide is project, revision, tasks. This is a completely editable PowerPoint presentation and is available for immediate download. Download now and impress your audience.

Business Gantt Chart Ppt Professional Example File PDF
Presenting this set of slides with name business gantt chart ppt professional example file pdf. The topics discussed in these slides are events, project, task, revision. This is a completely editable PowerPoint presentation and is available for immediate download. Download now and impress your audience.
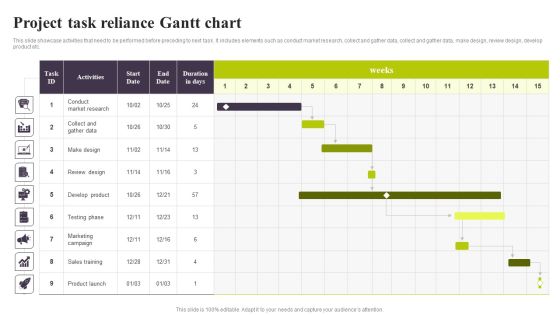
Project Task Reliance Gantt Chart Ppt PowerPoint Presentation Diagram PDF
This slide showcase activities that need to be performed before preceding to next task. It includes elements such as conduct market research, collect and gather data, collect and gather data, make design, review design, develop product etc. Showcasing this set of slides titled Project Task Reliance Gantt Chart Ppt PowerPoint Presentation Diagram PDF. The topics addressed in these templates are Conduct Market Research, Marketing Campaign, Sales Training. All the content presented in this PPT design is completely editable. Download it and make adjustments in color, background, font etc. as per your unique business setting.

New Project Half Yearly Gantt Chart Ideas PDF
This slide covers the tasks and the activities with a time schedule of six months to release the project. It also includes phases which has some tasks under it. Showcasing this set of slides titled New Project Half Yearly Gantt Chart Ideas PDF. The topics addressed in these templates are Develop, Design, Evaluate Findings. All the content presented in this PPT design is completely editable. Download it and make adjustments in color, background, font etc. as per your unique business setting.

Trainee Progress Chart With Supervision Levels Mockup PDF
The slide showcases steps in the learners progress through progress mapping. It covers assessment method, task owner, trainee progress, milestone and stage of competence. Showcasing this set of slides titled Trainee Progress Chart With Supervision Levels Mockup PDF. The topics addressed in these templates are Assessment Method, Evaluation, Quality. All the content presented in this PPT design is completely editable. Download it and make adjustments in color, background, font etc. as per your unique business setting.

Operational Process Administration Flow Chart With Service Desk Inspiration PDF
This slide shows the flowchart for operational project management tasks which assist in enhancing development and growth. It begin with service desk and ends with problem review. Presenting Operational Process Administration Flow Chart With Service Desk Inspiration PDF to dispense important information. This template comprises one stages. It also presents valuable insights into the topics including Detect Problem, Problem Logging, Categorization. This is a completely customizable PowerPoint theme that can be put to use immediately. So, download it and address the topic impactfully.

Role Resource Allocation Chart For Project Management Formats PDF
This slide showcase the project job allocation sheet. It covers roles such as project architect, interior designer, landscape architect, etc., to ensure relevant project tasks have been assigned to members. Showcasing this set of slides titled Role Resource Allocation Chart For Project Management Formats PDF. The topics addressed in these templates are Information, Material, Project Architect. All the content presented in this PPT design is completely editable. Download it and make adjustments in color, background, font etc. as per your unique business setting.

CRM Different Software Product Comparison Chart Portrait PDF
This slide indicates product comparison of two different software. It includes variables like free trial, contact management, deal management, task management, social integration, email integration, analytics and dashboards, etc. Presenting CRM Different Software Product Comparison Chart Portrait PDF to dispense important information. This template comprises three stages. It also presents valuable insights into the topics including Deal Management, Task Management, Advertising Management. This is a completely customizable PowerPoint theme that can be put to use immediately. So, download it and address the topic impactfully.

Solution Monitoring Verification Solution Assessment Criteria Analysis Chart Template PDF
This slide shows the overview and some details of the fifth task in solution assessment and validation process i.e. Validate Solution such as purpose of validating solution, process inputs and output description, elements, stakeholder details and validate solution model. Deliver an awe inspiring pitch with this creative solution monitoring verification solution assessment criteria analysis chart template pdf bundle. Topics like process, output, elements can be discussed with this completely editable template. It is available for immediate download depending on the needs and requirements of the user.
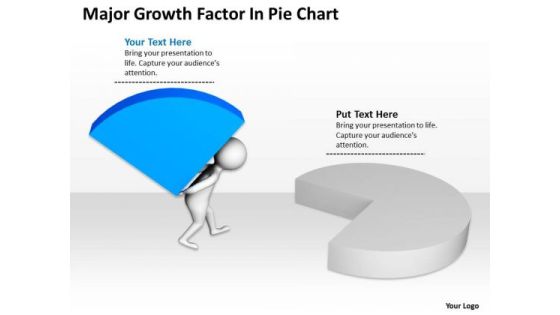
Business People Pictures Growth Factor Pie Chart PowerPoint Templates Ppt Backgrounds For Slides
We present our business people pictures growth factor pie chart PowerPoint templates PPT backgrounds for slides.Download our Success PowerPoint Templates because You can Create a matrix with our PowerPoint Templates and Slides. Feel the strength of your ideas click into place. Download our People PowerPoint Templates because They will bring a lot to the table. Their alluring flavours will make your audience salivate. Present our Business PowerPoint Templates because You have a driving passion to excel in your field. Our PowerPoint Templates and Slides will prove ideal vehicles for your ideas. Use our Finance PowerPoint Templates because Our PowerPoint Templates and Slides will generate and maintain the level of interest you desire. They will create the impression you want to imprint on your audience. Present our Marketing PowerPoint Templates because you can Set pulses racing with our PowerPoint Templates and Slides. They will raise the expectations of your team.Use these PowerPoint slides for presentations relating to icon, budget, investor, team, graph, pie, money, 3d, white, group, human, depositor, percent, guy, slice, activity, rate, business, contribution, deposit, contributor, teamwork, diagram, character, match, percentage, interest, finance, stock, bank, push, people, integration, idea, participant, economic, chart, share, person, together, profit, part, investment, assets, man, financial, economical, businessman, participation, capital. The prominent colors used in the PowerPoint template are Blue, Gray, Black.
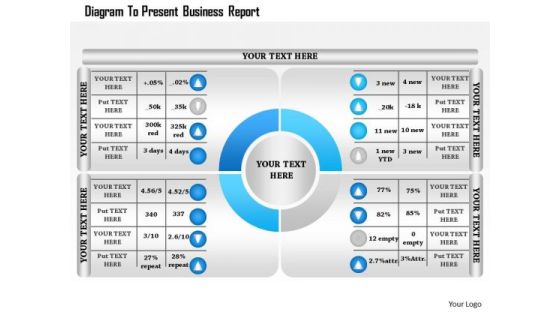
Business Diagram To Present Business Report Presentation Template
Four staged percentage personalized chart has been used to craft this power point template. This PPT contains the concept of data analysis and financial result analysis. This PPT can be used for your data and finance related topics in any business and marketing presentation.

Business Diagram Business Bar Graph For Data Analysis Presentation Template
This business slide displays pie charts with percentage ratios. This diagram is a data visualization tool that gives you a simple way to present statistical information. This slide helps your audience examines and interprets the data you present.

Sales Sales By Geographic Region Report With Doughnut Chart Themes PDF
This slide illustrates graphical representation of sales contribution of countries. It includes revenue of FY19 in percentage and numbers and revenue of FY20 in percentage and numbers. Showcasing this set of slides titled Sales Sales By Geographic Region Report With Doughnut Chart Themes PDF. The topics addressed in these templates are Revenue, Doughnut Chart, Geographic Region Report. All the content presented in this PPT design is completely editable. Download it and make adjustments in color, background, font etc. as per your unique business setting.

Bar Graph For Statistical Analysis Powerpoint Slides
This PowerPoint template has been designed with bar chart and percentage values. You may download this PPT slide to depict statistical analysis. Add this slide to your presentation and impress your superiors.
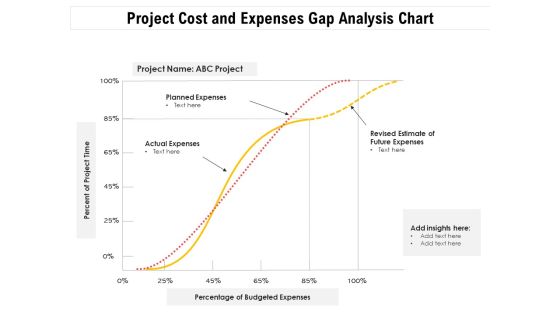
Project Cost And Expenses Gap Analysis Chart Ppt PowerPoint Presentation Infographics Graphics PDF
Presenting this set of slides with name project cost and expenses gap analysis chart ppt powerpoint presentation infographics graphics pdf. The topics discussed in these slides are planned expenses, actual expenses, revised estimate of future expenses, percent of project time, percentage of budgeted expenses. This is a completely editable PowerPoint presentation and is available for immediate download. Download now and impress your audience.

Ppt 3d Men Standing On New Business PowerPoint Presentation Pie Chart Templates
PPT 3d men standing on new business powerpoint presentation pie chart Templates-This 3D Business PowerPoint Diagram consists of men standing on circle representing their percentage of work and growth individually. This Diagram will fit for Business Presentations.-PPT 3d men standing on new business powerpoint presentation pie chart Templates-Adult, Art, Background, Business, Career, Chart, Communication, Concept, Conference, Corporate, Creative, Design, Economy, Executive, Finance, Group, Growth, Idea, Illustration, Leadership, Meeting, New, Occupation, Office, People, Person, Progress, Silhouette, Space, Speaking, Standing, Success
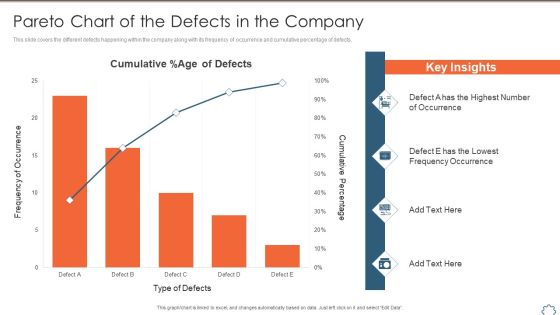
Total Productive Management At Workplace Pareto Chart Of The Defects In The Company Structure PDF
This slide covers the different defects happening within the company along with its frequency of occurrence and cumulative percentage of defects. Deliver an awe inspiring pitch with this creative total productive management at workplace pareto chart of the defects in the company structure pdf bundle. Topics like pareto chart of the defects in the company can be discussed with this completely editable template. It is available for immediate download depending on the needs and requirements of the user.

Ppt Group Of World Business PowerPoint Slide Text People With 3d Pie Chart Templates
PPT group of world business powerpoint slide text people with 3d pie chart Templates-This 3D Business PowerPoint Diagram consists of group of people standing on circle representing the growth percentage of individual Business perspective. This Diagram will fit for Business Presentations.-PPT group of world business powerpoint slide text people with 3d pie chart Templates-Abstract, Arrow, Art, Artistic, Background, Business, Colorful, Communication, Computer-Graphics, Concept, Creation, Data, Decoration, Decorative, Design, Design-Element, Digital, Direction, Effect, Elegance, Element, Energy, Flow, Go, Idea, Illustration, Modern, Movement, Network, Symbol

Product Market Share Chart Of Electronic Company Ppt Gallery Graphic Tips PDF
This slide shows the percentage of market share graph of electronic company products. It includes mobile phone, laptop, tablet, computer and others devices. Pitch your topic with ease and precision using this Product Market Share Chart Of Electronic Company Ppt Gallery Graphic Tips PDF. This layout presents information on Mobile Phone, Computer, Laptop, Tablet. It is also available for immediate download and adjustment. So, changes can be made in the color, design, graphics or any other component to create a unique layout.
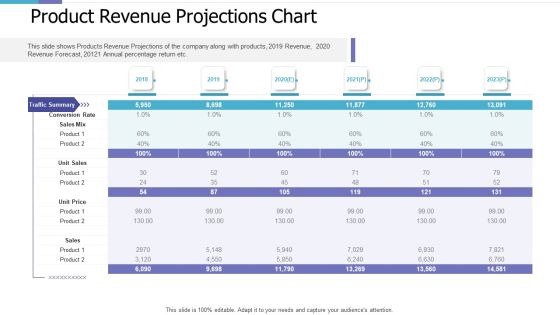
Product Revenue Projections Chart Investor Pitch Deck For PE Funding Brochure PDF
This slide shows Products Revenue Projections of the company along with products, 2019 Revenue, 2020 Revenue Forecast, 20121 Annual percentage return etc. Deliver an awe inspiring pitch with this creative product revenue projections chart investor pitch deck for pe funding brochure pdf bundle. Topics like product revenue projections chart can be discussed with this completely editable template. It is available for immediate download depending on the needs and requirements of the user.

Venture Capital Pitch Decks For Private Companies Product Revenue Projections Chart Inspiration PDF
This slide shows Products Revenue Projections of the company along with products, 2019 Revenue, 2020 Revenue Forecast, 20121 Annual percentage return etc. Deliver an awe inspiring pitch with this creative venture capital pitch decks for private companies product revenue projections chart inspiration pdf bundle. Topics like sales mix, unit sales, unit price, sales can be discussed with this completely editable template. It is available for immediate download depending on the needs and requirements of the user.

Investor Pitch Deck To Generate Venture Capital Funds Product Revenue Projections Chart Ppt Show Ideas PDF
This slide shows Products Revenue Projections of the company along with products, 2019 Revenue, 2020 Revenue Forecast, 20121 Annual percentage return etc. Deliver and pitch your topic in the best possible manner with this investor pitch deck to generate venture capital funds product revenue projections chart ppt show ideas pdf. Use them to share invaluable insights on unit sales, 2018 to 2023 and impress your audience. This template can be altered and modified as per your expectations. So, grab it now.

Circular Pie Chart Process 8 Stages Online Business Plan PowerPoint Templates
We present our circular pie chart process 8 stages online business plan PowerPoint templates.Use our Circle Charts PowerPoint Templates because Our PowerPoint Templates and Slides will let you meet your Deadlines. Download our Ring Charts PowerPoint Templates because Our PowerPoint Templates and Slides come in all colours, shades and hues. They help highlight every nuance of your views. Present our Shapes PowerPoint Templates because Our PowerPoint Templates and Slides are aesthetically designed to attract attention. We gaurantee that they will grab all the eyeballs you need. Download and present our Process and Flows PowerPoint Templates because Our PowerPoint Templates and Slides will let you meet your Deadlines. Use our Business PowerPoint Templates because It will mark the footprints of your journey. Illustrate how they will lead you to your desired destination.Use these PowerPoint slides for presentations relating to direction, market, percent, forward, target, achievement, flow, business, process diagram, concept, arrow, sign, success, symbol, percentage sign, arrow circle, diagram, value, percentage, finance, process, element, goal, marketing, green energy, development, price, abstract, team, management, graph, cycle, icon, chart, project, up, growth, motion, moving, company, competition, progress, profit, increase, investment, aim, financial, upwards, communication. The prominent colors used in the PowerPoint template are Blue, Blue navy, Black.

Ppt Illustration Of 3d Pie Org Chart PowerPoint 2010 With Standing Busines Men Templates
PPT illustration of 3d pie org chart powerpoint 2010 with standing busines men Templates-This 3D Business PowerPoint Diagram consists of group of people standing on Circle representing the percentage of Business perspective of individual field. You can change color, size and orientation of any icon to your liking.-PPT illustration of 3d pie org chart powerpoint 2010 with standing busines men Templates-Achievement, Actualization, Basic, Belonging, Blue, Chart, Confidence, Diagram, Elements, Essential, Fundamental, Glossy, Goals, Gradient, Health, Hierarchical, Hierarchy, Human, Illustration, Isolated, Layer, Level, Love, Morality, Motivation, Needs, Person, Psychological, Psychology, Pyramid

Bar Chart Representing Success Rate Of Linkedin Promotion Strategy Rules PDF
This slide shows graphical representation of LinkedIn marketing strategy in terms of success percentage by companies such as B2C, B2B software , B2B business services, etc. which reflects effectiveness of strategies in business Pitch your topic with ease and precision using this bar chart representing success rate of linkedin promotion strategy rules pdf. This layout presents information on bar chart representing success rate of linkedin promotion strategy. It is also available for immediate download and adjustment. So, changes can be made in the color, design, graphics or any other component to create a unique layout.
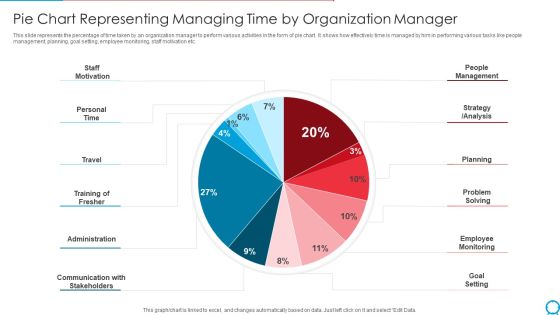
Pie Chart Representing Managing Time By Organization Manager Ppt PowerPoint Presentation Gallery Template PDF
This slide represents the percentage of time taken by an organization manager to perform various activities in the form of pie chart. It shows how effectively time is managed by him in performing various tasks like people management, planning, goal setting, employee monitoring, staff motivation etc. Pitch your topic with ease and precision using this pie chart representing managing time by organization manager ppt powerpoint presentation gallery template pdf. This layout presents information on staff motivation, personal time, travel training of fresher, administration. It is also available for immediate download and adjustment. So, changes can be made in the color, design, graphics or any other component to create a unique layout.
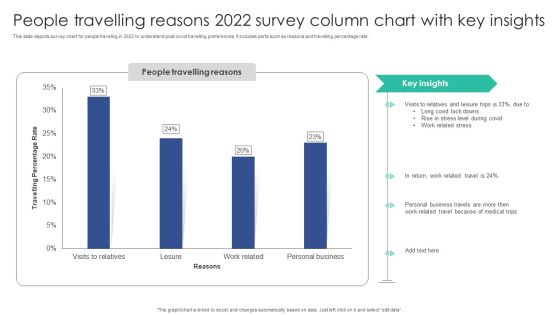
People Travelling Reasons 2022 Survey Column Chart With Key Insights Sample PDF
This slide depicts survey chart for people traveling in 2022 to understand post covid travelling preferences. It includes parts such as reasons and travelling percentage rate.Pitch your topic with ease and precision using this People Travelling Reasons 2022 Survey Column Chart With Key Insights Sample PDF. This layout presents information on Visits Relatives, Leisure Trips, Personal Business. It is also available for immediate download and adjustment. So, changes can be made in the color, design, graphics or any other component to create a unique layout.

Market Chart Showing Revenue Breakdown Of FMCG Company Ppt Layouts Layouts PDF
This slide shows the percentage of revenue generated in fast moving consumable goods industry from different segments which are food products, households, personal, baby and hair care, OTC products and others. Showcasing this set of slides titled Market Chart Showing Revenue Breakdown Of FMCG Company Ppt Layouts Layouts PDF. The topics addressed in these templates are Food Products, Personal Care, Households. All the content presented in this PPT design is completely editable. Download it and make adjustments in color, background, font etc. as per your unique business setting.

Hedge Fund Investment Portfolio Ppt Powerpoint Presentation Styles Pictures
This is a hedge fund investment portfolio ppt powerpoint presentation styles pictures. This is a nine stage process. The stages in this process are pie chart, percentage, marketing, business, analysis.

Pie Business Analysis Ppt Powerpoint Presentation Model Graphics
This is a pie business analysis ppt powerpoint presentation model graphics. This is a four stage process. The stages in this process are pie chart, percentage, marketing, business, analysis.
 Home
Home