Percentage Charts
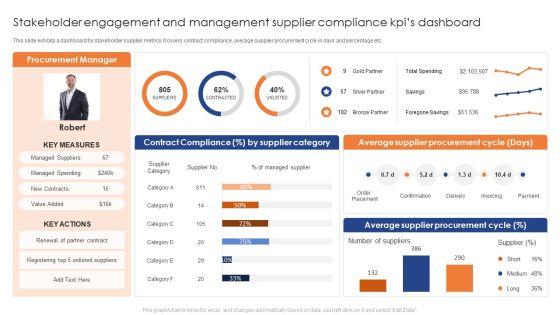
Stakeholder Engagement And Management Supplier Compliance Kpis Dashboard Pictures PDF
This slide exhibits a dashboard for stakeholder supplier metrics. It covers contract compliance, average supplier procurement cycle in days and percentage etc. Showcasing this set of slides titled Stakeholder Engagement And Management Supplier Compliance Kpis Dashboard Pictures PDF. The topics addressed in these templates are Average Supplier Procurement Cycle, Average Supplier Procurement Cycle . All the content presented in this PPT design is completely editable. Download it and make adjustments in color, background, font etc. as per your unique business setting.

Global Research And Development Spending By Industrial Sector Portrait PDF
This slide showcases the percentage amount spent in different industries on research and development. Key industries energy, industrial, chemicals, communications, financial, healthcare, information technology etc. Showcasing this set of slides titled Global Research And Development Spending By Industrial Sector Portrait PDF. The topics addressed in these templates are Automobiles Other Transport, Hardware, Financial. All the content presented in this PPT design is completely editable. Download it and make adjustments in color, background, font etc. as per your unique business setting.

Foreign Sales By Geographic Contribution By Region Statistics Information PDF
This slide illustrates graphical representation of sales contribution of countries. It includes table showing total revenue generated by countries and percentage contribution to the whole. Showcasing this set of slides titled Foreign Sales By Geographic Contribution By Region Statistics Information PDF. The topics addressed in these templates are Region Statistics, Geographic Contribution, Foreign Sales. All the content presented in this PPT design is completely editable. Download it and make adjustments in color, background, font etc. as per your unique business setting.
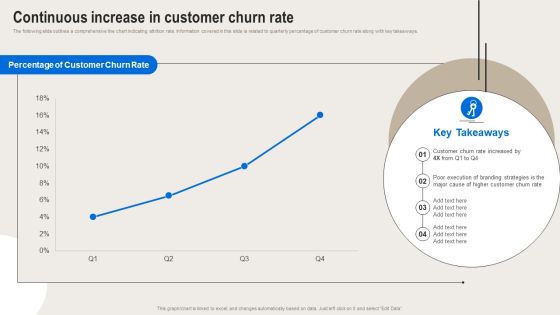
Formulating Branding Strategy To Enhance Revenue And Sales Continuous Increase In Customer Churn Rate Themes PDF
The following slide outlines a comprehensive line chart indicating attrition rate. Information covered in this slide is related to quarterly percentage of customer churn rate along with key takeaways. Boost your pitch with our creative Formulating Branding Strategy To Enhance Revenue And Sales Continuous Increase In Customer Churn Rate Themes PDF. Deliver an awe-inspiring pitch that will mesmerize everyone. Using these presentation templates you will surely catch everyones attention. You can browse the ppts collection on our website. We have researchers who are experts at creating the right content for the templates. So you do not have to invest time in any additional work. Just grab the template now and use them.
Project Error Tracking KPI Dashboard Themes PDF
This slide illustrates the dashboard for the project issue tracking and management. It includes the column chart for issues assignee, incomplete issues by priority and project, monthly percentage increase in issues created and closed, etc. Pitch your topic with ease and precision using this Project Error Tracking KPI Dashboard Themes PDF. This layout presents information on Issues Assignee, Issue Status, Incomplete Issues. It is also available for immediate download and adjustment. So, changes can be made in the color, design, graphics or any other component to create a unique layout.
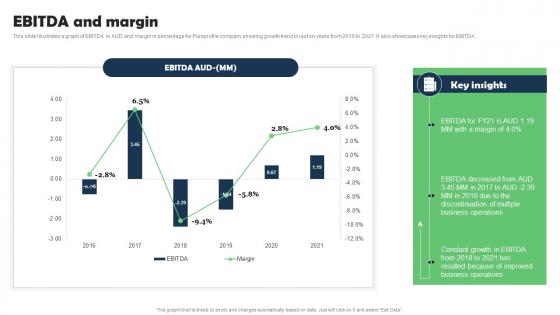
EBITDA And Margin Marketing Research Services Management Business Information Pdf
This slide illustrates a graph of EBITDA in AUD and margin in percentage for Pureprofile company showing growth trend in last six years from 2016 to 2021. It also showcases key insights for EBITDA. Whether you have daily or monthly meetings, a brilliant presentation is necessary. EBITDA And Margin Marketing Research Services Management Business Information Pdf can be your best option for delivering a presentation. Represent everything in detail using EBITDA And Margin Marketing Research Services Management Business Information Pdf and make yourself stand out in meetings. The template is versatile and follows a structure that will cater to your requirements. All the templates prepared by Slidegeeks are easy to download and edit. Our research experts have taken care of the corporate themes as well. So, give it a try and see the results.

Program Management Report With Activity And Tasks Dashboard Ppt File Objects PDF
This slide covers the programme status of the project with the activities and completion percentage of the same. It also shows the outstanding tasks and the monthly status with various graphs. Pitch your topic with ease and precision using this Program Management Report With Activity And Tasks Dashboard Ppt File Objects PDF. This layout presents information on Activity, Team Management, Time Tracking. It is also available for immediate download and adjustment. So, changes can be made in the color, design, graphics or any other component to create a unique layout.

Optimizing Ecommerce Marketing Plan To Improve Sales Increase In Potential Leads Of Company Background PDF
This slide shows the bar graph that represents the potential leads of the company in six consecutive years which depicts the increase in percentage of online leads. Deliver an awe inspiring pitch with this creative Optimizing Ecommerce Marketing Plan To Improve Sales Increase In Potential Leads Of Company Background PDF bundle. Topics like E Commerce Marketing Plan, Potential Leads Of Company can be discussed with this completely editable template. It is available for immediate download depending on the needs and requirements of the user.
Multiple Projects Progress Tracking Report Tracking Report With Bar Graph Information PDF
This slide shows the status report of various projects in order to help the project manager to track their performance. It includes project names, no.of tasks, start and end date, days taken for completion, progress and remaining percentage of projects.Showcasing this set of slides titled Multiple Projects Progress Tracking Report Tracking Report With Bar Graph Information PDF. The topics addressed in these templates are Multiple Projects, Progress Tracking, Report Tracking Report. All the content presented in this PPT design is completely editable. Download it and make adjustments in color, background, font etc. as per your unique business setting.

Operational Changes Done By The Restaurants For Their Survival Diagrams PDF
Mentioned slide provides information on the operational changes done by the restaurant operators in order to survive during the pandemic. Here the graph shows that 51 percentage of the restaurants re trained their staff to ensure food safety. Deliver an awe inspiring pitch with this creative operational changes done by the restaurants for their survival diagrams pdf bundle. Topics like business, services, key takeaways can be discussed with this completely editable template. It is available for immediate download depending on the needs and requirements of the user.

Digitalization Plan For Business Modernization Digital Transformation Change Management Dashboard Infographics PDF
Purpose of the following slide is to show the digital transformation change management dashboard as it highlights the percentage of digital transformation and the transformation one by priority. Deliver and pitch your topic in the best possible manner with this digitalization plan for business modernization digital transformation change management dashboard infographics pdf. Use them to share invaluable insights on transformation by priority, percent age of digital transformation and impress your audience. This template can be altered and modified as per your expectations. So, grab it now.
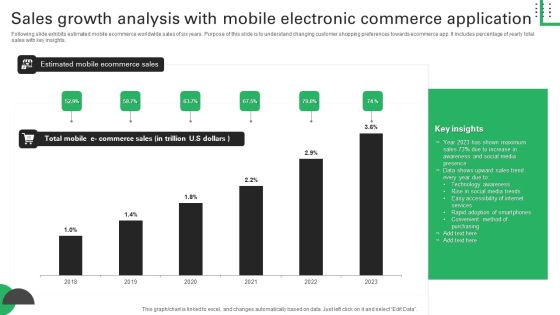
Sales Growth Analysis With Mobile Electronic Commerce Application Structure PDF
Following slide exhibits estimated mobile ecommerce worldwide sales of six years. Purpose of this slide is to understand changing customer shopping preferences towards ecommerce app. It includes percentage of yearly total sales with key insights. Pitch your topic with ease and precision using this Sales Growth Analysis With Mobile Electronic Commerce Application Structure PDF. This layout presents information on Shown Maximum, Awareness Social Media, Accessibility Internet. It is also available for immediate download and adjustment. So, changes can be made in the color, design, graphics or any other component to create a unique layout.
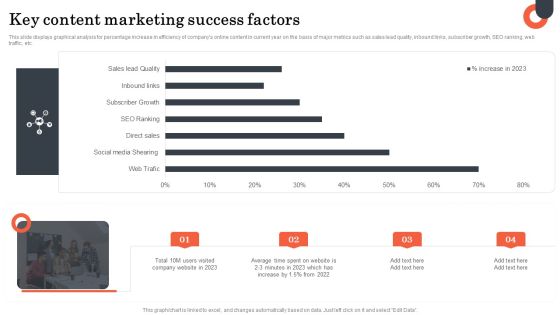
Key Content Marketing Success Factors Microsoft PDF
This slide displays graphical analysis for percentage increase in efficiency of companys online content in current year on the basis of major metrics such as sales lead quality, inbound links, subscriber growth, SEO ranking, web traffic, etc. Pitch your topic with ease and precision using this Key Content Marketing Success Factors Microsoft PDF. This layout presents information on Key Content, Marketing Success Factors. It is also available for immediate download and adjustment. So, changes can be made in the color, design, graphics or any other component to create a unique layout.
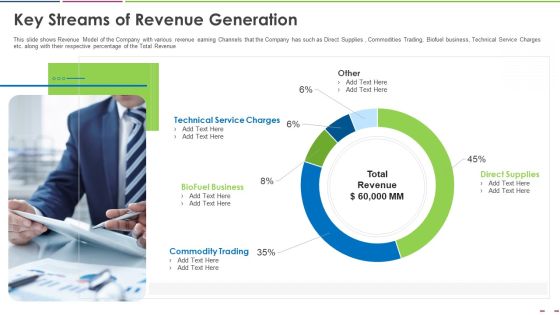
Investor Deck To Increase Grant Funds From Public Corporation Key Streams Of Revenue Generation Guidelines PDF
This slide shows Revenue Model of the Company with various revenue earning Channels that the Company has such as Direct Supplies , Commodities Trading, Biofuel business, Technical Service Charges etc. along with their respective percentage of the Total Revenue. Deliver an awe-inspiring pitch with this creative investor deck to increase grant funds from public corporation key streams of revenue generation guidelines pdf. bundle. Topics like technical service charges, biofuel business, commodity trading, direct supplies can be discussed with this completely editable template. It is available for immediate download depending on the needs and requirements of the user.

Tactical Procedure For Increasing Customer Intimacy Product And Customer Service Review In Market Microsoft PDF
Below slide highlights review statistics related to existing products and services of company. It shows percentage of customers distribution who like or dislike company product and services. Deliver and pitch your topic in the best possible manner with this tactical procedure for increasing customer intimacy product and customer service review in market microsoft pdf. Use them to share invaluable insights on service experience review, product experience review and impress your audience. This template can be altered and modified as per your expectations. So, grab it now.

Deployment Of Process Automation To Increase Organisational Performance Major Players Of Global Workflow Themes PDF
This slide showcases the comparison of market share percentage among the major player of workflow automation market. It includes companies such as IBM, oracle, Ipsoft, Bizagi, newgen software technology, etc. Take your projects to the next level with our ultimate collection of Deployment Of Process Automation To Increase Organisational Performance Major Factors Of Implementing Workflow Information PDF. Slidegeeks has designed a range of layouts that are perfect for representing task or activity duration, keeping track of all your deadlines at a glance. Tailor these designs to your exact needs and give them a truly corporate look with your own brand colors they will make your projects stand out from the rest.

Big Strategic Database Driven Management Objectives Achievement Statistics Professional PDF
This slide covers different stats on data driven culture business goals. It also includes percentage value of goals achieved from management and analysis of big data, statistics on competitive advantage, improve profitability, etc.Showcasing this set of slides titled Big Strategic Database Driven Management Objectives Achievement Statistics Professional PDF. The topics addressed in these templates are Gain Competitive, Driving Increased, Revenue Opportunities. All the content presented in this PPT design is completely editable. Download it and make adjustments in color, background, font etc. as per your unique business setting.
Strategic Brand Promotion For Enhanced Recognition And Revenue Growth Breakdown Of Product Marketing Budget Icons PDF
This slide shows the breakdown of various product marketing channels along with the total budget, amount spend on each channel and percentage for the particular year. Find a pre designed and impeccable Strategic Brand Promotion For Enhanced Recognition And Revenue Growth Breakdown Of Product Marketing Budget Icons PDF. The templates can ace your presentation without additional effort. You can download these easy to edit presentation templates to make your presentation stand out from others. So, what are you waiting for Download the template from Slidegeeks today and give a unique touch to your presentation.

Key Challenges Faced By The Company At Each Stage Sales Funnel Management Strategies To Increase Sales Background PDF
This slide shows the major challenges faced by the company ate different stages of sales funnel. Key challenges mentioned in the slide are lengthy sales cycle, lack of qualified leads, low closing rate etc.Deliver an awe inspiring pitch with this creative Key Challenges Faced By The Company At Each Stage Sales Funnel Management Strategies To Increase Sales Background PDF bundle. Topics like Percentage Challenges, Faced Stage, Sales Pipeline can be discussed with this completely editable template. It is available for immediate download depending on the needs and requirements of the user.

Providing Electronic Financial Services To Existing Consumers Mobile Subscribers Projection Demonstration PDF
Mentioned slide shows informational stats about mobile subscribers and tele density growth for five years. The graph depicts that Total mobile subscription for MFS will get increased by 84 percentage in 2026. Deliver an awe inspiring pitch with this creative Providing Electronic Financial Services To Existing Consumers Mobile Subscribers Projection Demonstration PDF bundle. Topics like Mobile Subscribers Projection And Tele Density Growth can be discussed with this completely editable template. It is available for immediate download depending on the needs and requirements of the user.
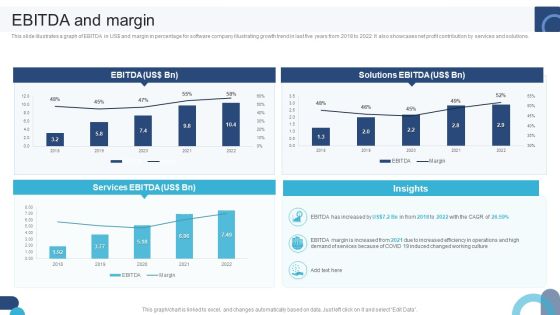
Digital Application Software Development Business Profile EBITDA And Margin Guidelines PDF
This slide illustrates a graph of EBITDA in US dollar and margin in percentage for software company illustrating growth trend in last five years from 2018 to 2022. It also showcases net profit contribution by services and solutions. If your project calls for a presentation, then Slidegeeks is your go-to partner because we have professionally designed, easy-to-edit templates that are perfect for any presentation. After downloading, you can easily edit Digital Application Software Development Business Profile EBITDA And Margin Guidelines PDF and make the changes accordingly. You can rearrange slides or fill them with different images. Check out all the handy templates
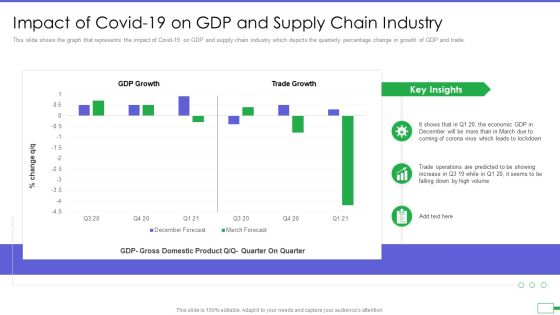
Iot And Digital Twin To Reduce Costs Post Covid Impact Of Covid 19 On Gdp And Supply Chain Industry Ideas PDF
This slide shows the graph that represents the impact of Covid 19 on GDP and supply chain industry which depicts the quarterly percentage change in growth of GDP and trade. Deliver an awe inspiring pitch with this creative iot and digital twin to reduce costs post covid impact of covid 19 on gdp and supply chain industry ideas pdf bundle. Topics like impact of covid 19 on gdp and supply chain industry can be discussed with this completely editable template. It is available for immediate download depending on the needs and requirements of the user.
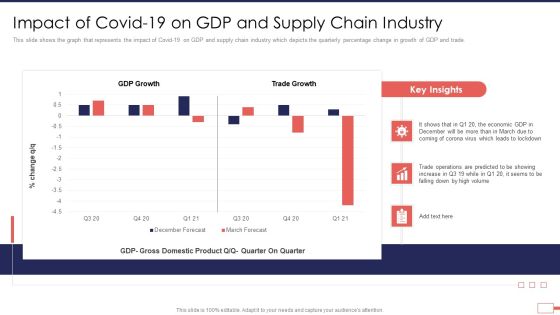
Iot Digital Twin Technology Post Covid Expenditure Management Impact Of Covid 19 On GDP And Supply Chain Industry Designs PDF
This slide shows the graph that represents the impact of Covid-19 on GDP and supply chain industry which depicts the quarterly percentage change in growth of GDP and trade. Deliver an awe inspiring pitch with this creative iot digital twin technology post covid expenditure management impact of covid 19 on gdp and supply chain industry designs pdf bundle. Topics like impact of covid 19 on gdp and supply chain industry can be discussed with this completely editable template. It is available for immediate download depending on the needs and requirements of the user.
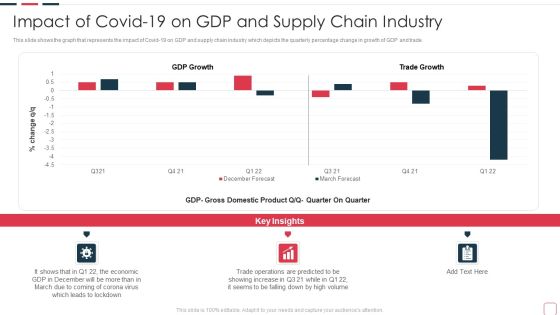
Price Benefit Internet Things Digital Twins Execution After Covid Impact Of Covid 19 On GDP Professional PDF
This slide shows the graph that represents the impact of Covid 19 on GDP and supply chain industry which depicts the quarterly percentage change in growth of GDP and trade. Deliver an awe inspiring pitch with this creative price benefit internet things digital twins execution after covid impact of covid 19 on gdp professional pdf bundle. Topics like impact of covid 19 on gdp and supply chain industry can be discussed with this completely editable template. It is available for immediate download depending on the needs and requirements of the user.
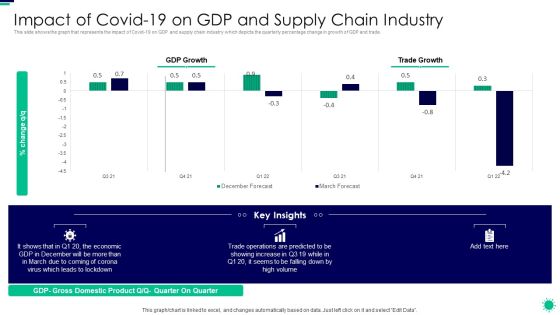
Purpose Digital Twin Internet Things Reducing Costs After COVID Era Impact Of Covid 19 On GDP Microsoft PDF
This slide shows the graph that represents the impact of Covid 19 on GDP and supply chain industry which depicts the quarterly percentage change in growth of GDP and trade. Deliver and pitch your topic in the best possible manner with this purpose digital twin internet things reducing costs after covid era impact of covid 19 on gdp microsoft pdf. Use them to share invaluable insights on impact of covid 19 on gdp and supply chain industry and impress your audience. This template can be altered and modified as per your expectations. So, grab it now.

Minimizing Operational Cost Through Iot Virtual Twins Implementation Impact Of Covid 19 On Healthcare Microsoft PDF
This slide shows the graph that represents the impact of Covid 19 on GDP and supply chain industry which depicts the quarterly percentage change in growth of GDP and trade. Deliver and pitch your topic in the best possible manner with this minimizing operational cost through iot virtual twins implementation impact of covid 19 on healthcare microsoft pdf. Use them to share invaluable insights on costs, pandemic, expenditures and impress your audience. This template can be altered and modified as per your expectations. So, grab it now.
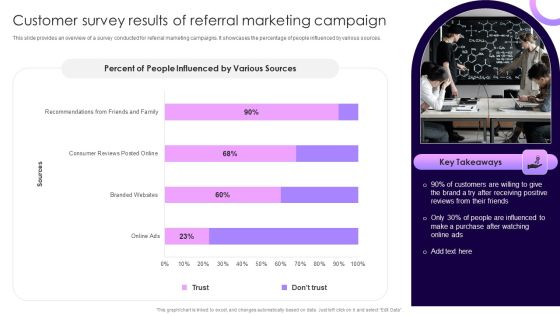
Traditional Marketing Guide To Increase Audience Engagement Customer Survey Results Of Referral Marketing Campaign Summary PDF
This slide provides an overview of a survey conducted for referral marketing campaigns. It showcases the percentage of people influenced by various sources. Take your projects to the next level with our ultimate collection of Traditional Marketing Guide To Increase Audience Engagement Customer Survey Results Of Referral Marketing Campaign Summary PDF. Slidegeeks has designed a range of layouts that are perfect for representing task or activity duration, keeping track of all your deadlines at a glance. Tailor these designs to your exact needs and give them a truly corporate look with your own brand colors they will make your projects stand out from the rest.

Technology Investment To Enhance Business Growth Service Level Perceptions Asset Managers Versus Buyers Topics PDF
Following slide illustrates information about service level perceptions of asset managers versus buyers. It shows that on an average, customer rate the service level 14 percentage lower than the perception of asset managers. Deliver and pitch your topic in the best possible manner with this Technology Investment To Enhance Business Growth Service Level Perceptions Asset Managers Versus Buyers Topics PDF. Use them to share invaluable insights on Service Level Perceptions, Asset Managers Versus Buyers and impress your audience. This template can be altered and modified as per your expectations. So, grab it now.
Project Performance Dashboard With Tracking And Control Phase Background PDF
Following slide exhibits project performance dashboard with monitoring and control phase which can be used by project managers to review the overall project. It includes metrics like project cost performance, project performance, time vs project phase and percentage of project phase completed. Pitch your topic with ease and precision using this Project Performance Dashboard With Tracking And Control Phase Background PDF This layout presents information on Earned Value, Project Cost Performance, Project Performance. It is also available for immediate download and adjustment. So, changes can be made in the color, design, graphics or any other component to create a unique layout.

Human Resource Agenda Planning Top Priority Areas Sample PDF
This slide shows top most priority areas for planning HR agenda and budget allocation in organized way. It include crucial areas of HR agenda with concerned percentage and key insights etc. Showcasing this set of slides titled Human Resource Agenda Planning Top Priority Areas Sample PDF Sample. The topics addressed in these templates are Employee Workplace, Employee Engagement, Budget Allocation. All the content presented in this PPT design is completely editable. Download it and make adjustments in color, background, font etc. as per your unique business setting.
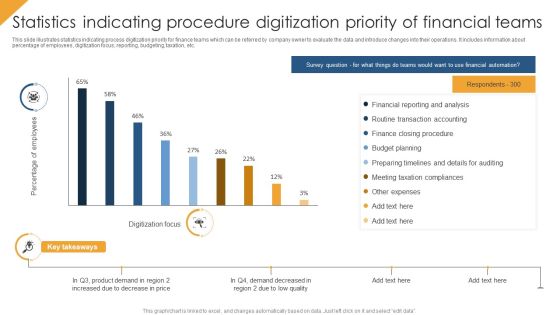
Statistics Indicating Procedure Digitization Priority Of Financial Teams Themes PDF
This slide illustrates statistics indicating process digitization priority for finance teams which can be referred by company owner to evaluate the data and introduce changes into their operations. It includes information about percentage of employees, digitization focus, reporting, budgeting, taxation, etc. Showcasing this set of slides titled Statistics Indicating Procedure Digitization Priority Of Financial Teams Themes PDF. The topics addressed in these templates are Budget Planning, Financial Reporting And Analysis, Other Expenses. All the content presented in this PPT design is completely editable. Download it and make adjustments in color, background, font etc. as per your unique business setting.
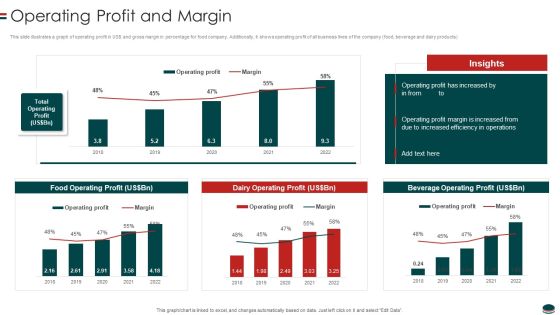
Instant Snacks And Food Firm Details Operating Profit And Margin Themes PDF
This slide illustrates a graph of operating profit in US and gross margin in percentage for food company. Additionally, it shows operating profit of all business lines of the company food, beverage and dairy products.Deliver an awe inspiring pitch with this creative Instant Snacks And Food Firm Details Operating Profit And Margin Themes PDF bundle. Topics like Operating Profit, Increased Efficiency, Beverage Operating can be discussed with this completely editable template. It is available for immediate download depending on the needs and requirements of the user.

Employee Survey Results For Flexible Work Advantages Ppt Infographic Template Guidelines PDF
This slide shows the percentage wise results of survey conducted for employees regarding the advantages of flexible working culture. It includes main categories of adjustable work schedule, no travelling, family time and other advantages such as work life balance and focusing on physical health etc. Pitch your topic with ease and precision using this Employee Survey Results For Flexible Work Advantages Ppt Infographic Template Guidelines PDF. This layout presents information on Key Insights, Family Time, Adjustable Work Schedule, No Travelling. It is also available for immediate download and adjustment. So, changes can be made in the color, design, graphics or any other component to create a unique layout.

Customer Survey Results Of Referral Marketing Campaign Themes PDF
This slide provides an overview of a survey conducted for referral marketing campaigns. It showcases the percentage of people influenced by various sources. If your project calls for a presentation, then Slidegeeks is your go-to partner because we have professionally designed, easy-to-edit templates that are perfect for any presentation. After downloading, you can easily edit Customer Survey Results Of Referral Marketing Campaign Themes PDF and make the changes accordingly. You can rearrange slides or fill them with different images. Check out all the handy templates
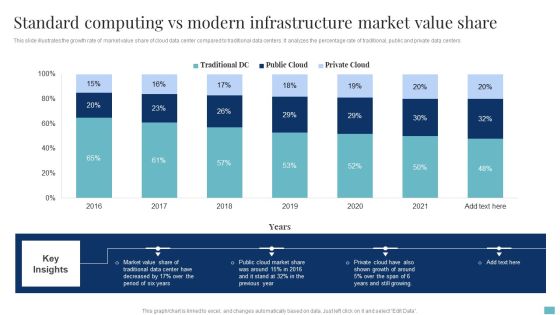
Standard Computing Vs Modern Infrastructure Market Value Share Brochure PDF
This slide illustrates the growth rate of market value share of cloud data center compared to traditional data centers. It analyzes the percentage rate of traditional, public and private data centers. Pitch your topic with ease and precision using this Standard Computing Vs Modern Infrastructure Market Value Share Brochure PDF. This layout presents information on Cloud Market Share, Market Value Share, Growth. It is also available for immediate download and adjustment. So, changes can be made in the color, design, graphics or any other component to create a unique layout.

Customer Survey Results Of Referral Promotional Program Campaign Diagrams PDF
This slide provides an overview of a survey conducted for referral marketing campaigns. It showcases the percentage of people influenced by various sources. Slidegeeks is one of the best resources for PowerPoint templates. You can download easily and regulate Customer Survey Results Of Referral Promotional Program Campaign Diagrams PDF for your personal presentations from our wonderful collection. A few clicks is all it takes to discover and get the most relevant and appropriate templates. Use our Templates to add a unique zing and appeal to your presentation and meetings. All the slides are easy to edit and you can use them even for advertisement purposes.

KPI Dashboard To Track Sales And Operations Process Of Manufacturing Enterprise Brochure PDF
This slide depicts a dashboard to track the key performance metrics in sales and operations process of a manufacturing enterprise to analyze deviations in the actual and planned output. The key performing indicators are percentage deviation, dollar deviation, inventory in hand etc.Pitch your topic with ease and precision using this KPI Dashboard To Track Sales And Operations Process Of Manufacturing Enterprise Brochure PDF. This layout presents information on Planned Output, Yearly Growth, Inventory Hand. It is also available for immediate download and adjustment. So, changes can be made in the color, design, graphics or any other component to create a unique layout.
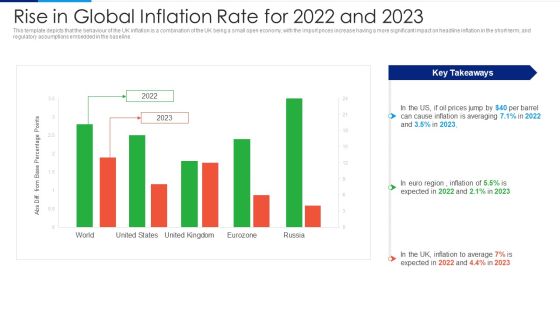
Russia Ukraine Conflict Effect Rise In Global Inflation Rate For 2022 And 2023 Diagrams PDF
This template depicts that the behaviour of the UK inflation is a combination of the UK being a small open economy, with the import prices increase having a more significant impact on headline inflation in the short-term, and regulatory assumptions embedded in the baseline. Deliver and pitch your topic in the best possible manner with this Russia Ukraine Conflict Effect Rise In Global Inflation Rate For 2022 And 2023 Diagrams PDF. Use them to share invaluable insights on Inflation To Average, 2022 To 2023, Abs Diff From Base Percentage Points and impress your audience. This template can be altered and modified as per your expectations. So, grab it now.
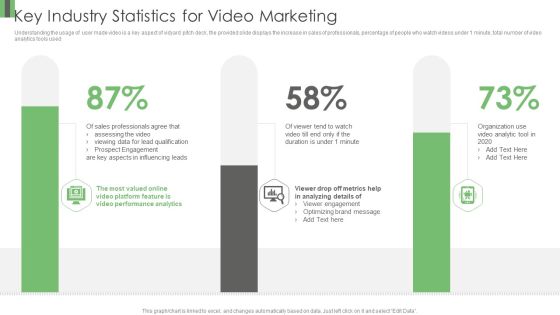
Vidyard Elevator Funding Key Industry Statistics For Video Marketing Ppt Show Diagrams PDF
Understanding the usage of user made video is a key aspect of vidyard pitch deck, the provided slide displays the increase in sales of professionals, percentage of people who watch videos under 1 minute, total number of video analytics tools used . Deliver an awe inspiring pitch with this creative Vidyard Elevator Funding Key Industry Statistics For Video Marketing Ppt Show Diagrams PDF bundle. Topics like Sales Professionals Agree, Prospect Engagement, Valued Online can be discussed with this completely editable template. It is available for immediate download depending on the needs and requirements of the user.

Customer Service Metrics Dashboard With Net Retention Rate Sample PDF
This slide showcases KPI dashboard for customer service that can help to compare the customer churn rate, revenue churn rate, net retention rate and MRR growth rate as compared to previous month. Its key elements are net promoter score, loyal customer rate, percentage of premium users and customer lifetime value. Pitch your topic with ease and precision using this Customer Service Metrics Dashboard With Net Retention Rate Sample PDF. This layout presents information on Loyal Customer Rate, Premium Users, Customer Lifetime Value. It is also available for immediate download and adjustment. So, changes can be made in the color, design, graphics or any other component to create a unique layout.
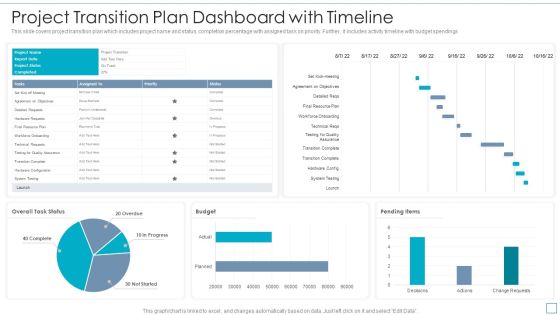
Project Transition Plan Dashboard With Timeline Topics PDF
This slide covers project transition plan which includes project name and status, completion percentage with assigned task on priority. Further, it includes activity timeline with budget spendings. Pitch your topic with ease and precision using this Project Transition Plan Dashboard With Timeline Topics PDF. This layout presents information on Budget, System Testing, Testing For Quality Assurance. It is also available for immediate download and adjustment. So, changes can be made in the color, design, graphics or any other component to create a unique layout.
Net Profit And Margin IT Software Development Company Profile Icons PDF
This slide illustrates a graph of net profit in US doller and net margin in percentage for IT company illustrating growth trend in last five years from 2018 to 2022. It also showcases net profit contribution by services and solutions. Deliver an awe inspiring pitch with this creative Net Profit And Margin IT Software Development Company Profile Icons PDF bundle. Topics like Net Profit, Net Profit Margin can be discussed with this completely editable template. It is available for immediate download depending on the needs and requirements of the user.

Dashboard To Measure Robotic Process Automation Bots Performance Structure PDF
This slide presents a dashboard to measure RPA bots performance in an organization. It includes utilization hours, bot types, average daily utilization, percentage of errors that occurred by bots, and occupied bots by business operations. If your project calls for a presentation, then Slidegeeks is your go-to partner because we have professionally designed, easy-to-edit templates that are perfect for any presentation. After downloading, you can easily edit Dashboard To Measure Robotic Process Automation Bots Performance Structure PDF and make the changes accordingly. You can rearrange slides or fill them with different images. Check out all the handy templates
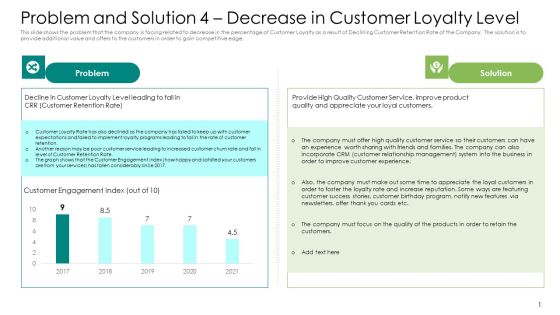
Problem And Solution 4 Decrease In Customer Loyalty Level Guidelines PDF
This slide shows the problem that the company is facing related to decrease in the percentage of Customer Loyalty as a result of Declining Customer Retention Rate of the Company. The solution is to provide additional value and offers to the customers in order to gain competitive edge.Deliver and pitch your topic in the best possible manner with this problem and solution 4 decrease in customer loyalty level guidelines pdf. Use them to share invaluable insights on problem, solution, 2017 to 2021 and impress your audience. This template can be altered and modified as per your expectations. So, grab it now.

Problem And Solution 4 Decrease In Customer Loyalty Level Ppt Picture PDF
This slide shows the problem that the company is facing related to decrease in the percentage of Customer Loyalty as a result of Declining Customer Retention Rate of the Company. The solution is to provide additional value and offers to the customers in order to gain competitive edge, Deliver and pitch your topic in the best possible manner with this problem and solution 4 decrease in customer loyalty level ppt picture pdf. Use them to share invaluable insights on customer engagement, customer retention rate, customer relationship management and impress your audience. This template can be altered and modified as per your expectations. So, grab it now.
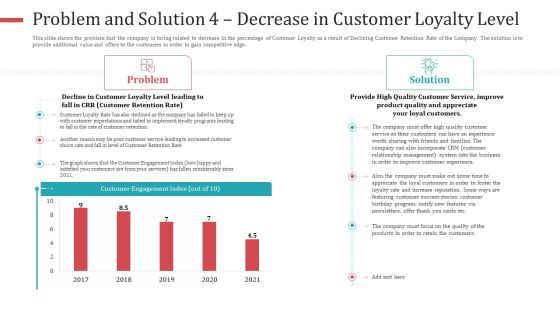
Problem And Solution 4 Decrease In Customer Loyalty Level Infographics PDF
This slide shows the problem that the company is facing related to decrease in the percentage of Customer Loyalty as a result of Declining Customer Retention Rate of the Company. The solution is to provide additional value and offers to the customers in order to gain competitive edge.Deliver an awe-inspiring pitch with this creative problem and solution 4 decrease in customer loyalty level infographics pdf. bundle. Topics like customer engagement index, 2017 to 2021 can be discussed with this completely editable template. It is available for immediate download depending on the needs and requirements of the user.

Retail Store Employee Turnover Rate And Engagement Score Analysis Retail Outlet Operations Elements PDF
This slide visually presents the information regarding the employee turnover rate and engagement score at retail store. It also list main causes behind poor scores such as dissatisfaction with pay and benefits, lack of growth opportunities etc.Deliver an awe inspiring pitch with this creative Retail Store Employee Turnover Rate And Engagement Score Analysis Retail Outlet Operations Elements PDF bundle. Topics like Employee Engagement, Identified Causes, Percentage Employees can be discussed with this completely editable template. It is available for immediate download depending on the needs and requirements of the user.
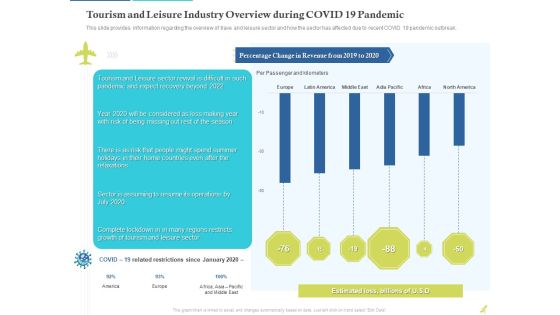
Rebuilding Travel Industry After COVID 19 Tourism And Leisure Industry Overview During COVID 19 Pandemic Diagrams PDF
This slide provides information regarding the overview of trave and leisure sector and how the sector has affected due to recent COVID 19 pandemic outbreak.Deliver an awe inspiring pitch with this creative rebuilding travel industry after COVID 19 tourism and leisure industry overview during covid 19 pandemic diagrams pdf. bundle. Topics like percentage change in revenue from 2019 to 2020, estimated loss, billions can be discussed with this completely editable template. It is available for immediate download depending on the needs and requirements of the user.
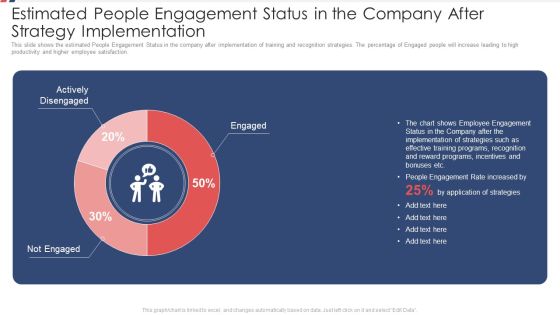
Estimated People Engagement Status In The Company After Strategy Implementation Ppt Layouts Model PDF
This slide shows the estimated People Engagement Status in the company after implementation of training and recognition strategies. The percentage of Engaged people will increase leading to high productivity and higher employee satisfaction. Deliver and pitch your topic in the best possible manner with this estimated people engagement status in the company after strategy implementation ppt layouts model pdf. Use them to share invaluable insights on implementation, reward programs, engagement rate, strategies and impress your audience. This template can be altered and modified as per your expectations. So, grab it now.

Estimated Employee Engagement Status In The Company After Strategy Implementation Introduction PDF
This slide shows the estimated Employee Engagement Status in the company after implementation of training and recognition strategies. The percentage of Engaged people will increase leading to high productivity and higher employee satisfaction. Deliver and pitch your topic in the best possible manner with this Estimated Employee Engagement Status In The Company After Strategy Implementation Introduction PDF. Use them to share invaluable insights on Training Programs, Recognition And Reward, Incentives And Bonuses and impress your audience. This template can be altered and modified as per your expectations. So, grab it now.

Complete Guide For Total Employee Involvement Strategic Approach Estimated Employee Engagement Statu Sample PDF
This slide shows the estimated Employee Engagement Status in the company after implementation of training and recognition strategies. The percentage of Engaged people will increase leading to high productivity and higher employee satisfaction.Deliver and pitch your topic in the best possible manner with this Complete Guide For Total Employee Involvement Strategic Approach Estimated Employee Engagement Statu Sample PDF Use them to share invaluable insights on Employee Engagement, Implementation Strategies, Training Programs and impress your audience. This template can be altered and modified as per your expectations. So, grab it now.

Major Risks For Public And Private Construction Projects Ppt Portfolio Deck PDF
This slide shows the various risks percentage of risk in 100 projects on the public and private projects of ABC construction company. Key Risk include changes in schedule, financial risks, credit risks, contractual risks, etc. Deliver an awe inspiring pitch with this creative major risks for public and private construction projects ppt portfolio deck pdf bundle. Topics like financial risks, technical, environment can be discussed with this completely editable template. It is available for immediate download depending on the needs and requirements of the user.
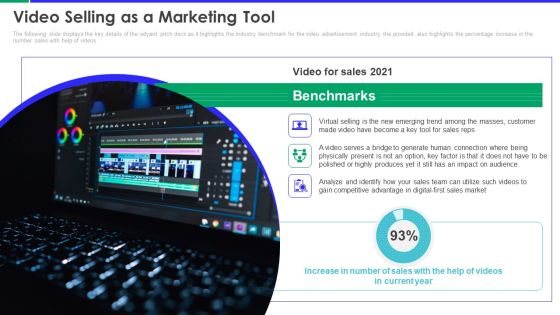
Vidyard Investor Capital Funding Elevator Pitch Deck Video Selling As A Marketing Tool Summary PDF Template PDF
The following slide displays the key details of the vidyard pitch deck as it highlights the Industry benchmark for the video advertisement industry, the provided also highlights the percentage increase in the number sales with help of videos. Deliver and pitch your topic in the best possible manner with this vidyard investor capital funding elevator pitch deck video selling as a marketing tool summary pdf template pdf. Use them to share invaluable insights on video selling as a marketing tool and impress your audience. This template can be altered and modified as per your expectations. So, grab it now.

Domestic Budget Plan Expenses Category Analysis Ppt PowerPoint Presentation Layouts Inspiration PDF
The slide shows a bar graph showing minimum and maximum percentage of spending in domestic financial management. It includes categories like food and non alcoholic, clothing and footwear, housing, water, electricity, domestic furnishing, health, transport, education, etc.Showcasing this set of slides titled Domestic Budget Plan Expenses Category Analysis Ppt PowerPoint Presentation Layouts Inspiration PDF. The topics addressed in these templates are Part Earnings, Electricity Consumptions, Least Spending. All the content presented in this PPT design is completely editable. Download it and make adjustments in color, background, font etc. as per your unique business setting.

Software Services Business Profile Gross Profit And Margin Ppt PowerPoint Presentation Gallery Templates PDF
This slide illustrates a graph of gross profit in US dollar and gross margin in percentage for software company illustrating growth trend in last five years from 2018 to 2022. It also showcases gross profit contribution by services and solutions. Deliver an awe inspiring pitch with this creative Software Services Business Profile Gross Profit And Margin Ppt PowerPoint Presentation Gallery Templates PDF bundle. Topics like Total Gross Profit, Services Gross Profit, Solutions Gross Profit can be discussed with this completely editable template. It is available for immediate download depending on the needs and requirements of the user.
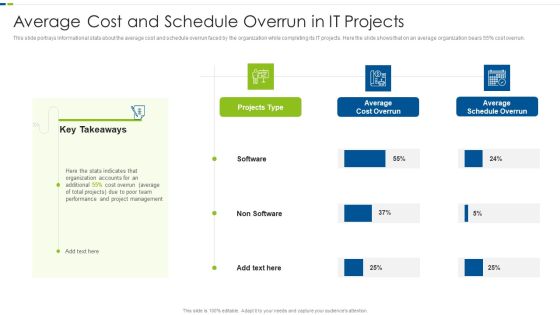
Utilizing Agile Methodology In Data Transformation Project IT Average Cost And Schedule Sample PDF
This slide portrays informational stats about the average cost and schedule overrun faced by the organization while completing its IT projects. Here the slide shows that on an average organization bears 55 percentage cost overrun. Deliver and pitch your topic in the best possible manner with this utilizing agile methodology in data transformation project it average cost and schedule sample pdf. Use them to share invaluable insights on organization, average, team, management, project and impress your audience. This template can be altered and modified as per your expectations. So, grab it now.
Tracking Goals Achievement Status Dashboard Themes PDF
This slide showcases the objective status report, which helps track current the percentage of the targets achieved and left. It also includes the number of overdue targets and unachieved departmental goals. Pitch your topic with ease and precision using this Tracking Goals Achievement Status Dashboard Themes PDF. This layout presents information on Achieved Objectives, Unachieved Objectives, Overdue. It is also available for immediate download and adjustment. So, changes can be made in the color, design, graphics or any other component to create a unique layout.

SDLC Models Applied By Industries Phases Of Software Development Procedure Mockup PDF
This slide depicts the percentage of the software development lifecycle models used by industries in 2021, including the waterfall, spiral, iterative, agile, and RAD models.This SDLC Models Applied By Industries Phases Of Software Development Procedure Mockup PDF is perfect for any presentation, be it in front of clients or colleagues. It is a versatile and stylish solution for organizing your meetings. The product features a modern design for your presentation meetings. The adjustable and customizable slides provide unlimited possibilities for acing up your presentation. Slidegeeks has done all the homework before launching the product for you. So, do not wait, grab the presentation templates today.

Instant Snacks And Food Firm Details Net Profit And Margin Microsoft PDF
This slide illustrates a graph of net profit in US and gross margin in percentage for food company. Additionally, it shows net profit of all business lines of the company food, beverage and dairy products.Deliver and pitch your topic in the best possible manner with this Instant Snacks And Food Firm Details Net Profit And Margin Microsoft PDF Use them to share invaluable insights on Profit Increased, Profit Margin, Disrupted Supply and impress your audience. This template can be altered and modified as per your expectations. So, grab it now.
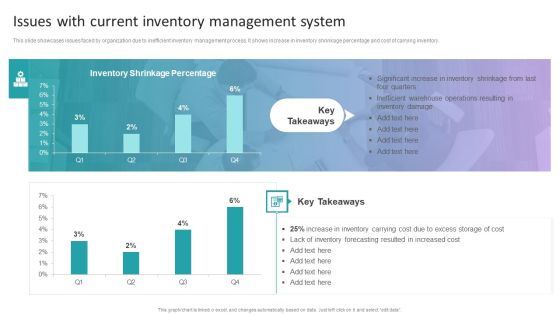
Stock Inventory Acquisition Issues With Current Inventory Management System Infographics PDF
This slide showcases issues faced by organization due to inefficient inventory management process. It shows increase in inventory shrinkage percentage and cost of carrying inventory. Slidegeeks is one of the best resources for PowerPoint templates. You can download easily and regulate Stock Inventory Acquisition Issues With Current Inventory Management System Infographics PDF for your personal presentations from our wonderful collection. A few clicks is all it takes to discover and get the most relevant and appropriate templates. Use our Templates to add a unique zing and appeal to your presentation and meetings. All the slides are easy to edit and you can use them even for advertisement purposes.

Estimated People Engagement Status In The Company After Strategy Implementation Ppt Layouts Graphic Images PDF
This slide shows the estimated People Engagement Status in the company after implementation of training and recognition strategies. The percentage of Engaged people will increase leading to high productivity and higher employee satisfaction.Deliver an awe-inspiring pitch with this creative estimated people engagement status in the company after strategy implementation ppt layouts graphic images pdf. bundle. Topics like actively disengaged 20 present, not engaged 30 present can be discussed with this completely editable template. It is available for immediate download depending on the needs and requirements of the user.

Vidyard Investor Capital Funding Elevator Pitch Deck Key Industry Statistics For Video Marketing Infographics PDF Mockup PDF
Understanding the usage of user made video is a key aspect of vidyard pitch deck, the provided slide displays the increase in sales of professionals, percentage of people who watch videos under 1 minute, total number of video analytics tools used. Deliver and pitch your topic in the best possible manner with this vidyard investor capital funding elevator pitch deck key industry statistics for video marketing infographics pdf mockup pdf. Use them to share invaluable insights on key industry statistics for video marketing and impress your audience. This template can be altered and modified as per your expectations. So, grab it now.
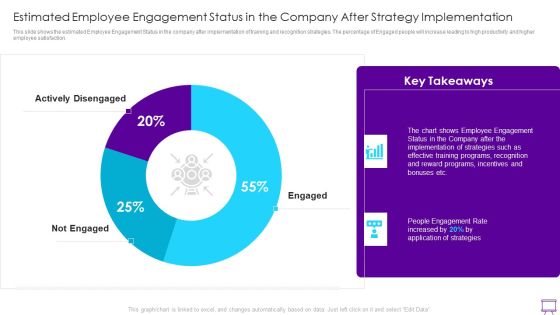
Strategies To Enhance Employee Engagement Estimated Employee Engagement Status Implementation Inspiration PDF
This slide shows the estimated Employee Engagement Status in the company after implementation of training and recognition strategies. The percentage of Engaged people will increase leading to high productivity and higher employee satisfaction.Deliver and pitch your topic in the best possible manner with this Strategies To Enhance Employee Engagement Estimated Employee Engagement Status Implementation Inspiration PDF Use them to share invaluable insights on Employee Engagement, Implementation Strategies, Effective Training and impress your audience. This template can be altered and modified as per your expectations. So, grab it now.
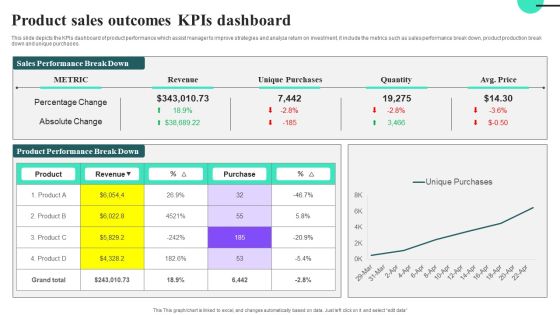
Product Sales Outcomes Kpis Dashboard Ideas PDF
This slide depicts the KPIs dashboard of product performance which assist manager to improve strategies and analyze return on investment, it include the metrics such as sales performance break down, product production break down and unique purchases.Showcasing this set of slides titled Product Sales Outcomes Kpis Dashboard Ideas PDF. The topics addressed in these templates are Percentage Change, Absolute Change. All the content presented in this PPT design is completely editable. Download it and make adjustments in color, background, font etc. as per your unique business setting.
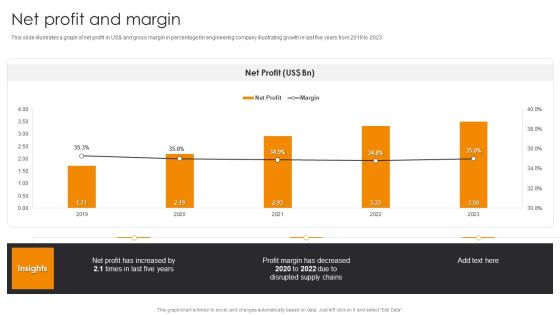
Net Profit And Margin Engineering Company Financial Analysis Report Background PDF
This slide illustrates a graph of net profit in US dollar and gross margin in percentage for engineering company illustrating growth in last five years from 2019 to 2023.Slidegeeks has constructed Net Profit And Margin Engineering Company Financial Analysis Report Background PDF after conducting extensive research and examination. These presentation templates are constantly being generated and modified based on user preferences and critiques from editors. Here, you will find the most attractive templates for a range of purposes while taking into account ratings and remarks from users regarding the content. This is an excellent jumping-off point to explore our content and will give new users an insight into our top-notch PowerPoint Templates.
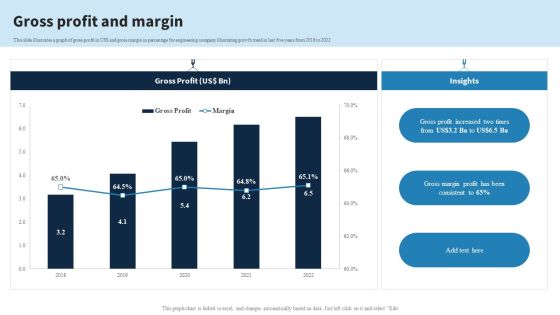
Engineering Services Company Report Gross Profit And Margin Ppt PowerPoint Presentation File Show PDF
This slide illustrates a graph of gross profit in US dollar and gross margin in percentage for engineering company illustrating growth trend in last five years from 2018 to 2022. From laying roadmaps to briefing everything in detail, our templates are perfect for you. You can set the stage with your presentation slides. All you have to do is download these easy-to-edit and customizable templates. Engineering Services Company Report Gross Profit And Margin Ppt PowerPoint Presentation File Show PDF will help you deliver an outstanding performance that everyone would remember and praise you for. Do download this presentation today.
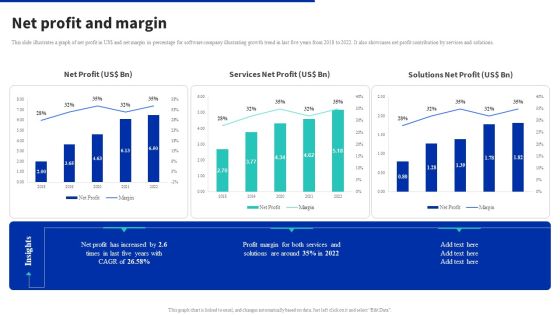
Digital Products Company Outline Net Profit And Margin Summary PDF
This slide illustrates a graph of net profit in US dollar and net margin in percentage for software company illustrating growth trend in last five years from 2018 to 2022. It also showcases net profit contribution by services and solutions. From laying roadmaps to briefing everything in detail, our templates are perfect for you. You can set the stage with your presentation slides. All you have to do is download these easy to edit and customizable templates. Digital Products Company Outline Net Profit And Margin Summary PDF will help you deliver an outstanding performance that everyone would remember and praise you for. Do download this presentation today.

Dashboard For Real Time Telemarketing Process Management Themes PDF
The following slide highlights the dashboard for real time telesales process management illustrating real time data, employee data, performance, daily data, average handled call vs average answered call, employee ranking, AHT, AvgACW, ASA and hold percentage Showcasing this set of slides titled dashboard for real time telemarketing process management themes pdf The topics addressed in these templates are dashboard for real time telemarketing process management All the content presented in this PPT design is completely editable. Download it and make adjustments in color, background, font etc. as per your unique business setting.
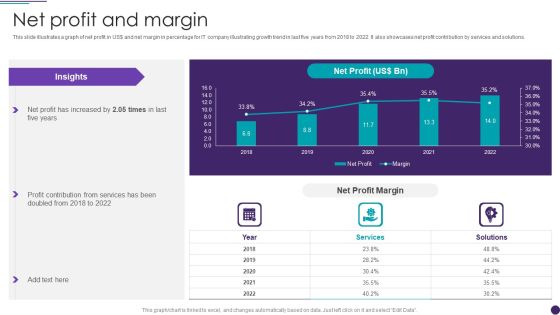
IT Services Business Profile Net Profit And Margin Sample PDF
This slide illustrates a graph of net profit in US doller and net margin in percentage for IT company illustrating growth trend in last five years from 2018 to 2022. It also showcases net profit contribution by services and solutions. Deliver and pitch your topic in the best possible manner with this IT Services Business Profile Net Profit And Margin Sample PDF. Use them to share invaluable insights on Services, Net Profit Margin and impress your audience. This template can be altered and modified as per your expectations. So, grab it now.

IT Services Business Profile Operating Profit And Margin Sample PDF
This slide illustrates a graph of operating profit in US doller and operating margin in percentage for IT company illustrating growth trend in last five years from 2018 to 2022. It also showcases operating profit contribution by services and solutions. Deliver an awe inspiring pitch with this creative IT Services Business Profile Operating Profit And Margin Sample PDF bundle. Topics like Operating Profit, Services can be discussed with this completely editable template. It is available for immediate download depending on the needs and requirements of the user.
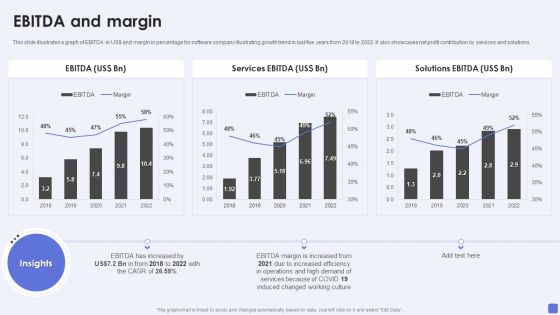
Software Services Business Profile EBITDA And Margin Ppt PowerPoint Presentation Gallery Slide Portrait PDF
This slide illustrates a graph of EBITDA in US dollar and margin in percentage for software company illustrating growth trend in last five years from 2018 to 2022. It also showcases net profit contribution by services and solutions. Deliver an awe inspiring pitch with this creative Software Services Business Profile EBITDA And Margin Ppt PowerPoint Presentation Gallery Slide Portrait PDF bundle. Topics like Services EB, Solutions EBITDA, EBITDA Margin can be discussed with this completely editable template. It is available for immediate download depending on the needs and requirements of the user.
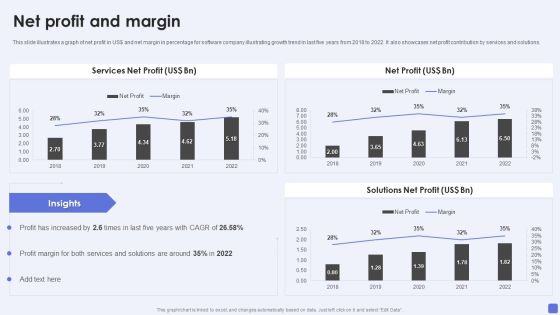
Software Services Business Profile Net Profit And Margin Ppt PowerPoint Presentation File Slides PDF
This slide illustrates a graph of net profit in US dollar and net margin in percentage for software company illustrating growth trend in last five years from 2018 to 2022. It also showcases net profit contribution by services and solutions. Deliver an awe inspiring pitch with this creative Software Services Business Profile Net Profit And Margin Ppt PowerPoint Presentation File Slides PDF bundle. Topics like Services Net Profit, Net Profit, Solutions Net Profit can be discussed with this completely editable template. It is available for immediate download depending on the needs and requirements of the user.

Software Services Business Profile Operating Profit And Margin Ppt PowerPoint Presentation Gallery Inspiration PDF
This slide illustrates a graph of operating profit in US dollar and operating margin in percentage for software company illustrating growth trend in last five years from 2018 to 2022. It also showcases operating profit contribution by services and solutions. Deliver and pitch your topic in the best possible manner with this Software Services Business Profile Operating Profit And Margin Ppt PowerPoint Presentation Gallery Inspiration PDF. Use them to share invaluable insights on Operating Profit, Services Operating Profit, Solutions Operating Profit and impress your audience. This template can be altered and modified as per your expectations. So, grab it now.

Software Products And Solutions Firm Details EBITDA And Margin Structure PDF
This slide illustrates a graph of EBITDA in US dollar and margin in percentage for software company illustrating growth trend in last five years from 2018 to 2022. It also showcases net profit contribution by services and solutions. Deliver an awe inspiring pitch with this creative Software Products And Solutions Firm Details EBITDA And Margin Structure PDF bundle. Topics like EBITDA, Services EBITDA, Solutions EBITDA, 2018 To 2022 can be discussed with this completely editable template. It is available for immediate download depending on the needs and requirements of the user.
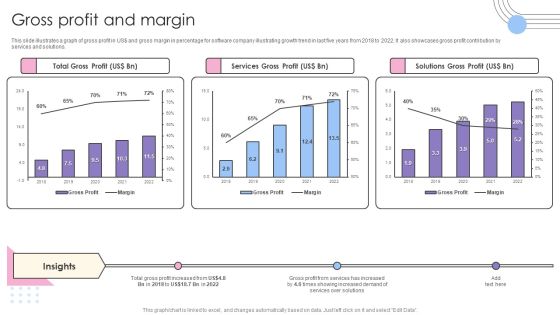
Software Products And Solutions Firm Details Gross Profit And Margin Pictures PDF
This slide illustrates a graph of gross profit in US dollar and gross margin in percentage for software company illustrating growth trend in last five years from 2018 to 2022. It also showcases gross profit contribution by services and solutions. Deliver and pitch your topic in the best possible manner with this Software Products And Solutions Firm Details Gross Profit And Margin Pictures PDF. Use them to share invaluable insights on Total Gross Profit, Services Gross Profit, Solutions Gross Profit and impress your audience. This template can be altered and modified as per your expectations. So, grab it now.

Software Products And Solutions Firm Details Net Profit And Margin Information PDF
This slide illustrates a graph of net profit in US dollar and net margin in percentage for software company illustrating growth trend in last five years from 2018 to 2022. It also showcases net profit contribution by services and solutions. Deliver and pitch your topic in the best possible manner with this Software Products And Solutions Firm Details Net Profit And Margin Information PDF. Use them to share invaluable insights on Net Profit, Services Net Profit, Solutions Net Profit and impress your audience. This template can be altered and modified as per your expectations. So, grab it now.

Software Products And Solutions Firm Details Operating Profit And Margin Mockup PDF
This slide illustrates a graph of operating profit in US dollar and operating margin in percentage for software company illustrating growth trend in last five years from 2018 to 2022. It also showcases operating profit contribution by services and solutions. Deliver an awe inspiring pitch with this creative Software Products And Solutions Firm Details Operating Profit And Margin Mockup PDF bundle. Topics like Operating Profit, Services Operating Profit, Solutions Operating Profit can be discussed with this completely editable template. It is available for immediate download depending on the needs and requirements of the user.

Business Software Development Company Profile EBITDA And Margin Summary PDF
This slide illustrates a graph of EBITDA in US dollar and margin in percentage for software company illustrating growth trend in last five years from 2018 to 2022. It also showcases net profit contribution by services and solutions. Deliver an awe inspiring pitch with this creative Business Software Development Company Profile EBITDA And Margin Summary PDF bundle. Topics like EBITDA, Services EBITDA, Solutions EBITDA can be discussed with this completely editable template. It is available for immediate download depending on the needs and requirements of the user.

Business Software Development Company Profile Gross Profit And Margin Microsoft PDF
This slide illustrates a graph of gross profit in US dollar and gross margin in percentage for software company illustrating growth trend in last five years from 2018 to 2022. It also showcases gross profit contribution by services and solutions. Deliver and pitch your topic in the best possible manner with this Business Software Development Company Profile Gross Profit And Margin Microsoft PDF. Use them to share invaluable insights on Total Gross Profit, Services Gross Profit, Solutions Gross Profit and impress your audience. This template can be altered and modified as per your expectations. So, grab it now.

Business Software Development Company Profile Net Profit And Margin Mockup PDF
This slide illustrates a graph of net profit in US dollar and net margin in percentage for software company illustrating growth trend in last five years from 2018 to 2022. It also showcases net profit contribution by services and solutions. Deliver an awe inspiring pitch with this creative Business Software Development Company Profile Net Profit And Margin Mockup PDF bundle. Topics like Net Profit, Services Net Profit, Solutions Net Profit can be discussed with this completely editable template. It is available for immediate download depending on the needs and requirements of the user.

Business Software Development Company Profile Operating Profit And Margin Summary PDF
This slide illustrates a graph of operating profit in US dollar and operating margin in percentage for software company illustrating growth trend in last five years from 2018 to 2022. It also showcases operating profit contribution by services and solutions. Deliver and pitch your topic in the best possible manner with this Business Software Development Company Profile Operating Profit And Margin Summary PDF. Use them to share invaluable insights on Operating Profit, Services Operating Profit, Solutions Operating Profit and impress your audience. This template can be altered and modified as per your expectations. So, grab it now.
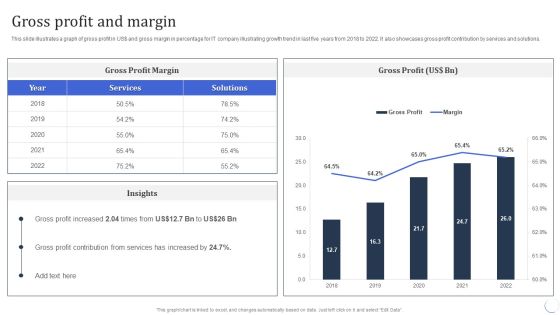
Infotech Solutions Research And Development Company Summary Gross Profit And Margin Ideas PDF
This slide illustrates a graph of gross profit in US dollar and gross margin in percentage for IT company illustrating growth trend in last five years from 2018 to 2022. It also showcases gross profit contribution by services and solutions. Deliver an awe inspiring pitch with this creative Infotech Solutions Research And Development Company Summary Gross Profit And Margin Ideas PDF bundle. Topics like Services, Gross Profit Margin can be discussed with this completely editable template. It is available for immediate download depending on the needs and requirements of the user.

Infotech Solutions Research And Development Company Summary Net Profit And Margin Information PDF
This slide illustrates a graph of net profit in US dollar and net margin in percentage for IT company illustrating growth trend in last five years from 2018 to 2022. It also showcases net profit contribution by services and solutions. Deliver and pitch your topic in the best possible manner with this Infotech Solutions Research And Development Company Summary Net Profit And Margin Information PDF. Use them to share invaluable insights on Profit Contribution, Services, Net Profit and impress your audience. This template can be altered and modified as per your expectations. So, grab it now.
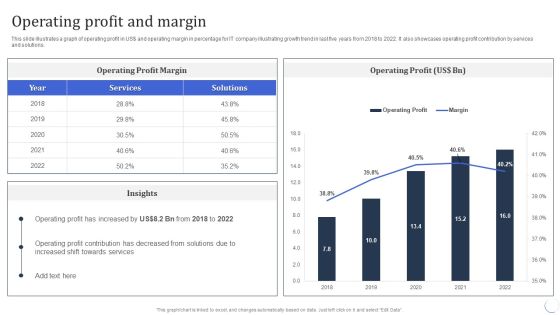
Infotech Solutions Research And Development Company Summary Operating Profit And Margin Download PDF
This slide illustrates a graph of operating profit in US dollar and operating margin in percentage for IT company illustrating growth trend in last five years from 2018 to 2022. It also showcases operating profit contribution by services and solutions. Deliver an awe inspiring pitch with this creative Infotech Solutions Research And Development Company Summary Operating Profit And Margin Download PDF bundle. Topics like Services, Operating Profit can be discussed with this completely editable template. It is available for immediate download depending on the needs and requirements of the user.
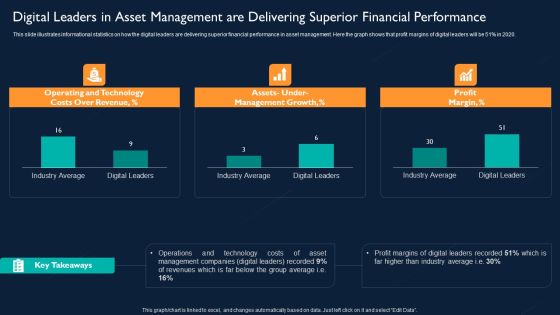
Digital Leaders In Asset Management Are Delivering Superior Financial Performance Designs PDF
This slide illustrates informational statistics on how the digital leaders are delivering superior financial performance in asset management. Here the graph shows that profit margins of digital leaders will be 51 percentage in 2020. Deliver and pitch your topic in the best possible manner with this Digital Leaders In Asset Management Are Delivering Superior Financial Performance Designs PDF. Use them to share invaluable insights on Operating And Technology Costs, Management Growth, Profit Margin and impress your audience. This template can be altered and modified as per your expectations. So, grab it now.

Pureprofile Business Overview EBITDA And Margin Ppt Gallery Sample PDF
This slide illustrates a graph of EBITDA in AUD and margin in percentage for Pureprofile company showing growth trend in last six years from 2016 to 2021. It also showcases key insights for EBITDA. Deliver and pitch your topic in the best possible manner with this Pureprofile Business Overview EBITDA And Margin Ppt Gallery Sample PDF. Use them to share invaluable insights on EBITDA Decreased, Business Operations, 2016 To 2021 and impress your audience. This template can be altered and modified as per your expectations. So, grab it now.

IT Application Services Company Outline Gross Profit And Margin Elements PDF
This slide illustrates a graph of gross profit in US dollar and gross margin in percentage for IT company illustrating growth trend in last five years from 2018 to 2022. It also showcases gross profit contribution by services and solutions. Deliver an awe inspiring pitch with this creative IT Application Services Company Outline Gross Profit And Margin Elements PDF bundle. Topics like Gross Profit Margin, Services can be discussed with this completely editable template. It is available for immediate download depending on the needs and requirements of the user.

IT Application Services Company Outline Net Profit And Margin Structure PDF
This slide illustrates a graph of net profit in US dollar and net margin in percentage for IT company illustrating growth trend in last five years from 2018 to 2022. It also showcases net profit contribution by services and solutions. Deliver and pitch your topic in the best possible manner with this IT Application Services Company Outline Net Profit And Margin Structure PDF. Use them to share invaluable insights on Net Profit Margin, Services, Margin and impress your audience. This template can be altered and modified as per your expectations. So, grab it now.
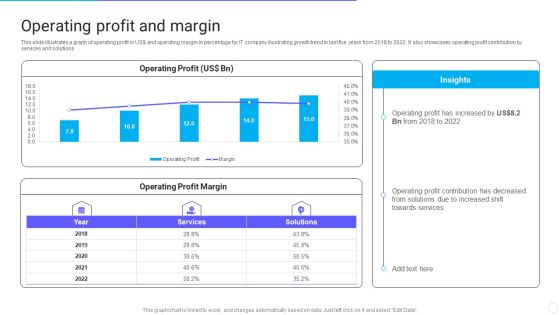
IT Application Services Company Outline Operating Profit And Margin Structure PDF
This slide illustrates a graph of operating profit in US dollar and operating margin in percentage for IT company illustrating growth trend in last five years from 2018 to 2022. It also showcases operating profit contribution by services and solutions. Deliver an awe inspiring pitch with this creative IT Application Services Company Outline Operating Profit And Margin Structure PDF bundle. Topics like Operating Profit And Margin can be discussed with this completely editable template. It is available for immediate download depending on the needs and requirements of the user.
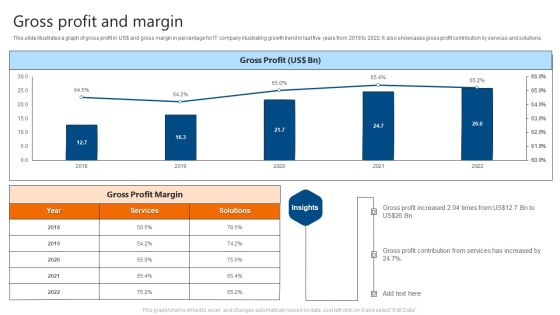
Gross Profit And Margin IT Software Development Company Profile Slides PDF
This slide illustrates a graph of gross profit in US doller and gross margin in percentage for IT company illustrating growth trend in last five years from 2018 to 2022. It also showcases gross profit contribution by services and solutions. Deliver and pitch your topic in the best possible manner with this Gross Profit And Margin IT Software Development Company Profile Slides PDF. Use them to share invaluable insights on Gross Profit, Margin and impress your audience. This template can be altered and modified as per your expectations. So, grab it now.

Operating Profit And Margin IT Software Development Company Profile Guidelines PDF
This slide illustrates a graph of operating profit in US doller and operating margin in percentage for IT company illustrating growth trend in last five years from 2018 to 2022. It also showcases operating profit contribution by services and solutions. Deliver and pitch your topic in the best possible manner with this Operating Profit And Margin IT Software Development Company Profile Guidelines PDF. Use them to share invaluable insights on Operating Profit, Operating Profit Margin and impress your audience. This template can be altered and modified as per your expectations. So, grab it now.

Six Sigma Methodologies For Process Optimization Low Productivity Faced By The Business Sample PDF
This slide demonstrates the issue of low productivity faced by the business, which has been declining since 2018 continuously and has been less than 1 percentage each year. Showcasing this set of slides titled Six Sigma Methodologies For Process Optimization Low Productivity Faced By The Business Sample PDF. The topics addressed in these templates are Annual Productivity Growth, Low Productivity Faced. All the content presented in this PPT design is completely editable. Download it and make adjustments in color, background, font etc. as per your unique business setting.

Emerging Technology Selling Forecasts Report Clipart PDF
This slide covers sales projections for consumer tech products. It includes unit sales for devices such wearable devices, smart speakers, smart home, 4K ultra televisions, virtual reality devices and drones along with percentage of unit sales growth and revenue projections. Showcasing this set of slides titled Emerging Technology Selling Forecasts Report Clipart PDF. The topics addressed in these templates are Emerging Technology Selling Forecasts, Market. All the content presented in this PPT design is completely editable. Download it and make adjustments in color, background, font etc. as per your unique business setting.

Big Latest Facts About Data Market In IT Industry Pictures PDF
This slide covers big data market trends and analytics in IT industries. It involves percentage of growth over years, third party platforms and challenges to deliver successful business analytics solutions. Showcasing this set of slides titled Big Latest Facts About Data Market In IT Industry Pictures PDF. The topics addressed in these templates are Unskilled Workforce, Data Integration, Data Quality Management. All the content presented in this PPT design is completely editable. Download it and make adjustments in color, background, font etc. as per your unique business setting.

Drone Service Company Investor Funding Elevator Pitch Deck Financial Projections Structure PDF
The slide outlines the financial projections of the company containing estimated revenue growth and expected percentage of decline in business expenditures. This modern and well arranged Drone Service Company Investor Funding Elevator Pitch Deck Financial Projections Structure PDF provides lots of creative possibilities. It is very simple to customize and edit with the Powerpoint Software. Just drag and drop your pictures into the shapes. All facets of this template can be edited with Powerpoint no extra software is necessary. Add your own material, put your images in the places assigned for them, adjust the colors, and then you can show your slides to the world, with an animated slide included.
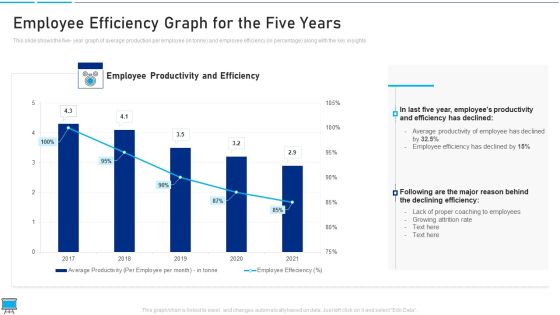
Performance Training Action Plan And Extensive Strategies Employee Efficiency Graph For The Five Years Guidelines PDF
This slide shows the five year graph of average production per employee in tonne and employee efficiency in percentage along with the key insights Deliver and pitch your topic in the best possible manner with this performance training action plan and extensive strategies employee efficiency graph for the five years guidelines pdf Use them to share invaluable insights on declining efficiency, proper coaching to employees, employee efficiency and impress your audience. This template can be altered and modified as per your expectations. So, grab it now.
Skill Development Training To Strengthen Employee Performance Employee Efficiency Graph For The Five Years Icons PDF
This slide shows the five- year graph of average production per employee in tonne and employee efficiency in percentage along with the key insights. Deliver and pitch your topic in the best possible manner with this skill development training to strengthen employee performance employee efficiency graph for the five years icons pdf. Use them to share invaluable insights on employee efficiency graph for the five years and impress your audience. This template can be altered and modified as per your expectations. So, grab it now.
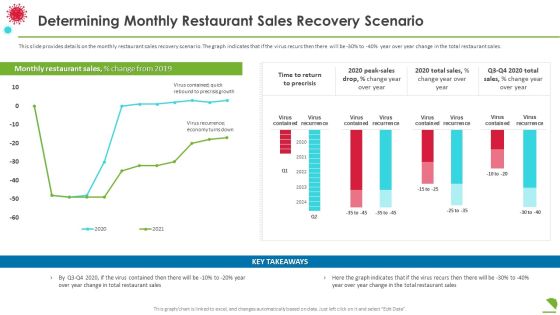
Determining Monthly Restaurant Sales Recovery Scenario Professional PDF
This slide provides details on the monthly restaurant sales recovery scenario. The graph indicates that if the virus recurs then there will be 30percentage to 40 percentage year over year change in the total restaurant sales. Deliver an awe inspiring pitch with this creative determining monthly restaurant sales recovery scenario professional pdf bundle. Topics like determining monthly restaurant sales recovery scenario can be discussed with this completely editable template. It is available for immediate download depending on the needs and requirements of the user.
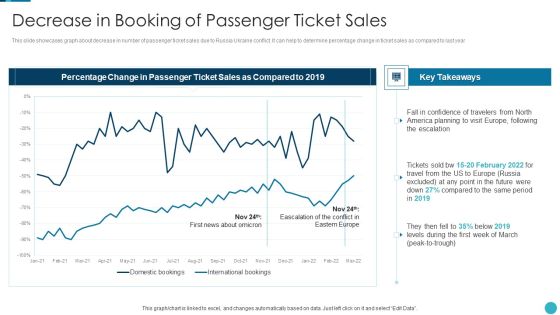
Russia Ukraine War Influence On Airline Sector Decrease In Booking Of Passenger Ticket Sales Topics PDF
This slide showcases graph about decrease in number of passenger ticket sales due to Russia Ukraine conflict. It can help to determine percentage change in ticket sales as compared to last year Deliver and pitch your topic in the best possible manner with this russia ukraine war influence on airline sector decrease in booking of passenger ticket sales topics pdf Use them to share invaluable insights on decrease in booking of passenger ticket sales and impress your audience. This template can be altered and modified as per your expectations. So, grab it now.
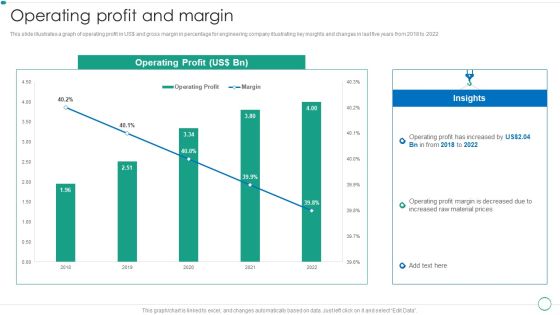
Real Estate Construction And Engineering Company Profile Operating Profit And Margin Designs PDF
This slide illustrates a graph of operating profit in US and gross margin in percentage for engineering company illustrating key insights and changes in last five years from 2018 to 2022.Deliver and pitch your topic in the best possible manner with this Real Estate Construction And Engineering Company Profile Operating Profit And Margin Designs PDF. Use them to share invaluable insights on Operating Profit, Insights, Material Prices and impress your audience. This template can be altered and modified as per your expectations. So, grab it now.

Agile Group For Product Development Action Plan For Cross Functional Product Teams Ideas PDF
This slide shows action plan for cross functional product teams which includes goal, number of completed tasks and percentage of completed goals, action, responsible person, required resources, status, etc. Deliver an awe inspiring pitch with this creative agile group for product development action plan for cross functional product teams ideas pdf bundle. Topics like salesforce account info, software subscription, survey software can be discussed with this completely editable template. It is available for immediate download depending on the needs and requirements of the user.

Success Rate Of Waterfall And Agile Project Management Approach Infographics PDF
This slide showcases the success rate of waterfall and agile methodology for project management. It presents the project success, failure and challenged percentage in waterfall and agile model approach. If your project calls for a presentation, then Slidegeeks is your go-to partner because we have professionally designed, easy-to-edit templates that are perfect for any presentation. After downloading, you can easily edit Success Rate Of Waterfall And Agile Project Management Approach Infographics PDF and make the changes accordingly. You can rearrange slides or fill them with different images. Check out all the handy templates
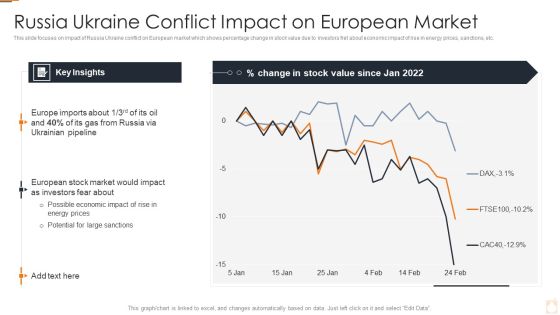
Ukraine Russia Conflict Effect On Petroleum Industry Russia Ukraine Conflict Impact Topics PDF
This slide focuses on impact of Russia Ukraine conflict on European market which shows percentage change in stock value due to investors fret about economic impact of rise in energy prices, sanctions, etc.Deliver an awe inspiring pitch with this creative Ukraine Russia Conflict Effect On Petroleum Industry Russia Ukraine Conflict Impact Topics PDF bundle. Topics like Russia Ukraine Conflict Impact On European Market can be discussed with this completely editable template. It is available for immediate download depending on the needs and requirements of the user.

Analyzing Top Reasons For Product Portfolio Failure Designs PDF
This slide displays various reasons that may contribute to product portfolio failure in new region. Most contributing factor is unclear or continuously changing product definitions which contribute 42 percentage to product failure. Deliver and pitch your topic in the best possible manner with this Analyzing Top Reasons For Product Portfolio Failure Designs PDF. Use them to share invaluable insights on Product Portfolio, Analyzing Top Reasons and impress your audience. This template can be altered and modified as per your expectations. So, grab it now.

Online Data Constraints Information Limitation Analysis For Digital Organizations Information PDF
This slide depicts the challenges faced while storing digital data. The purpose of this template is to analyze the security limitations faced in the technology industries. It also includes elements such as cyberattack, loss of devices, etc.Pitch your topic with ease and precision using this Online Data Constraints Information Limitation Analysis For Digital Organizations Information PDF. This layout presents information on Percentage Impact, Technology Industry, Security Technologies. It is also available for immediate download and adjustment. So, changes can be made in the color, design, graphics or any other component to create a unique layout.
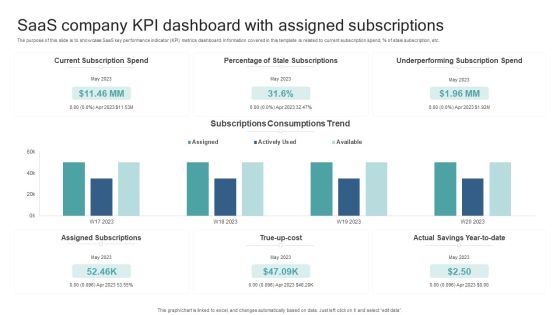
Saas Company KPI Dashboard With Assigned Subscriptions Formats PDF
The purpose of this slide is to showcase SaaS key performance indicator KPI metrics dashboard. Information covered in this template is related to current subscription spend, percent of stale subscription, etc. Pitch your topic with ease and precision using this Saas Company KPI Dashboard With Assigned Subscriptions Formats PDF. This layout presents information on Current Subscription Spend, Percentage Of Stale Subscriptions, True Up Cost, Underperforming Subscription Spend. It is also available for immediate download and adjustment. So, changes can be made in the color, design, graphics or any other component to create a unique layout.

Net Promoter Score Trends With Promoters Passives Detractors Background PDF
This slide presents NPS trend over time with percentage change in promoters, passives and detractors over four consecutive years. It includes total net promoter score for each year that highlights customer loyalty and benchmarks satisfaction level Showcasing this set of slides titled Net Promoter Score Trends With Promoters Passives Detractors Background PDF. The topics addressed in these templates are Trend, Detractors, Net. All the content presented in this PPT design is completely editable. Download it and make adjustments in color, background, font etc. as per your unique business setting.

Assuring Management In Product Innovation To Enhance Processes Action Plan For Cross Functional Product Teams Formats PDF
This slide shows action plan for cross functional product teams which includes goal, number of completed tasks and percentage of completed goals, action, responsible person, required resources, status, etc.Deliver an awe inspiring pitch with this creative assuring management in product innovation to enhance processes action plan for cross functional product teams formats pdf bundle. Topics like create weekly newsletter, inbound or outbound, adjust customer can be discussed with this completely editable template. It is available for immediate download depending on the needs and requirements of the user.
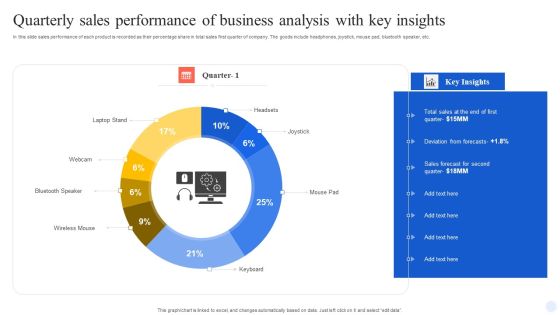
Quarterly Sales Performance Of Business Analysis With Key Insights Information PDF
In this slide sales performance of each product is recorded as their percentage share in total sales first quarter of company. The goods include headphones, joystick, mouse pad, bluetooth speaker, etc. Pitch your topic with ease and precision using this Quarterly Sales Performance Of Business Analysis With Key Insights Information PDF. This layout presents information on Wireless Mouse, Keyboard, Mouse Pad, Joystick, Headsets. It is also available for immediate download and adjustment. So, changes can be made in the color, design, graphics or any other component to create a unique layout.
Project Tracking Planned Vs Actual Project Progress Tracker Pictures PDF
The following slide highlights the variations in the project progress to manage the its and ensure timely delivery. It includes KPIs such as completion percentage and the gap in the planned versus actual hours. Pitch your topic with ease and precision using this Project Tracking Planned Vs Actual Project Progress Tracker Pictures PDF. This layout presents information on Project Tracking Planned, Project Progress Tracker. It is also available for immediate download and adjustment. So, changes can be made in the color, design, graphics or any other component to create a unique layout.

Organizational Tactical Plan Of Action Tools Usage Ppt Show Ideas PDF
This slide exhibit percentage of companies using tactical planning tools and techniques in their daily business decision making process. It includes organizations such as financial sectors, business groups, private companies, joint ventures etc. Showcasing this set of slides titled Organizational Tactical Plan Of Action Tools Usage Ppt Show Ideas PDF. The topics addressed in these templates are Mostly Used, Moderately Used, Rarely Used. All the content presented in this PPT design is completely editable. Download it and make adjustments in color, background, font etc. as per your unique business setting.

Upskill Training For Employee Performance Improvement Employee Efficiency Graph For The Five Years Summary PDF
This slide shows the five- year graph of average production per employee in tonne and employee efficiency in percentage along with the key insights. Deliver and pitch your topic in the best possible manner with this upskill training for employee performance improvement employee efficiency graph for the five years summary pdf. Use them to share invaluable insights on employee efficiency graph for the five years and impress your audience. This template can be altered and modified as per your expectations. So, grab it now.

CSR Report On Strengthening Gender Diversity Introduction PDF
This slide illustrates corporate report on one of the CSR pillars to boost gender diversity. It includes percent of women employed region wise 2023, percentage of women in global workforce etc. Pitch your topic with ease and precision using this CSR Report On Strengthening Gender Diversity Introduction PDF. This layout presents information on Targeted Programs, Strengthening Gender Diversity. It is also available for immediate download and adjustment. So, changes can be made in the color, design, graphics or any other component to create a unique layout.

Buyers Conversion Rate Of The Company Themes PDF
This slide shows a graph of the percentage of actual buyers that make purchase form the site once they visit the site. The rate has considerably gone down since 2017 due to reasons such as poor user interface, limited product categories, long waiting time, complex billing options etc. Deliver an awe-inspiring pitch with this creative buyers conversion rate of the company themes pdf. bundle. Topics like buyers conversion rate, 2016 to 2021 can be discussed with this completely editable template. It is available for immediate download depending on the needs and requirements of the user.
Technology Disaster Recovery Plan Current Situation Of The Client Company Icons PDF
This slide depicts the current situation of the client company by displaying the total number of breaches due to hacking, the number of errors, the percentage of social attacks, and so on. Deliver and pitch your topic in the best possible manner with this Technology Disaster Recovery Plan Current Situation Of The Client Company Icons PDF. Use them to share invaluable insights on Organized, Social and impress your audience. This template can be altered and modified as per your expectations. So, grab it now.
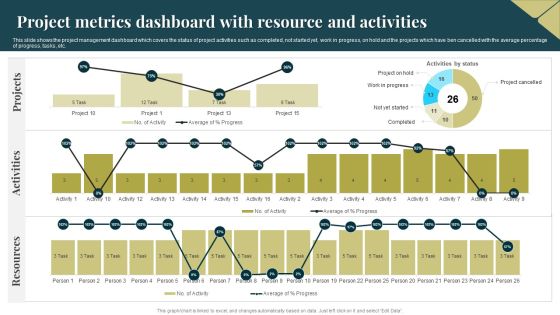
Project Metrics Dashboard With Resource And Activities Infographics PDF
This slide shows the project management dashboard which covers the status of project activities such as completed, not started yet, work in progress, on hold and the projects which have ben cancelled with the average percentage of progress, tasks, etc. Showcasing this set of slides titled Project Metrics Dashboard With Resource And Activities Infographics PDF. The topics addressed in these templates are Activities, Projects, Resources. All the content presented in this PPT design is completely editable. Download it and make adjustments in color, background, font etc. as per your unique business setting.

Virtual Customer Healthcare Trends Among Different Generations Professional PDF
The below slide depicts the consumer trends in healthcare industry. The graph includes the data for the past two years comparing the percentage of change in the virtual visits among different generations. Pitch your topic with ease and precision using this Virtual Customer Healthcare Trends Among Different Generations Professional PDF. This layout presents information on Millennial, Baby Boomers, Seniors. It is also available for immediate download and adjustment. So, changes can be made in the color, design, graphics or any other component to create a unique layout.

Buyers Conversion Rate Of The Company Diagrams PDF
This slide shows a graph of the percentage of actual buyers that make purchase form the site once they visit the site. The rate has considerably gone down since 2020 due to reasons such as poor user interface, limited product categories, long waiting time, complex billing options etc. Deliver an awe-inspiring pitch with this creative buyers conversion rate of the company diagrams pdf. bundle. Topics like buyers conversion rate, 2016 to 2021 can be discussed with this completely editable template. It is available for immediate download depending on the needs and requirements of the user.

Covid19 Impact On Consumers Behavior Towards Restaurants Diagrams PDF
Mentioned slide displays informational statistics of coronavirus impact on consumer behavior towards restaurant visits. Here the graph indicates that 32 percentage customers said that they will reduce the frequency of eating at restaurants. Deliver an awe inspiring pitch with this creative covid19 impact on consumers behavior towards restaurants diagrams pdf bundle. Topics like covid 19 impact on consumers behavior towards restaurants can be discussed with this completely editable template. It is available for immediate download depending on the needs and requirements of the user.
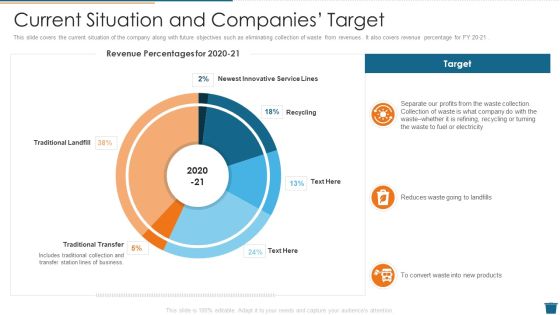
Factory Waste Management Current Situation And Companies Target Diagrams PDF
This slide covers the current situation of the company along with future objectives such as eliminating collection of waste from revenues. It also covers revenue percentage for FY 20 21 . Deliver and pitch your topic in the best possible manner with this factory waste management current situation and companies target diagrams pdf. Use them to share invaluable insights on current situation and companies target and impress your audience. This template can be altered and modified as per your expectations. So, grab it now.

Health Insurance Company Expenses Of Operation Expenses Diagrams PDF
This slide shows the 3 years distribution of operating expenditure in health insurance to control drug related issues and extra expenses. This includes hospital and medical benefits , professional fees, etc.Showcasing this set of slides titled Health Insurance Company Expenses Of Operation Expenses Diagrams PDF. The topics addressed in these templates are Percentage Total Expenses, Propessional Fees, Emergency Room. All the content presented in this PPT design is completely editable. Download it and make adjustments in color, background, font etc. as per your unique business setting.

Key Success Factors With Revenues And Customer Overview Diagrams PDF
This slide displays dashboard to review progress of entire organization by tracking actual performance and comparing it with targets set by organization. It further includes details about number of new consumers, percentage target achieved, customer acquisition cost and lifetime value, etc. Showcasing this set of slides titled Key Success Factors With Revenues And Customer Overview Diagrams PDF. The topics addressed in these templates are Compared Pervious Year, Customer Acquisition Cost. All the content presented in this PPT design is completely editable. Download it and make adjustments in color, background, font etc. as per your unique business setting.

Retail POS Terminals Market Size By Application 2016 And 2024 USD Million Themes PDF
This slide covers the Retail Market size was estimated at over USD 15 billion in 2016 and is predicted to grow at over 10 percentage CAGR from 2017 to 2024. Deliver and pitch your topic in the best possible manner with this retail pos terminals market size by application 2016 and 2024 usd million themes pdf. Use them to share invaluable insights on retail pos terminals market size, by application, 2016 and 2024 usd million and impress your audience. This template can be altered and modified as per your expectations. So, grab it now.

Tactical Process For Social Significance Of Social Media To Recruiters And Job Seekers Themes PDF
This slide focuses on statistics that shows the percentage of recruiters and job seekers use different social media platforms such as LinkedIn, Twitter, Facebook and Instagram to monitor candidate profile, hire qualified candidates, etc. Deliver an awe inspiring pitch with this creative Tactical Process For Social Significance Of Social Media To Recruiters And Job Seekers Themes PDF bundle. Topics like Human Resource, Best Candidate, Social Media can be discussed with this completely editable template. It is available for immediate download depending on the needs and requirements of the user.
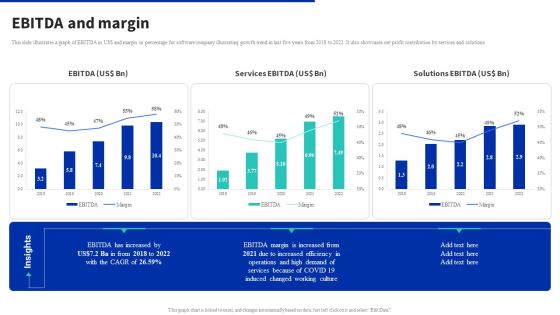
Digital Products Company Outline Ebitda And Margin Inspiration PDF
This slide illustrates a graph of EBITDA in US dollar and margin in percentage for software company illustrating growth trend in last five years from 2018 to 2022. It also showcases net profit contribution by services and solutions. Take your projects to the next level with our ultimate collection of Digital Products Company Outline Ebitda And Margin Inspiration PDF. Slidegeeks has designed a range of layouts that are perfect for representing task or activity duration, keeping track of all your deadlines at a glance. Tailor these designs to your exact needs and give them a truly corporate look with your own brand colors they will make your projects stand out from the rest.

Techniques For Timely Project Dashboard To Monitor Project Status And Performance Microsoft PDF
This slide focuses on dashboard to monitor project status and performance which includes estimated budget, actual cost, time taken by project team to complete phases, completion percentage of project, etc. Deliver and pitch your topic in the best possible manner with this Techniques For Timely Project Dashboard To Monitor Project Status And Performance Microsoft PDF. Use them to share invaluable insights on Timeline vs, Resource Capacity, Project Phase, Time Involved and impress your audience. This template can be altered and modified as per your expectations. So, grab it now.

Sales Team Monthly Report With Variance Background PDF
The following slide highlights the sales team monthly report with variance illustrating key headings which includes key headings month, sales, target, variance, percentage variance and key takeaways. Pitch your topic with ease and precision using this Sales Team Monthly Report With Variance Background PDF. This layout presents information on Sales Team Monthly Report With Variance Background PDF. It is also available for immediate download and adjustment. So, changes can be made in the color, design, graphics or any other component to create a unique layout.
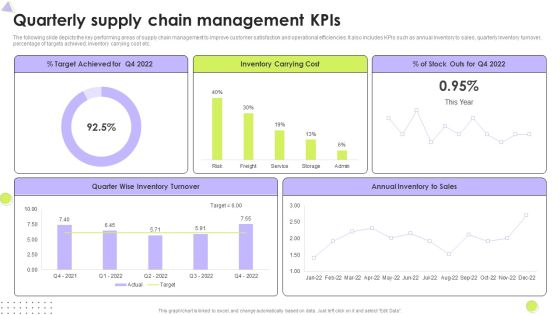
Quarterly Supply Chain Management Kpis Mockup PDF
The following slide depicts the key performing areas of supply chain management to improve customer satisfaction and operational efficiencies. It also includes KPIs such as annual inventory to sales, quarterly inventory turnover, percentage of targets achieved, inventory carrying cost etc. Pitch your topic with ease and precision using this Quarterly Supply Chain Management Kpis Mockup PDF. This layout presents information on Inventory Turnover, Inventory Carrying Cost, Target Achieved. It is also available for immediate download and adjustment. So, changes can be made in the color, design, graphics or any other component to create a unique layout.
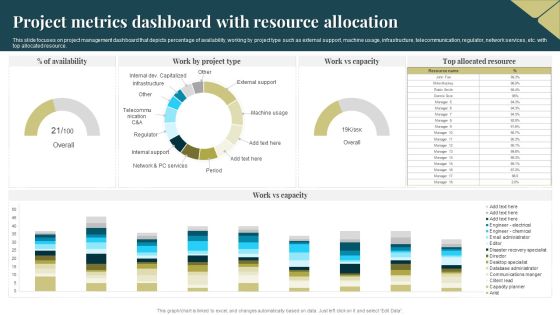
Project Metrics Dashboard With Resource Allocation Portrait PDF
This slide focuses on project management dashboard that depicts percentage of availability, working by project type such as external support, machine usage, infrastructure, telecommunication, regulator, network services, etc. with top allocated resource. Pitch your topic with ease and precision using this Project Metrics Dashboard With Resource Allocation Portrait PDF. This layout presents information on Project Metrics Dashboard, Resource Allocation. It is also available for immediate download and adjustment. So, changes can be made in the color, design, graphics or any other component to create a unique layout.

Customer Behavior Analytics Dashboard To Improve Satisfaction Ppt File Infographics PDF
The following slide provides an insight of websites performance that includes date parameters. The dashboard includes sessions, users, pageviews, bounce rate and percentage of new sessions. Pitch your topic with ease and precision using this Customer Behavior Analytics Dashboard To Improve Satisfaction Ppt File Infographics PDF. This layout presents information on Session, Avg Session Duration, Bounce Rate. It is also available for immediate download and adjustment. So, changes can be made in the color, design, graphics or any other component to create a unique layout.

Brand Value Measuring KPI Dashboard Guide To Understand Evaluate And Enhance Brand Value Slides PDF
Following slide illustrates KPI dashboard to measure brand value. KPIs covered are brand value and percentage change, brand value over time, most followed brands on social media.Take your projects to the next level with our ultimate collection of Brand Value Measuring KPI Dashboard Guide To Understand Evaluate And Enhance Brand Value Slides PDF. Slidegeeks has designed a range of layouts that are perfect for representing task or activity duration, keeping track of all your deadlines at a glance. Tailor these designs to your exact needs and give them a truly corporate look with your own brand colors they all make your projects stand out from the rest
Tracking Goals Alignment KPI Dashboard Guidelines PDF
This slide showcases a tracking dashboard for determining the alignment and progress percentage of the assigned objectives. It also includes the objective evaluation KPIs such as active objectives, overall progress, total employees, objective as per employees, aligned, organizational and departmental objectives. Pitch your topic with ease and precision using this Tracking Goals Alignment KPI Dashboard Guidelines PDF. This layout presents information on Employee, Organizational Objectives, Departmental Objectives. It is also available for immediate download and adjustment. So, changes can be made in the color, design, graphics or any other component to create a unique layout.

KPI Dashboard Highlighting Results Of Multichannel Retail Marketing Rules PDF
The purpose of this slide is to highlight a comprehensive dashboard of omnichannel retail. The key metrics covered in the slide are types of marketing channels, comparison of channels for two different years, transactions by months etc. Pitch your topic with ease and precision using this KPI Dashboard Highlighting Results Of Multichannel Retail Marketing Rules PDF. This layout presents information on Comparison Of Channel Sales, Percentage Of Sales, Transactions By Month. It is also available for immediate download and adjustment. So, changes can be made in the color, design, graphics or any other component to create a unique layout.
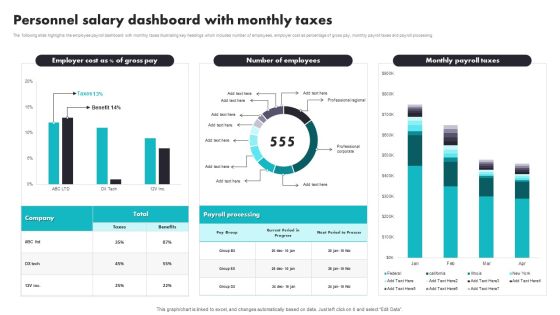
Personnel Salary Dashboard With Monthly Taxes Introduction PDF
The following slide highlights the employee payroll dashboard with monthly taxes illustrating key headings which includes number of employees, employer cost as percentage of gross pay, monthly payroll taxes and payroll processing. Pitch your topic with ease and precision using this Personnel Salary Dashboard With Monthly Taxes Introduction PDF. This layout presents information on Payroll Processing, Benefits. It is also available for immediate download and adjustment. So, changes can be made in the color, design, graphics or any other component to create a unique layout.

Customer Service Delivery And Management Dashboard With Revenue Brochure PDF
The purpose of this slide is to monitor and evaluate service delivery KPIs to improve the customer support process. The major KPIs included are total requests, percentage of requests answered, total revenue, and support cost. Pitch your topic with ease and precision using this Customer Service Delivery And Management Dashboard With Revenue Brochure PDF. This layout presents information on Customer Service Delivery, Management Dashboard With Revenue. It is also available for immediate download and adjustment. So, changes can be made in the color, design, graphics or any other component to create a unique layout.
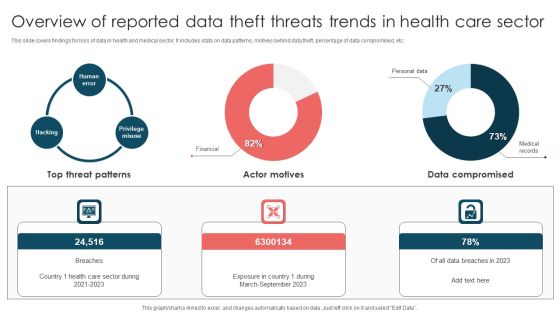
Overview Of Reported Data Theft Threats Trends In Health Care Sector Introduction PDF
This slide covers findings for loss of data in health and medical sector. It includes stats on data patterns, motives behind data theft, percentage of data compromised, etc. Pitch your topic with ease and precision using this Overview Of Reported Data Theft Threats Trends In Health Care Sector Introduction PDF. This layout presents information on Top Threat Patterns, Exposure Country, March To September 2023. It is also available for immediate download and adjustment. So, changes can be made in the color, design, graphics or any other component to create a unique layout.

Small Company And Entrepreneurs Failture Rate Summary PDF
This slide exhibits yearly statistics indicating fail rates of business commenced after 2018. It contains percentage of business fail, yearly comparison rate of failure and average annual rate of business failure. Pitch your topic with ease and precision using this Small Company And Entrepreneurs Failture Rate Summary PDF. This layout presents information on Entrepreneurs Failture Rate, Business. It is also available for immediate download and adjustment. So, changes can be made in the color, design, graphics or any other component to create a unique layout.
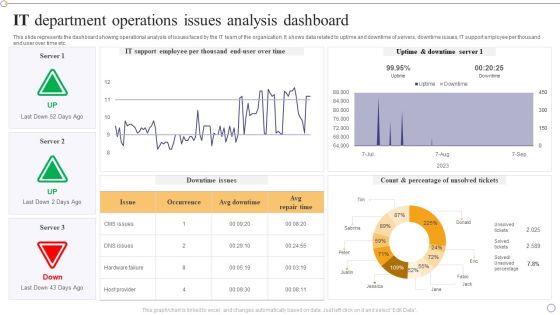
IT Department Operations Issues Analysis Dashboard Designs PDF
This slide represents the dashboard showing operational analysis of issues faced by the IT team of the organization. It shows data related to uptime and downtime of servers, downtime issues, IT support employee per thousand end user over time etc.Pitch your topic with ease and precision using this IT Department Operations Issues Analysis Dashboard Designs PDF. This layout presents information on Support Employee, Uptime Downtime, Percentage Unsolved. It is also available for immediate download and adjustment. So, changes can be made in the color, design, graphics or any other component to create a unique layout.
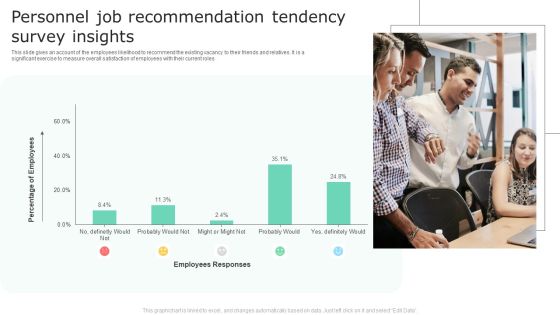
Personnel Job Recommendation Tendency Survey Insights Topics PDF
This slide gives an account of the employees likelihood to recommend the existing vacancy to their friends and relatives. It is a significant exercise to measure overall satisfaction of employees with their current roles. Pitch your topic with ease and precision using this Personnel Job Recommendation Tendency Survey Insights Topics PDF. This layout presents information on Percentage Of Employees, Employees Responses. It is also available for immediate download and adjustment. So, changes can be made in the color, design, graphics or any other component to create a unique layout.

Procurement Transaction Overview Dashboard For Organization Background PDF
This slide showcases transaction summary dashboard for manufacturing company to review total spending on vendors by location and category. It further includes details about percentage discount and invoice. Pitch your topic with ease and precision using this Procurement Transaction Overview Dashboard For Organization Background PDF. This layout presents information on Procurement Transaction, Overview Dashboard For Organization. It is also available for immediate download and adjustment. So, changes can be made in the color, design, graphics or any other component to create a unique layout.
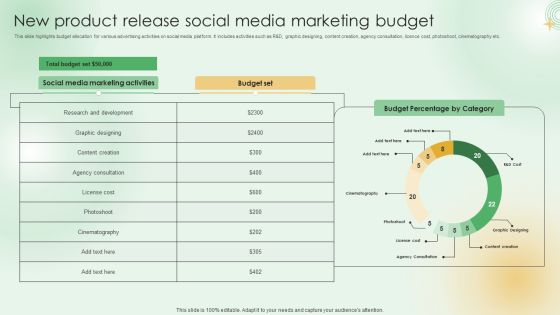
New Product Release Social Media Marketing Budget Clipart PDF
This slide highlights budget allocation for various advertising activities on social media platform. It includes activities such as R and D, graphic designing, content creation, agency consultation, licence cost, photoshoot, cinematography etc. Pitch your topic with ease and precision using this New Product Release Social Media Marketing Budget Clipart PDF. This layout presents information on Total Budget Set, Social Media Marketing Activities, Budget Percentage Category. It is also available for immediate download and adjustment. So, changes can be made in the color, design, graphics or any other component to create a unique layout.

Generation Z Customer Shopping Trends For Apparel Designs PDF
The following slide depicts the apparel shopping trends among generation z. It constitutes of various shopping options available to the consumers along the percentage of their preference. Pitch your topic with ease and precision using this Generation Z Customer Shopping Trends For Apparel Designs PDF. This layout presents information on Physical Stores, Through Social Media, Through Calling. It is also available for immediate download and adjustment. So, changes can be made in the color, design, graphics or any other component to create a unique layout.
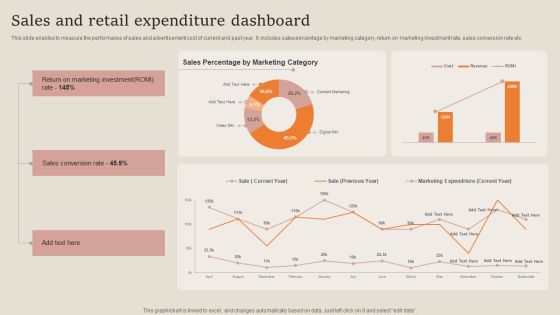
Sales And Retail Expenditure Dashboard Guidelines PDF
This slide enables to measure the performance of sales and advertisement cost of current and past year. It includes sales percentage by marketing category, return on marketing investment rate, sales conversion rate etc. Pitch your topic with ease and precision using this Sales And Retail Expenditure Dashboard Guidelines PDF. This layout presents information on Sales Conversion Rate, Marketing Investment. It is also available for immediate download and adjustment. So, changes can be made in the color, design, graphics or any other component to create a unique layout.
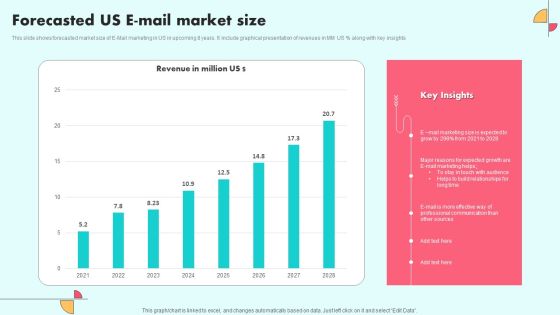
Forecasted Us E Mail Market Size Ideas PDF
This slide shows forecasted market size of E-Mail marketing in US in upcoming 8 years. It include graphical presentation of revenues in MM US percentage along with key insights. Pitch your topic with ease and precision using this Forecasted Us E Mail Market Size Ideas PDF. This layout presents information on E Mail Marketing, Sources, Communication. It is also available for immediate download and adjustment. So, changes can be made in the color, design, graphics or any other component to create a unique layout.

Inventory Stock Out And Decline Of Sales Analysis Dashboard Inspiration PDF
Following slide presents a key performance indicating dashboard that can be used by businesses to track Inventory stock out and lost sales. Major key performance indicators are percentage stockouts, amount of sales, lost sales accountability, etc. Pitch your topic with ease and precision using this Inventory Stock Out And Decline Of Sales Analysis Dashboard Inspiration PDF. This layout presents information on Lost Sales Summary, Stock Out Details It is also available for immediate download and adjustment. So, changes can be made in the color, design, graphics or any other component to create a unique layout.

Monthly Resource Planning Management Of Project Team Demonstration PDF
This slide covers the resourcing plan with the name of the project manager and its team members which shows the monthly percentage of absence, project, speculative, overhead and availability using graphical presentation. Showcasing this set of slides titled Monthly Resource Planning Management Of Project Team Demonstration PDF. The topics addressed in these templates are Project Team, Resource Planning Management. All the content presented in this PPT design is completely editable. Download it and make adjustments in color, background, font etc. as per your unique business setting.

Project Metrics Dashboard With Actual Cost Background PDF
This slide shows the project management dashboard which focuses on cost performance, actual expenses, total budget, time taken by project phases, percentage of completion with planning, initiation, monitor and execution with timeline versus resource capacity. Showcasing this set of slides titled Project Metrics Dashboard With Actual Cost Background PDF. The topics addressed in these templates are Project Cost Performance, Project Performance, Resource Capacity. All the content presented in this PPT design is completely editable. Download it and make adjustments in color, background, font etc. as per your unique business setting.

Team Performance Improvement Functional Optimization Through Agile Methodologies Agile Project Status Dashboard With Story Details Diagrams PDF
The following slide shows Agile Project Status Dashboard with project summary, story details, possible risks and mitigation strategies, team velocity, project status, percentage of budget spent etc. Deliver and pitch your topic in the best possible manner with this team performance improvement functional optimization through agile methodologies agile project status dashboard with story details diagrams pdf. Use them to share invaluable insights on agile project status dashboard with story details and impress your audience. This template can be altered and modified as per your expectations. So, grab it now.

Cost Management Plan Assessment With Forecast And Performing Index Demonstration PDF
In this slide we have showcased cost management plan assessment statistics for making a plant. It includes- expenditure forecast, current expenditure and percentage of actual budget expenditure. Showcasing this set of slides titled cost management plan assessment with forecast and performing index demonstration pdf. The topics addressed in these templates are current expenditure, expenditure forecast, construction project. All the content presented in this PPT design is completely editable. Download it and make adjustments in color, background, font etc. as per your unique business setting.

Current Situation Of The Client Company Catastrophe Recovery Application Plan Guidelines PDF
This slide depicts the current situation of the client company by displaying the total number of breaches due to hacking, the number of errors, the percentage of social attacks, and so on. Deliver and pitch your topic in the best possible manner with this current situation of the client company catastrophe recovery application plan guidelines pdf. Use them to share invaluable insights on current situation of the client company and impress your audience. This template can be altered and modified as per your expectations. So, grab it now.
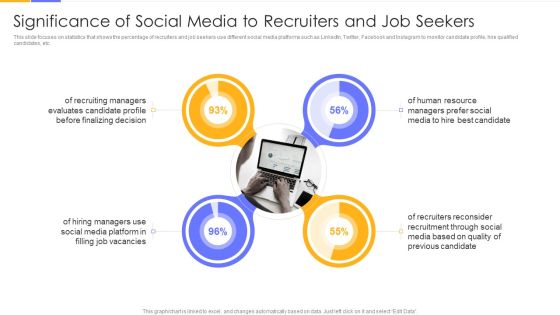
Establishing Social Media Hiring Plan Significance Of Social Media To Recruiters And Job Seekers Ideas PDF
This slide focuses on statistics that shows the percentage of recruiters and job seekers use different social media platforms such as LinkedIn, Twitter, Facebook and Instagram to monitor candidate profile, hire qualified candidates, etc.Deliver an awe inspiring pitch with this creative Establishing Social Media Hiring Plan Significance Of Social Media To Recruiters And Job Seekers Ideas PDF bundle. Topics like Recruiting Managers, Evaluates Candidate, Finalizing Decision can be discussed with this completely editable template. It is available for immediate download depending on the needs and requirements of the user.
Initiatives To Produce Effective Concept For Logistic Firm Fall In On Time Topics PDF
This slide shows a fall in the On Time Pickup Percentage of HCL Plus Logistics Company. Reasons for the fall is due to factors such as Complex Shipping Operations, Poor Fright Carrier Performance, Lack of Expertise and Updated Technologies in Logistic Operations, Faulty Scheduling Procedures and Softwares etc. Deliver and pitch your topic in the best possible manner with this initiatives to produce effective concept for logistic firm fall in on time topics pdf. Use them to share invaluable insights on reduced, technologies, performance and impress your audience. This template can be altered and modified as per your expectations. So, grab it now.

Coordinating Distinct Activities For Effective Project Time Management Dashboard To Monitor Project Portrait PDF
This slide focuses on dashboard to monitor project status and performance which includes estimated budget, actual cost, time taken by project team to complete phases, completion percentage of project, etc.Deliver and pitch your topic in the best possible manner with this Coordinating Distinct Activities For Effective Project Time Management Dashboard To Monitor Project Portrait PDF Use them to share invaluable insights on Project Performance, Cost Performance, Completing Project and impress your audience. This template can be altered and modified as per your expectations. So, grab it now.
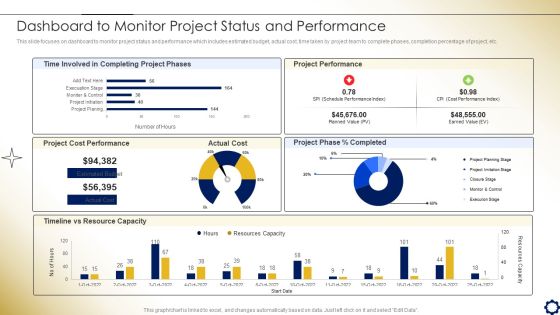
Project Time Management To Enhance Productivity Dashboard To Monitor Project Status And Performance Background PDF
This slide focuses on dashboard to monitor project status and performance which includes estimated budget, actual cost, time taken by project team to complete phases, completion percentage of project, etc.Deliver and pitch your topic in the best possible manner with this Project Time Management To Enhance Productivity Dashboard To Monitor Project Status And Performance Background PDF. Use them to share invaluable insights on Time Involved, Completing Project, Project Performance and impress your audience. This template can be altered and modified as per your expectations. So, grab it now.
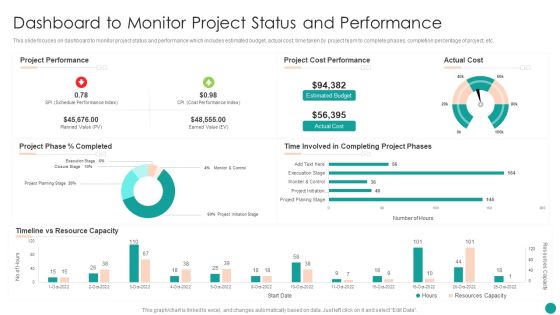
Time Management Techniques For Successful Project Dashboard To Monitor Project Status And Performance Brochure PDF
This slide focuses on dashboard to monitor project status and performance which includes estimated budget, actual cost, time taken by project team to complete phases, completion percentage of project, etc.Deliver and pitch your topic in the best possible manner with this Time Management Techniques For Successful Project Dashboard To Monitor Project Status And Performance Brochure PDF. Use them to share invaluable insights on Project Performance, Cost Performance, Completing Project and impress your audience. This template can be altered and modified as per your expectations. So, grab it now.

Customer Satisfaction Survey Outcome Report Template PDF
This slide showcases outcome report for customer satisfaction survey that can help organization to identify the number of satisfied consumers and detect areas of improvement for future. Its key elements are Satisfaction survey and percentage of satisfied consumers. Showcasing this set of slides titled Customer Satisfaction Survey Outcome Report Template PDF. The topics addressed in these templates are Customers, Satisfaction Survey, Service Speed. All the content presented in this PPT design is completely editable. Download it and make adjustments in color, background, font etc. as per your unique business setting.

Comparative Analysis Of Net And Mobile Banking Template PDF
The following slide depicts the comparative statistical insights of internet and mobile banking. It includes the percentage of people either opt for net or mobile to avail those specific service. Showcasing this set of slides titled Comparative Analysis Of Net And Mobile Banking Template PDF. The topics addressed in these templates are Transfer Funds, Merchant Payment, International Fund Transfer. All the content presented in this PPT design is completely editable. Download it and make adjustments in color, background, font etc. as per your unique business setting.

PPM Private Equity Key Streams Of Revenue Generation Ppt PowerPoint Presentation Infographic Template Show PDF
This slide shows Revenue Model of the Company with various revenue earning Channels that the Company has such as Online Stores, Product Sales, Subscription Fees etc. along with their respective percentage of the Total Revenue. Deliver an awe-inspiring pitch with this creative ppm private equity key streams of revenue generation ppt powerpoint presentation infographic template show pdf bundle. Topics like subscription fee technology, digital service, product sale, online sale, total revenue can be discussed with this completely editable template. It is available for immediate download depending on the needs and requirements of the user.

Providing Electronic Financial Services To Existing Consumers Customer Share Projections For 2023 Template PDF
Following slide shows customer share projects for the year 2022 in both developed countries and developing countries. Among developed countries Bank will have 32 percentage of customer share alone in USA. Deliver and pitch your topic in the best possible manner with this Providing Electronic Financial Services To Existing Consumers Customer Share Projections For 2023 Template PDF. Use them to share invaluable insights on Customer Share Projections For 2023 and impress your audience. This template can be altered and modified as per your expectations. So, grab it now.
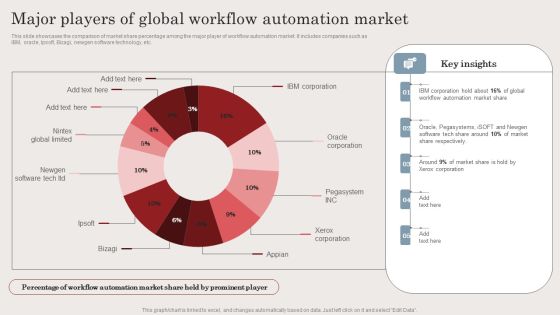
Major Players Of Global Workflow Automation Market Ppt Infographics Design Templates PDF
This slide showcases the comparison of market share percentage among the major player of workflow automation market. It includes companies such as IBM, oracle, Ipsoft, Bizagi, newgen software technology, etc. Take your projects to the next level with our ultimate collection of Major Players Of Global Workflow Automation Market Ppt Infographics Design Templates PDF. Slidegeeks has designed a range of layouts that are perfect for representing task or activity duration, keeping track of all your deadlines at a glance. Tailor these designs to your exact needs and give them a truly corporate look with your own brand colors they will make your projects stand out from the rest.

Dashboard Showing IT Risk Control Strategies Risk Management Portrait PDF
This slide shows the dashboard that depicts the information technology risk management which focuses on the percentage of potential risks, risk analysis progress, response progress, risk rating breakdown with vulnerabilities such as encryption vulnerabilities, physical security , etc. Showcasing this set of slides titled Dashboard Showing IT Risk Control Strategies Risk Management Portrait PDF. The topics addressed in these templates are Risk Analysis Progress, Risk Heat Map, Action Plan Breakdown. All the content presented in this PPT design is completely editable. Download it and make adjustments in color, background, font etc. as per your unique business setting.
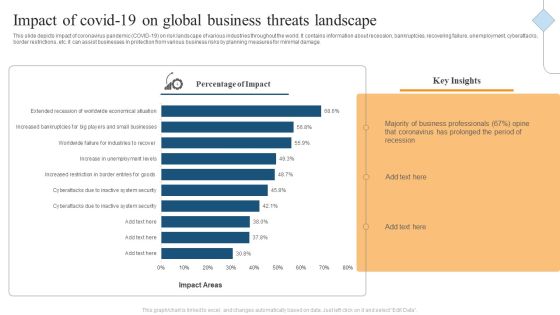
Impact Of Covid 19 On Global Business Threats Landscape Ppt Summary Ideas PDF
This slide depicts impact of coronavirus pandemic COVID-19 on risk landscape of various industries throughout the world. It contains information about recession, bankruptcies, recovering failure, unemployment, cyberattacks, border restrictions, etc. it can assist businesses in protection from various business risks by planning measures for minimal damage. Showcasing this set of slides titled Impact Of Covid 19 On Global Business Threats Landscape Ppt Summary Ideas PDF. The topics addressed in these templates are Percentage Impact, Key Insights, Business Professionals. All the content presented in this PPT design is completely editable. Download it and make adjustments in color, background, font etc. as per your unique business setting.

Content Format Statistics For Influencer Marketing Strategy Paln Mockup PDF
This slide plans key statistics of that can help organization to select the format of content for influencer marketing strategy. Its key components are content format and percentage of marketers.Showcasing this set of slides titled Content Format Statistics For Influencer Marketing Strategy Paln Mockup PDF. The topics addressed in these templates are Marketers Prefer, Instagram Post, Easy Produce. All the content presented in this PPT design is completely editable. Download it and make adjustments in color, background, font etc. as per your unique business setting.

Data Theft And Breach Threats Monitoring Dashboard Ppt Outline Designs PDF
This slide covers dashboard to monitor top data breaches and loss of confidential data in organization. It includes KPIs such percentage of data risks detected, number of data risks, data risk analysis, response progress for data risks, data risk ratings. Showcasing this set of slides titled Data Theft And Breach Threats Monitoring Dashboard Ppt Outline Designs PDF. The topics addressed in these templates are Number Risk Threshold, Data Analysts Progress, Action Plan Breakdown. All the content presented in this PPT design is completely editable. Download it and make adjustments in color, background, font etc. as per your unique business setting.

Cost Management Metrics For Software Development And Management Formats PDF
This slide displays post application lunch analytical report for organization to track total maintenance expenditure and revenues earned from project. It further includes detail about return on investment and breakdown percentage for planning design, testing and development.Showcasing this set of slides titled Cost Management Metrics For Software Development And Management Formats PDF. The topics addressed in these templates are Revenue, Department, Budget. All the content presented in this PPT design is completely editable. Download it and make adjustments in color, background, font etc. as per your unique business setting.
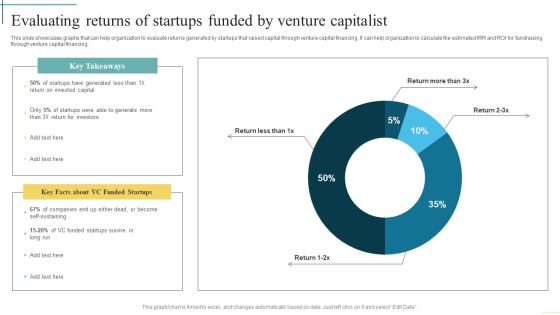
Evaluating Returns Of Startups Funded By Venture Capitalist Developing Fundraising Techniques Microsoft PDF
This slide illustrates graph that can help organization to evaluate the percentage of IPO generating negative returns. It can company to evaluate the success rate of raising money through public by issuing IPO.Boost your pitch with our creative Evaluating Returns Of Startups Funded By Venture Capitalist Developing Fundraising Techniques Microsoft PDF. Deliver an awe-inspiring pitch that will mesmerize everyone. Using these presentation templates you will surely catch everyones attention. You can browse the ppts collection on our website. We have researchers who are experts at creating the right content for the templates. So you do not have to invest time in any additional work. Just grab the template now and use them.

Food Company Financial Performance Summary Operating Profit And Margin Topics PDF
This slide illustrates a graph of operating profit in US dollar and gross margin in percentage for food company. Additionally, it shows operating profit of all business lines of the company food, beverage and dairy products. Find a pre-designed and impeccable Food Company Financial Performance Summary Operating Profit And Margin Topics PDF. The templates can ace your presentation without additional effort. You can download these easy-to-edit presentation templates to make your presentation stand out from others. So, what are you waiting for Download the template from Slidegeeks today and give a unique touch to your presentation.

Stock Market Research Report Target Companys Shareholding Pattern For Equity Research Structure PDF
The following slide displays the share holding pattern of the company, the graph provides percentage of shares that are held by promotor groups, domestic institutional investors, foreign Institutional investors, Private Corporate Bodies and General public. Deliver an awe-inspiring pitch with this creative stock market research report target companys shareholding pattern for equity research structure pdf bundle. Topics like general public, promoter group, domestic institutional investors, private corporate bodies, foreign institutional investors can be discussed with this completely editable template. It is available for immediate download depending on the needs and requirements of the user.
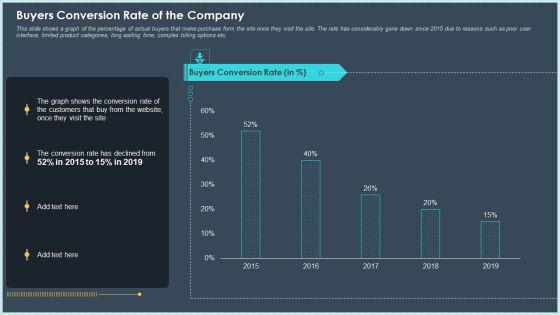
Buyers Conversion Rate Of The Company Ppt File Objects PDF
This slide shows a graph of the percentage of actual buyers that make purchase form the site once they visit the site. The rate has considerably gone down since 2015 due to reasons such as poor user interface, limited product categories, long waiting time, complex billing options etc. Deliver an awe-inspiring pitch with this creative buyers conversion rate of the company ppt file objects pdf bundle. Topics like conversion rate, buyers conversion rate, customers can be discussed with this completely editable template. It is available for immediate download depending on the needs and requirements of the user.

Determining Consumers Concerned About Their Safety At Different Touch Points Elements PDF
This slide displays information about the consumers concerns related to their safety at various touch points. Here the graph depicts that 73 percentage of the customers will feel comfortable visiting a restaurant if sanitization of customer touch points is done on frequent basis. Deliver and pitch your topic in the best possible manner with this determining consumers concerned about their safety at different touch points elements pdf. Use them to share invaluable insights on determining consumers concerned about their safety at different touch points and impress your audience. This template can be altered and modified as per your expectations. So, grab it now.

Buyers Conversion Rate Of The Company Sample PDF
This slide shows a graph of the percentage of actual buyers that make purchase form the site once they visit the site. The rate has considerably gone down since 2017 due to reasons such as poor user interface, limited product categories, long waiting time, complex billing options etc. Deliver an awe-inspiring pitch with this creative buyers conversion rate of the company sample pdf. bundle. Topics like buyers conversion rate, 2017 to 2021 can be discussed with this completely editable template. It is available for immediate download depending on the needs and requirements of the user.

Canned Food Company Profile Net Profit And Margin Information PDF
This slide illustrates a graph of net profit in USdollar and gross margin in percentage for food company. Additionally, it shows net profit of all business lines of the company food, beverage and dairy products Deliver and pitch your topic in the best possible manner with this Canned Food Company Profile Net Profit And Margin Information PDF Use them to share invaluable insights on Net Profit, Margin and impress your audience. This template can be altered and modified as per your expectations. So, grab it now.

Canned Food Company Profile Operating Profit And Margin Background PDF
This slide illustrates a graph of operating profit in USdollar and gross margin in percentage for food company. Additionally, it shows operating profit of all business lines of the company food, beverage and dairy products Deliver an awe inspiring pitch with this creative Canned Food Company Profile Operating Profit And Margin Background PDF bundle. Topics like Dairy Operating, Beverage Operating , Total Operating can be discussed with this completely editable template. It is available for immediate download depending on the needs and requirements of the user.

Insurance Analytics Corporation Clients Claims Dashboard Summary PDF
This slide illustrates clients claim status statistics of a insurance corporation. It includes total claims, monthly claims, claims amount by type, percentage of claims, denied and received claims line graph. Showcasing this set of slides titled Insurance Analytics Corporation Clients Claims Dashboard Summary PDF. The topics addressed in these templates are Insurance Analytics Corporation, Clients Claims Dashboard. All the content presented in this PPT design is completely editable. Download it and make adjustments in color, background, font etc. as per your unique business setting.
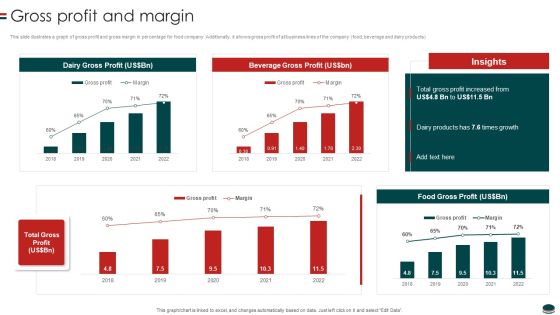
Instant Snacks And Food Firm Details Gross Profit And Margin Professional PDF
This slide illustrates a graph of gross profit and gross margin in percentage for food company. Additionally, it shows gross profit of all business lines of the company food, beverage and dairy products.Deliver an awe inspiring pitch with this creative Instant Snacks And Food Firm Details Gross Profit And Margin Professional PDF bundle. Topics like Gross Profit, Beverage Gross, Dairy Products can be discussed with this completely editable template. It is available for immediate download depending on the needs and requirements of the user.
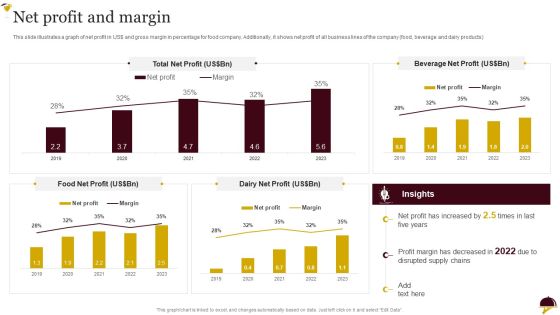
Food Company Overview Net Profit And Margin Summary PDF
This slide illustrates a graph of net profit in USdollar and gross margin in percentage for food company. Additionally, it shows net profit of all business lines of the company food, beverage and dairy products.Deliver and pitch your topic in the best possible manner with this Food Company Overview Net Profit And Margin Summary PDF Use them to share invaluable insights on Beverage Net, Margin Decreased, Disrupted Supply and impress your audience. This template can be altered and modified as per your expectations. So, grab it now.
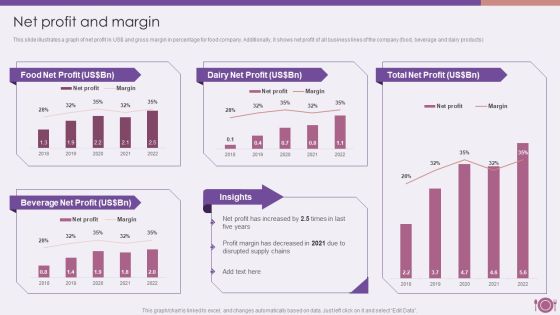
Packaged Food Firm Description Net Profit And Margin Download PDF
This slide illustrates a graph of net profit in USdollar and gross margin in percentage for food company. Additionally, it shows net profit of all business lines of the company food, beverage and dairy products.Deliver and pitch your topic in the best possible manner with this Packaged Food Firm Description Net Profit And Margin Download PDF. Use them to share invaluable insights on Dairy Net, Total Net, Beverage Net Profit and impress your audience. This template can be altered and modified as per your expectations. So, grab it now.

Dashboard For Tracking Business And IT Alignment Microsoft PDF
This slide depicts the dashboard for business and IT alignment by covering details of total sales, customer support service, percentage of business operations aligned IT, usage of communication channels, and top performer associates. Find a pre designed and impeccable Dashboard For Tracking Business And IT Alignment Microsoft PDF. The templates can ace your presentation without additional effort. You can download these easy to edit presentation templates to make your presentation stand out from others. So, what are you waiting for Download the template from Slidegeeks today and give a unique touch to your presentation.

Techniques To Implement Customer Survey Results Of Referral Marketing Campaign Download PDF
This slide provides an overview of a survey conducted for referral marketing campaigns. It showcases the percentage of people influenced by various sources. Slidegeeks is one of the best resources for PowerPoint templates. You can download easily and regulate Techniques To Implement Customer Survey Results Of Referral Marketing Campaign Download PDF for your personal presentations from our wonderful collection. A few clicks is all it takes to discover and get the most relevant and appropriate templates. Use our Templates to add a unique zing and appeal to your presentation and meetings. All the slides are easy to edit and you can use them even for advertisement purposes.

Breakdown Of Product Marketing Budget Ppt Guidelines PDF
This slide shows the breakdown of various product marketing channels along with the total budget, amount spend on each channel and percentage for the particular year. Slidegeeks is one of the best resources for PowerPoint templates. You can download easily and regulate Breakdown Of Product Marketing Budget Ppt Guidelines PDF for your personal presentations from our wonderful collection. A few clicks is all it takes to discover and get the most relevant and appropriate templates. Use our Templates to add a unique zing and appeal to your presentation and meetings. All the slides are easy to edit and you can use them even for advertisement purposes.
 Home
Home