Percentage Charts
Downward Arrow With Percentage Symbol Icon Ppt PowerPoint Presentation File Inspiration PDF
Persuade your audience using this downward arrow with percentage symbol icon ppt powerpoint presentation file inspiration pdf. This PPT design covers three stages, thus making it a great tool to use. It also caters to a variety of topics including downward arrow with percentage symbol icon. Download this PPT design now to present a convincing pitch that not only emphasizes the topic but also showcases your presentation skills.
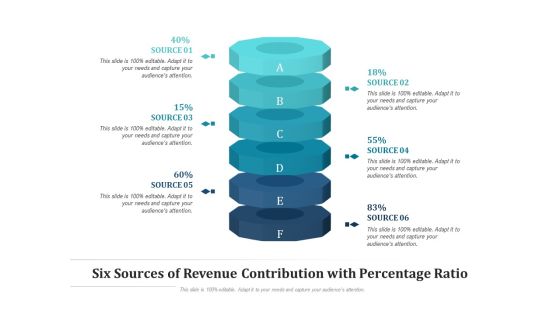
Six Sources Of Revenue Contribution With Percentage Ratio Ppt PowerPoint Presentation File Graphics Tutorials PDF
Persuade your audience using this six sources of revenue contribution with percentage ratio ppt powerpoint presentation file graphics tutorials pdf. This PPT design covers six stages, thus making it a great tool to use. It also caters to a variety of topics including six sources of revenue contribution with percentage ratio. Download this PPT design now to present a convincing pitch that not only emphasizes the topic but also showcases your presentation skills.

Geographic Revenue Split Of The Company In Percentage Ratio Ppt PowerPoint Presentation Slides Visuals PDF
Persuade your audience using this geographic revenue split of the company in percentage ratio ppt powerpoint presentation slides visuals pdf. This PPT design covers five stages, thus making it a great tool to use. It also caters to a variety of topics including geographic revenue split of the company in percentage ratio. Download this PPT design now to present a convincing pitch that not only emphasizes the topic but also showcases your presentation skills.

Percentage Graph On Computer Table Business PowerPoint Templates Ppt Backgrounds For Slides 1212
We present our Percentage Graph On Computer Table Business PowerPoint Templates PPT Backgrounds For Slides 1212.Download our Computer PowerPoint Templates because you can Trigger audience minds with your interesting ideas. Download and present our Marketing PowerPoint Templates because customer satisfaction is a mantra of the marketplace. Building a loyal client base is an essential element of your business. Download and present our Finance PowerPoint Templates because let this slide illustrates others piggyback on you to see well over the horizon. Download and present our Success PowerPoint Templates because the success of your venture depends on the performance of every team member. Download and present our Business PowerPoint Templates because spell out your advertising plans to increase market share. The feedback has been positive and productive.Use these PowerPoint slides for presentations relating to Percentage graph on computer table, business, marketing, finance, success, computer. The prominent colors used in the PowerPoint template are Red, Yellow, Green. Professionals tell us our Percentage Graph On Computer Table Business PowerPoint Templates PPT Backgrounds For Slides 1212 are Striking. Use our computer PowerPoint templates and PPT Slides are Excellent. We assure you our Percentage Graph On Computer Table Business PowerPoint Templates PPT Backgrounds For Slides 1212 are Great. We assure you our marketing PowerPoint templates and PPT Slides are designed by professionals Presenters tell us our Percentage Graph On Computer Table Business PowerPoint Templates PPT Backgrounds For Slides 1212 are Radiant. PowerPoint presentation experts tell us our marketing PowerPoint templates and PPT Slides are Beautiful.

Houses And Percentage Symbol Business Real Estate PowerPoint Templates And PowerPoint Themes 1112
Houses And Percentage Symbol Business Real Estate PowerPoint Templates And PowerPoint Themes 1112-The above template displays a diagram of many houses and percent symbol in center. This image clearly defines the concept of discount, investment and architecture. It is a useful captivating tool conceived to enable you to define your message in your Business PPT presentations on construction and real estate. The structure of our templates allows you to effectively highlight the key issues concerning the growth of your business.-Houses And Percentage Symbol Business Real Estate PowerPoint Templates And PowerPoint Themes 1112-This PowerPoint template can be used for presentations relating to-House and percent symbol, Business, Symbol, Finance, Marketing, Real estate

Success Percentage Graph Business PowerPoint Templates Ppt Backgrounds For Slides 1212
We present our Success Percentage Graph Business PowerPoint Templates PPT Backgrounds For Slides 1212.Download and present our Business PowerPoint Templates because you are ready to flap your wings and launch off. All poised are you to touch the sky with glory. Download our Success PowerPoint Templates because you have the ability to judge Which out of late have been proving to be a hassle. Download and present our Finance PowerPoint Templates because this diagram helps you to develop your marketing strategy and communicate your enthusiasm and motivation to raise the bar. Download and present our Marketing PowerPoint Templates because this template helps you to motivate each and every one of your group to give it his very best. Use our Signs PowerPoint Templates because our PowerPoint templates designed for your ideas to sell.Use these PowerPoint slides for presentations relating to Success bar graph, business, success, finance, marketing, signs. The prominent colors used in the PowerPoint template are Blue , Red, White. Customers tell us our Success Percentage Graph Business PowerPoint Templates PPT Backgrounds For Slides 1212 are Vintage. Presenters tell us our signs PowerPoint templates and PPT Slides are Breathtaking. Use our Success Percentage Graph Business PowerPoint Templates PPT Backgrounds For Slides 1212 are Ritzy. PowerPoint presentation experts tell us our marketing PowerPoint templates and PPT Slides will help them to explain complicated concepts. Customers tell us our Success Percentage Graph Business PowerPoint Templates PPT Backgrounds For Slides 1212 are Zippy. Presenters tell us our PowerPoint templates and PPT Slides are Handsome.
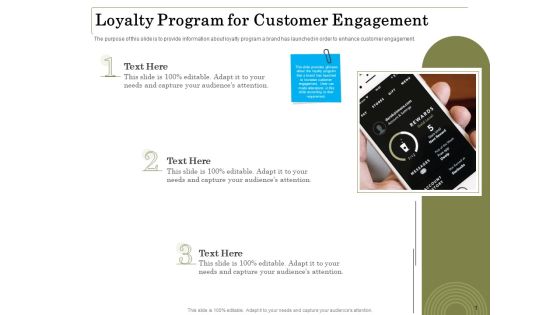
Percentage Share Customer Expenditure Loyalty Program For Customer Engagement Clipart PDF
Presenting this set of slides with name percentage share customer expenditure loyalty program for customer engagement clipart pdf. This is a three stage process. The stages in this process are loyalty program for customer engagement. This is a completely editable PowerPoint presentation and is available for immediate download. Download now and impress your audience.

Box With Percentage Sign Of Success PowerPoint Templates And PowerPoint Themes 1012
Box With Percentage Sign Of Success PowerPoint Templates And PowerPoint Themes 1012-Deliver amazing Presentations with our above template showing open box with percent sign. This image represents the sales or finance concept. Use this Amazing template for Business Distribution. Use this Powerful Template for Business, Marketing and Industrial Presentations. This

Quarterly Consumer Satisfaction Survey With Percentage Levels Ppt PowerPoint Presentation Gallery Summary PDF
Presenting quarterly consumer satisfaction survey with percentage levels ppt powerpoint presentation gallery summary pdf to dispense important information. This template comprises one stages. It also presents valuable insights into the topics including very satisfied, satisfied, neutral, dissatisfied, very dissatisfied. This is a completely customizable PowerPoint theme that can be put to use immediately. So, download it and address the topic impactfully.
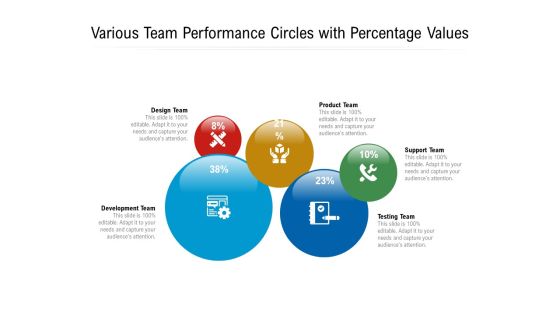
Various Team Performance Circles With Percentage Values Ppt PowerPoint Presentation Gallery Good PDF
Presenting various team performance circles with percentage values ppt powerpoint presentation gallery good pdf to dispense important information. This template comprises five stages. It also presents valuable insights into the topics including design team, development team, product team. This is a completely customizable PowerPoint theme that can be put to use immediately. So, download it and address the topic impactfully.

Risk And Return Of Companys Assets Yoy Percentage Ppt PowerPoint Presentation Styles Background Images
Presenting this set of slides with name risk and return of companys assets yoy percentage ppt powerpoint presentation styles background images. The topics discussed in these slides are business, planning, strategy, marketing, management. This is a completely editable PowerPoint presentation and is available for immediate download. Download now and impress your audience.

Current Scenario For Sales And Marketing Alignment Percentage Ppt PowerPoint Presentation Ideas Good
Presenting this set of slides with name current scenario for sales and marketing alignment percentage ppt powerpoint presentation ideas good. The topics discussed in these slides are marketing, business, management, planning, strategy. This is a completely editable PowerPoint presentation and is available for immediate download. Download now and impress your audience.
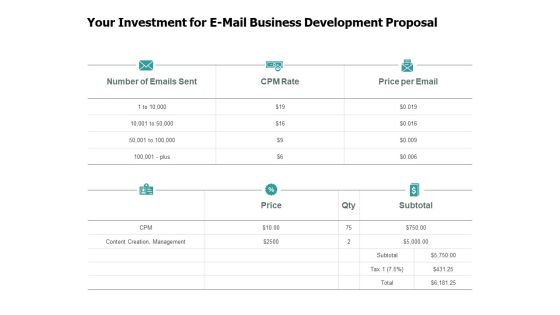
Your Investment For E Mail Business Development Proposal Percentage Ppt PowerPoint Presentation Ideas
Presenting this set of slides with name your investment for e mail business development proposal percentage ppt powerpoint presentation ideas. The topics discussed in these slides are marketing, business, management, planning, strategy. This is a completely editable PowerPoint presentation and is available for immediate download. Download now and impress your audience.
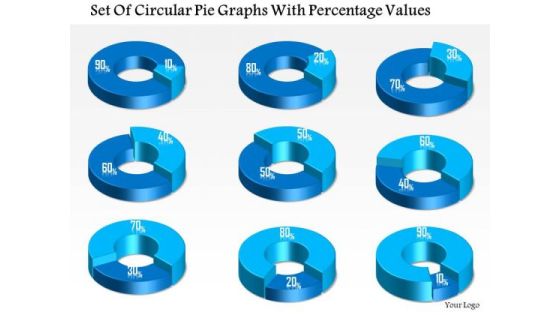
Business Diagram Set Of Circular Pie Graphs With Percentage Values Presentation Template
This business diagram displays set of pie charts. This Power Point template has been designed to compare and present business data. Download this diagram to represent stages of business growth.
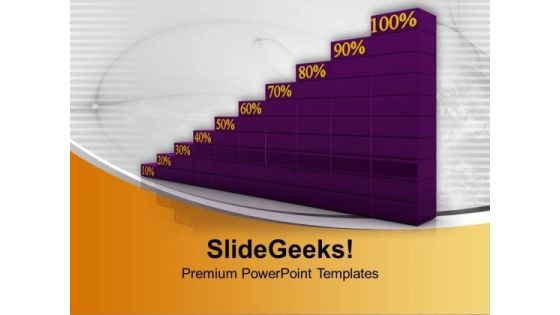
Percentage Progress Graph Business PowerPoint Templates Ppt Background For Slides 1112
We present our Percentage Progress Graph Business PowerPoint Templates PPT Background For Slides 1112.Use our Business PowerPoint Templates because,The fruits of your labour are beginning to show.Enlighten them on the great plans you have for their enjoyment Use our Success PowerPoint Templates because,They help to focus the thoughts of your listeners. Use our Money PowerPoint Templates because,Your listeners do not have to put on their thinking caps. Use our Finance PowerPoint Templates because,Your ideas are fundamentally stable with a broad base of workable possibilities. Use our Marketing PowerPoint Templates because,It is Inspired by the indelible Olympic logo this graphic exemplifies the benefits of teamwork.Use these PowerPoint slides for presentations relating to Percentage business graph, success, money, finance, business, marketing . The prominent colors used in the PowerPoint template are Purple, Yellow, White

Christmas Discount Party Percentage Sale PowerPoint Templates Ppt Backgrounds For Slides 0113
We present our Christmas Discount Party Percentage Sale PowerPoint Templates PPT Backgrounds For Slides 0113.Use our Sales PowerPoint Templates because They will Put the wind in your sails. Skim smoothly over the choppy waters of the market. Download and present our Marketing PowerPoint Templates because Our PowerPoint Templates and Slides are designed to help you succeed. They have all the ingredients you need. Download and present our Christmas PowerPoint Templates because Our PowerPoint Templates and Slides will provide you a launch platform. Give a lift off to your ideas and send them into orbit. Present our Holidays PowerPoint Templates because You are well armed with penetrative ideas. Our PowerPoint Templates and Slides will provide the gunpowder you need. Download and present our Shapes PowerPoint Templates because Our PowerPoint Templates and Slides will embellish your thoughts. See them provide the desired motivation to your team.Use these PowerPoint slides for presentations relating to Christmas discount party, Sales, Marketing, Christmas, Holidays, Shapes. The prominent colors used in the PowerPoint template are Pink, Blue, Green. Customers tell us our Christmas Discount Party Percentage Sale PowerPoint Templates PPT Backgrounds For Slides 0113 will make you look like a winner. Customers tell us our Christmas PowerPoint templates and PPT Slides are effectively colour coded to prioritise your plans They automatically highlight the sequence of events you desire. Customers tell us our Christmas Discount Party Percentage Sale PowerPoint Templates PPT Backgrounds For Slides 0113 are second to none. Professionals tell us our Sales PowerPoint templates and PPT Slides are readymade to fit into any presentation structure. We assure you our Christmas Discount Party Percentage Sale PowerPoint Templates PPT Backgrounds For Slides 0113 will help them to explain complicated concepts. Professionals tell us our PowerPoint templates and PPT Slides will help you be quick off the draw. Just enter your specific text and see your points hit home.

Green Bar Graph With Percentage Marketing PowerPoint Templates Ppt Backgrounds For Slides 0213
We present our Green Bar Graph With Percentage Marketing PowerPoint Templates PPT Backgrounds For Slides 0213.Download our Business PowerPoint Templates because Our PowerPoint Templates and Slides will steer your racing mind. Hit the right buttons and spur on your audience. Download our Finance PowerPoint Templates because Our PowerPoint Templates and Slides are focused like a searchlight beam. They highlight your ideas for your target audience. Download and present our Signs PowerPoint Templates because You can Be the star of the show with our PowerPoint Templates and Slides. Rock the stage with your ideas. Download our Shapes PowerPoint Templates because You can Stir your ideas in the cauldron of our PowerPoint Templates and Slides. Cast a magic spell on your audience. Present our Marketing PowerPoint Templates because You can Be the puppeteer with our PowerPoint Templates and Slides as your strings. Lead your team through the steps of your script.Use these PowerPoint slides for presentations relating to Business graph and percentage symbol, business, finance, signs, shapes, marketing. The prominent colors used in the PowerPoint template are Green, Red, White.

Progress In Business Percentage Graph PowerPoint Templates Ppt Backgrounds For Slides 0313
We present our Progress In Business Percentage Graph PowerPoint Templates PPT Backgrounds For Slides 0313.Download our Business PowerPoint Templates because you should once Tap the ingenuity of our PowerPoint Templates and Slides. They are programmed to succeed. Use our Shapes PowerPoint Templates because Our PowerPoint Templates and Slides will provide the perfect balance. Your weighty ideas will get the ideal impetus. Use our Success PowerPoint Templates because Our PowerPoint Templates and Slides will let you Hit the target. Go the full distance with ease and elan. Use our Marketing PowerPoint Templates because They will bring a lot to the table. Their alluring flavours will make your audience salivate. Download our Services PowerPoint Templates because You have a driving passion to excel in your field. Our PowerPoint Templates and Slides will prove ideal vehicles for your ideas.Use these PowerPoint slides for presentations relating to Discount percentage business graph, business, shapes, success, marketing, services. The prominent colors used in the PowerPoint template are Red, White, Blue.

Success Graph With Percentage Business PowerPoint Templates Ppt Backgrounds For Slides 0213
We present our Success Graph With Percentage Business PowerPoint Templates PPT Backgrounds For Slides 0213.Present our Business PowerPoint Templates because Our PowerPoint Templates and Slides are conceived by a dedicated team. Use them and give form to your wondrous ideas. Present our Finance PowerPoint Templates because It will let you Set new benchmarks with our PowerPoint Templates and Slides. They will keep your prospects well above par. Download our Signs PowerPoint Templates because Our PowerPoint Templates and Slides has conjured up a web of all you need with the help of our great team. Use them to string together your glistening ideas. Download our Shapes PowerPoint Templates because Our PowerPoint Templates and Slides will Embellish your thoughts. They will help you illustrate the brilliance of your ideas. Present our Marketing PowerPoint Templates because Your audience will believe you are the cats whiskers.Use these PowerPoint slides for presentations relating to Success business graph and percentage symbol, business, finance, signs, shapes, marketing. The prominent colors used in the PowerPoint template are Blue, Red, White.

Yellow Piggy Bank With Percentage Symbol PowerPoint Templates Ppt Backgrounds For Slides 0313
We present our Yellow Piggy Bank With Percentage Symbol PowerPoint Templates PPT Backgrounds For Slides 0313.Present our Money PowerPoint Templates because Our PowerPoint Templates and Slides are the chords of your song. String them along and provide the lilt to your views. Download and present our Finance PowerPoint Templates because It will mark the footprints of your journey. Illustrate how they will lead you to your desired destination. Present our Security PowerPoint Templates because Your ideas provide food for thought. Our PowerPoint Templates and Slides will help you create a dish to tickle the most discerning palate. Use our Shapes PowerPoint Templates because You can Channelise the thoughts of your team with our PowerPoint Templates and Slides. Urge them to focus on the goals you have set. Download and present our Signs PowerPoint Templates because Our PowerPoint Templates and Slides will let your team Walk through your plans. See their energy levels rise as you show them the way.Use these PowerPoint slides for presentations relating to Hand inserting quarter dollar coin into a piggy bank, money, shapes, symbol, security, finance. The prominent colors used in the PowerPoint template are Yellow, Red, Tan.

Control Charts A True Control Chart Ppt PowerPoint Presentation Inspiration Examples
This is a control charts a true control chart ppt powerpoint presentation inspiration examples. This is a five stage process. The stages in this process are product, percentage, marketing, business, management.

Pitch Deck Ppt Raise Funding Corporate Investors Use Of Funds In Different Areas By Percentage Diagrams PDF
This slide shows the uses of funds Reserve, Acquisition costs, Business Development, Innovation etc. of the company. Deliver and pitch your topic in the best possible manner with this pitch deck ppt raise funding corporate investors use of funds in different areas by percentage diagrams pdf. Use them to share invaluable insights on acquisitions, business development, product development and innovation and impress your audience. This template can be altered and modified as per your expectations. So, grab it now.

Pitch Deck For Raising Capital From Business Finances Use Of Funds In Different Areas By Percentage Introduction PDF
This slide shows the uses of funds Reserve, Acquisition costs, Business Development, Innovation etc. of the company. Deliver and pitch your topic in the best possible manner with this pitch deck for raising capital from business finances use of funds in different areas by percentage introduction pdf. Use them to share invaluable insights on business development, acquisitions, product development and innovation, operations and impress your audience. This template can be altered and modified as per your expectations. So, grab it now.
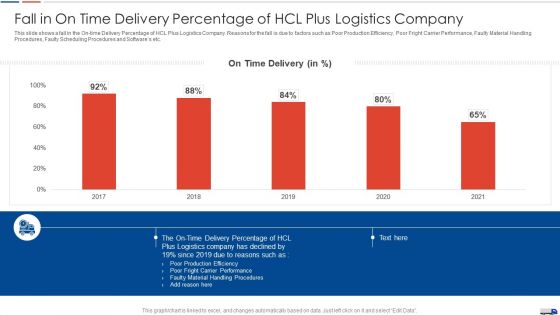
Strategies Create Good Proposition Fall In On Time Delivery Percentage Of Hcl Plus Logistics Company Diagrams PDF
This slide shows a fall in the On time Delivery Percentage of HCL Plus Logistics Company. Reasons for the fall is due to factors such as Poor Production Efficiency, Poor Fright Carrier Performance, Faulty Material Handling Procedures, Faulty Scheduling Procedures and Softwares etc. Deliver an awe inspiring pitch with this creative strategies create good proposition fall in on time delivery percentage of hcl plus logistics company diagrams pdf bundle. Topics like fall in on time delivery percentage of hcl plus logistics company can be discussed with this completely editable template. It is available for immediate download depending on the needs and requirements of the user.
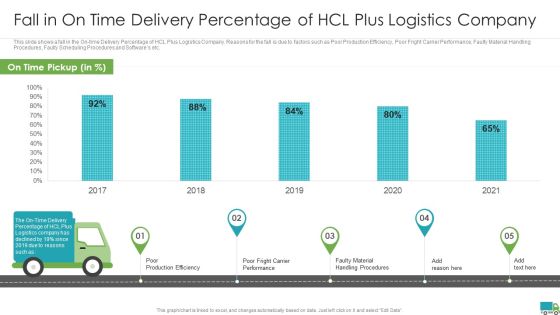
Generating Logistics Value Business Fall In On Time Delivery Percentage Of Hcl Plus Logistics Company Mockup PDF
This slide shows a fall in the On-time Delivery Percentage of HCL Plus Logistics Company. Reasons for the fall is due to factors such as Poor Production Efficiency, Poor Fright Carrier Performance, Faulty Material Handling Procedures, Faulty Scheduling Procedures and Softwares etc. Deliver an awe inspiring pitch with this creative generating logistics value business fall in on time delivery percentage of hcl plus logistics company mockup pdf bundle. Topics like fall in on time delivery percentage of hcl plus logistics company can be discussed with this completely editable template. It is available for immediate download depending on the needs and requirements of the user.
Percentage Of Revenue Generation By Product Line Shown With Converging Arrows Ppt PowerPoint Presentation Icon Slides PDF
Presenting this set of slides with name percentage of revenue generation by product line shown with converging arrows ppt powerpoint presentation icon slides pdf. This is a five stage process. The stages in this process are percentage of revenue generation by product line shown with converging arrows. This is a completely editable PowerPoint presentation and is available for immediate download. Download now and impress your audience.
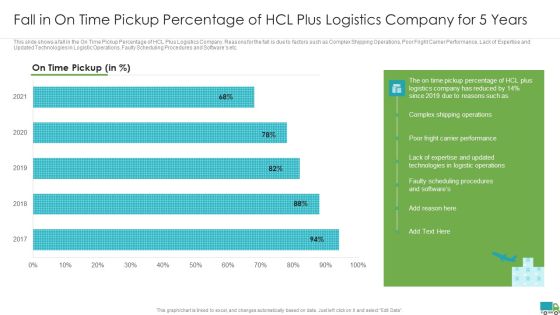
Generating Logistics Value Business Fall In On Time Pickup Percentage Of Hcl Plus Logistics Company Slides PDF
This slide shows a fall in the On Time Pickup Percentage of HCL Plus Logistics Company. Reasons for the fall is due to factors such as Complex Shipping Operations, Poor Fright Carrier Performance, Lack of Expertise and Updated Technologies in Logistic Operations, Faulty Scheduling Procedures and Softwares etc. Deliver and pitch your topic in the best possible manner with this generating logistics value business fall in on time pickup percentage of hcl plus logistics company slides pdf. Use them to share invaluable insights on fall in on time pickup percentage of hcl plus logistics company for 5 years and impress your audience. This template can be altered and modified as per your expectations. So, grab it now.
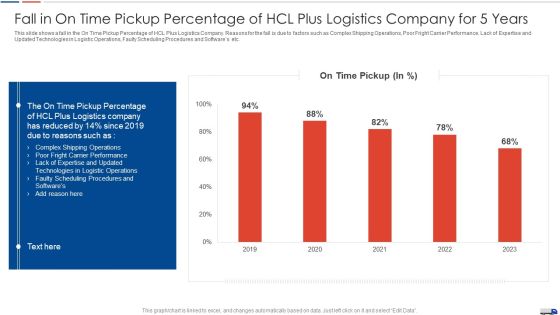
Strategies Create Good Proposition Fall In On Time Pickup Percentage Of Hcl Plus Logistics Company Introduction PDF
This slide shows a fall in the On Time Pickup Percentage of HCL Plus Logistics Company. Reasons for the fall is due to factors such as Complex Shipping Operations, Poor Fright Carrier Performance, Lack of Expertise and Updated Technologies in Logistic Operations, Faulty Scheduling Procedures and Softwares etc. Deliver and pitch your topic in the best possible manner with this strategies create good proposition fall in on time pickup percentage of hcl plus logistics company introduction pdf. Use them to share invaluable insights on fall in on time pickup percentage of hcl plus logistics company for 5 years and impress your audience. This template can be altered and modified as per your expectations. So, grab it now.

Control Charts Sample Value Ppt PowerPoint Presentation Infographics Demonstration
This is a control charts sample value ppt powerpoint presentation infographics demonstration. This is a five stage process. The stages in this process are product, percentage, marketing, business, management.

Business Operational Plan Pie Charts Ppt PowerPoint Presentation Templates
This is a business operational plan pie charts ppt powerpoint presentation templates. This is a three stage process. The stages in this process are finance, business, marketing, percentage.
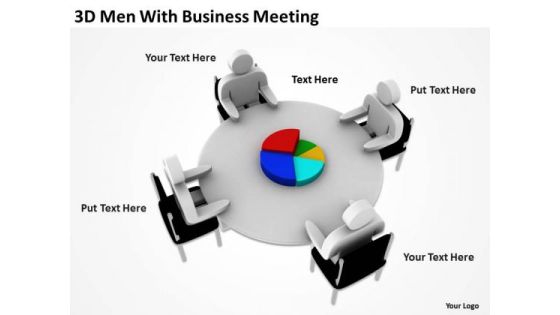
Business Charts 3d Men With PowerPoint Theme Meeting Templates
We present our business charts 3d men with powerpoint theme meeting templates.Download and present our People PowerPoint Templates because You are an avid believer in ethical practices. Highlight the benefits that accrue with our PowerPoint Templates and Slides. Present our Business PowerPoint Templates because Our PowerPoint Templates and Slides will provide weight to your words. They will bring out the depth of your thought process. Download our Finance PowerPoint Templates because It can be used to Set your controls for the heart of the sun. Our PowerPoint Templates and Slides will be the propellant to get you there. Use our Marketing PowerPoint Templates because Our PowerPoint Templates and Slides are Clear and concise. Use them and dispel any doubts your team may have. Download and present our Success PowerPoint Templates because It will Give impetus to the hopes of your colleagues. Our PowerPoint Templates and Slides will aid you in winning their trust.Use these PowerPoint slides for presentations relating to 3d, allocation, assets, association, budget, business, businessman, capital, chart, collaboration, common, company, contribution, contributor, cooperation, cooperative, corporation, deposit, diagram, distribution, economic, finance, financial, fund, graph, interest, investment, investor, joint, man, management, marketing, meeting, money, organization, ownership, participant, participation, partnership, people, percent, percentage, pie, profit, rate, sector, share, shareholder, stock, stockholder. The prominent colors used in the PowerPoint template are Gray, Red, Blue. Professionals tell us our business charts 3d men with powerpoint theme meeting templates will generate and maintain the level of interest you desire. They will create the impression you want to imprint on your audience. The feedback we get is that our capital PowerPoint templates and PPT Slides are designed by professionals PowerPoint presentation experts tell us our business charts 3d men with powerpoint theme meeting templates will make you look like a winner. You can be sure our budget PowerPoint templates and PPT Slides will help them to explain complicated concepts. People tell us our business charts 3d men with powerpoint theme meeting templates are designed by a team of presentation professionals. You can be sure our chart PowerPoint templates and PPT Slides will help you be quick off the draw. Just enter your specific text and see your points hit home.

3 Stages Parallel Organizational Charts Business Plan Downloads PowerPoint Slides
We present our 3 stages parallel organizational charts business plan downloads PowerPoint Slides.Use our Arrows PowerPoint Templates because Our PowerPoint Templates and Slides will provide you a launch platform. Give a lift off to your ideas and send them into orbit. Download our Shapes PowerPoint Templates because Our PowerPoint Templates and Slides will Embellish your thoughts. They will help you illustrate the brilliance of your ideas. Download our Gear Wheels PowerPoint Templates because Our PowerPoint Templates and Slides will provide weight to your words. They will bring out the depth of your thought process. Present our Business PowerPoint Templates because you can Set pulses racing with our PowerPoint Templates and Slides. They will raise the expectations of your team. Download our Success PowerPoint Templates because They will Put the wind in your sails. Skim smoothly over the choppy waters of the market.Use these PowerPoint slides for presentations relating to accounting, arrow, ascending, background, bank, blue, business, charts, compare, comparison, computer, corporate, count, descending, fame, famous, finance, generated, gradient, grow, growth, illustration, income, international, linear, money, papers, parallel, percentage, point, record, scale, shares, signs, stock, success, symbols, tax, tip, vary, white, world. The prominent colors used in the PowerPoint template are Yellow, Blue, Green.

Area Chart Ppt PowerPoint Presentation Show Background
This is a area chart ppt powerpoint presentation show background. This is a two stage process. The stages in this process are in percentage, chart, business, marketing, strategy.
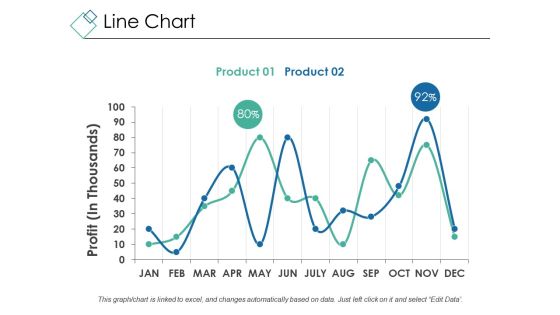
Line Chart Ppt PowerPoint Presentation Outline Design Ideas
This is a line chart ppt powerpoint presentation outline design ideas. This is a two stage process. The stages in this process are profit, percentage, chart, business, marketing.

Donut Pie Chart Ppt PowerPoint Presentation Show Outline
This is a donut pie chart ppt powerpoint presentation show outline. This is a six stage process. The stages in this process are business, marketing, percentage, chart, process.

Donut Pie Chart Ppt PowerPoint Presentation Outline Template
This is a donut pie chart ppt powerpoint presentation outline template. This is a five stage process. The stages in this process are business, marketing, percentage, chart, process.
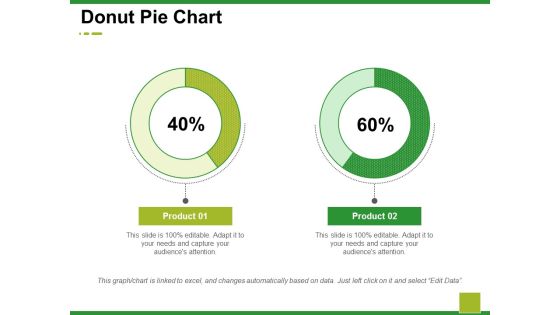
Donut Pie Chart Ppt PowerPoint Presentation Outline Skills
This is a donut pie chart ppt powerpoint presentation outline skills. This is a two stage process. The stages in this process are business, marketing, percentage, chart, strategy.

Area Chart Ppt PowerPoint Presentation Inspiration Demonstration
This is a area chart ppt powerpoint presentation inspiration demonstration. This is a two stage process. The stages in this process are sales in percentage, chart, percentage, business, marketing.

Area Chart Ppt PowerPoint Presentation Model Slides
This is a area chart ppt powerpoint presentation model slides. This is a two stage process. The stages in this process are business, marketing, sales in percentage, chart, percentage, finance.

Area Chart Ppt PowerPoint Presentation Portfolio Templates
This is a area chart ppt powerpoint presentation portfolio templates. This is a two stage process. The stages in this process are sales in percentage, chart, business, marketing, finance.

Area Chart Ppt PowerPoint Presentation Pictures Template
This is a area chart ppt powerpoint presentation pictures template. This is a two stage process. The stages in this process are sales in percentage, chart, business, marketing, strategy.

Area Chart Ppt PowerPoint Presentation Model Influencers
This is a area chart ppt powerpoint presentation model influencers. This is a two stage process. The stages in this process are sales in percentage, chart, business, marketing, finance.

Area Chart Ppt PowerPoint Presentation Layouts Images
This is a area chart ppt powerpoint presentation layouts images. This is a two stage process. The stages in this process are product, sales in percentage, area chart, percentage, finance.

Area Chart Ppt PowerPoint Presentation Model Introduction
This is a area chart ppt powerpoint presentation model introduction. This is a two stage process. The stages in this process are sales in percentage, area chart, percentage, business, marketing.

Area Chart Ppt PowerPoint Presentation Infographic Template Guidelines
This is a area chart ppt powerpoint presentation infographic template guidelines. This is a two stage process. The stages in this process are in percentage, chart, business, growth, strategy.

Donut Pie Chart Ppt PowerPoint Presentation File Infographic Template
This is a donut pie chart ppt powerpoint presentation file infographic template. This is a five stage process. The stages in this process are business, management, process, percentage, chart.
Business Charts Examples 3d Men Crossing Puzzle Completing Task PowerPoint Templates
We present our business charts examples 3d men crossing puzzle completing task PowerPoint templates.Use our People PowerPoint Templates because our PowerPoint Templates and Slides will give your ideas the shape. Use our Puzzles or Jigsaws PowerPoint Templates because It will Raise the bar of your Thoughts. They are programmed to take you to the next level. Use our Business PowerPoint Templates because our bewitching PowerPoint Templates and Slides will delight your audience with the magic of your words. Use our Leadership PowerPoint Templates because You have gained great respect for your brilliant ideas. Use our PowerPoint Templates and Slides to strengthen and enhance your reputation. Download and present our Shapes PowerPoint Templates because Our PowerPoint Templates and Slides will give good value for money. They also have respect for the value of your time.Use these PowerPoint slides for presentations relating to absence, abstract, achievement, add, addition, attached, boss, business,challenge, communication, community, competition, connection,cooperation, corporate, cross, figure, group, illustration, individuality, inspiration,internet, join, lead, leader, man, marketing, media, metaphor, model, network,networking, part, partnership, people, person, plus, shape, social, stand out from the crowd, strategy, success, symbol, team, teamwork, unique, web,winner, world. The prominent colors used in the PowerPoint template are Red, White, Gray. Customers tell us our business charts examples 3d men crossing puzzle completing task PowerPoint templates provide you with a vast range of viable options. Select the appropriate ones and just fill in your text. We assure you our business PowerPoint templates and PPT Slides are second to none. Customers tell us our business charts examples 3d men crossing puzzle completing task PowerPoint templates are designed to make your presentations professional. Use our challenge PowerPoint templates and PPT Slides are effectively colour coded to prioritise your plans They automatically highlight the sequence of events you desire. PowerPoint presentation experts tell us our business charts examples 3d men crossing puzzle completing task PowerPoint templates look good visually. You can be sure our boss PowerPoint templates and PPT Slides will make the presenter look like a pro even if they are not computer savvy.

Line Chart Ppt PowerPoint Presentation Styles Introduction
This is a line chart ppt powerpoint presentation styles introduction. This is a two stage process. The stages in this process are in percentage, product, chart, business, marketing.

Area Chart Ppt PowerPoint Presentation Background Designs
This is a area chart ppt powerpoint presentation background designs. This is a twelve stage process. The stages in this process are business, marketing, percentage, finance, chart.
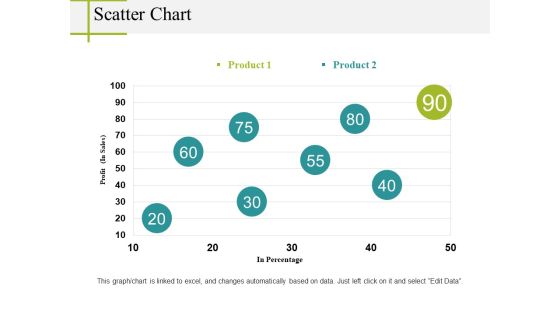
Scatter Chart Ppt PowerPoint Presentation Infographics Good
This is a scatter chart ppt powerpoint presentation infographics good. This is a two stage process. The stages in this process are in percentage, profit, chart, business, marketing.

Area Chart Ppt PowerPoint Presentation Diagrams
This is a area chart ppt powerpoint presentation diagrams.This is a two stage process. The stages in this process are in percentage, area chart, product.

Bubble Chart Ppt PowerPoint Presentation Layouts Demonstration
This is a bubble chart ppt powerpoint presentation icon structure. This is a three stage process. The stages in this process are product, sales in percentage, bubble chart.

Area Chart Ppt PowerPoint Presentation Outline Graphic Tips
This is a area chart ppt powerpoint presentation outline graphic tips. This is a two stage process. The stages in this process are business, sales in percentage, area chart, percentage, marketing.

Area Chart Ppt PowerPoint Presentation Infographics Good
This is a area chart ppt powerpoint presentation infographics good. This is a two stage process. The stages in this process are sales in percentage, product, area chart, business, percentage.
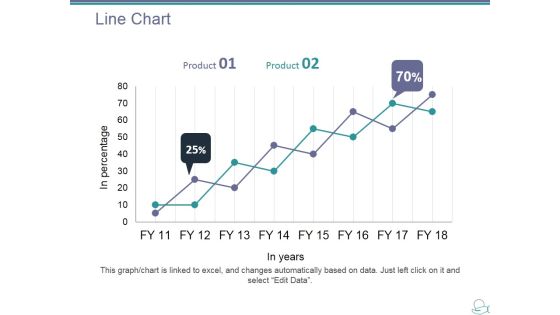
Line Chart Ppt PowerPoint Presentation Layouts Show
This is a line chart ppt powerpoint presentation layouts show. This is a two stage process. The stages in this process are product, in years, in percentage, line chart, growth.

Area Chart Ppt PowerPoint Presentation Show Professional
This is a area chart ppt powerpoint presentation show professional. This is a two stage process. The stages in this process are product, in percentage, area chart, growth, success.

Area Chart Ppt PowerPoint Presentation Inspiration Professional
This is a area chart ppt powerpoint presentation inspiration professional. This is a two stage process. The stages in this process are financial year, in percentage, area chart, finance, business, marketing.

Area Chart Ppt PowerPoint Presentation Ideas Professional
This is a area chart ppt powerpoint presentation ideas professional. This is a two stage process. The stages in this process are business, sales in percentage, area chart, marketing, finance.

Area Chart Ppt PowerPoint Presentation Model Inspiration
This is a area chart ppt powerpoint presentation model inspiration. This is a two stage process. The stages in this process are financial year, in percentage, area chart, business, marketing.
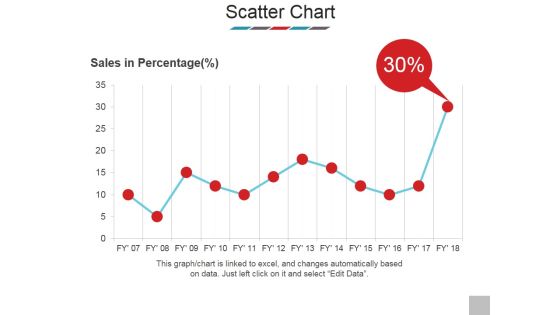
Scatter Chart Ppt PowerPoint Presentation Model Show
This is a scatter chart ppt powerpoint presentation model show. This is a one stage process. The stages in this process are sales in percentage, scatter chart, business, bar graph, marketing.

Area Chart Ppt PowerPoint Presentation Icon Show
This is a area chart ppt powerpoint presentation icon show. This is a two stage process. The stages in this process are product, financial year, in percentage, area chart.

Line Chart Ppt PowerPoint Presentation Gallery Rules
This is a line chart ppt powerpoint presentation gallery rules. This is a two stage process. The stages in this process are financial years, product, sales in percentage, line chart, growth.

Line Chart Ppt PowerPoint Presentation Gallery Templates
This is a line chart ppt powerpoint presentation gallery templates. This is a two stage process. The stages in this process are product, financial years, sales in percentage, line chart.

Area Chart Ppt PowerPoint Presentation Styles Professional
This is a area chart ppt powerpoint presentation styles professional. This is a two stage process. The stages in this process are sales in percentage, product, area chart.

Bar Chart Ppt PowerPoint Presentation Inspiration Outfit
This is a bar chart ppt powerpoint presentation inspiration outfit. This is a three stage process. The stages in this process are percentage, product, bar chart, marketing.
Pie Chart Ppt PowerPoint Presentation Icon Templates
This is a pie chart ppt powerpoint presentation icon templates. This is a four stage process. The stages in this process are chart, percentage, business, marketing, process.
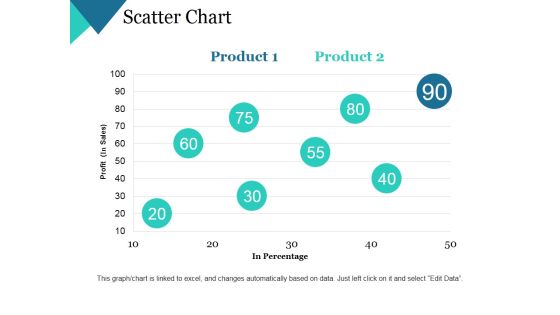
Scatter Chart Ppt PowerPoint Presentation Gallery Microsoft
This is a scatter chart ppt powerpoint presentation gallery microsoft. This is a two stage process. The stages in this process are profit, in percentage, business, marketing, chart.
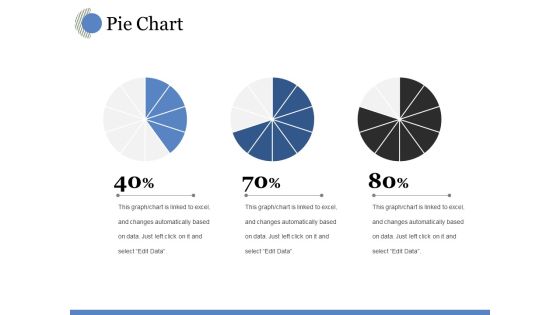
Pie Chart Ppt PowerPoint Presentation Professional Graphics
This is a pie chart ppt powerpoint presentation professional graphics. This is a three stage process. The stages in this process are chart, percentage, business, marketing, strategy.
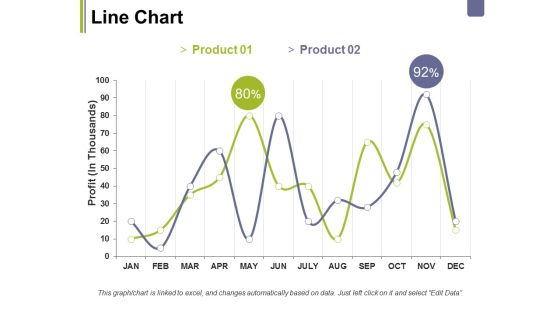
Line Chart Ppt PowerPoint Presentation Layouts Topics
This is a line chart ppt powerpoint presentation layouts topics. This is a two stage process. The stages in this process are business, profit, chart, percentage, graph, marketing.

Line Chart Ppt PowerPoint Presentation Portfolio Deck
This is a line chart ppt powerpoint presentation portfolio deck. This is a two stage process. The stages in this process are business, marketing, profit, chart, percentage.

Line Chart Ppt PowerPoint Presentation Summary Demonstration
This is a line chart ppt powerpoint presentation summary demonstration. This is a two stage process. The stages in this process are business, profit, line chart, percentage, finance.

Scatter Chart Ppt PowerPoint Presentation Styles Information
This is a scatter chart ppt powerpoint presentation styles information. This is a one stage process. The stages in this process are business, marketing, finance, scatter chart, percentage.

Scatter Chart Ppt PowerPoint Presentation Styles Guidelines
This is a scatter chart ppt powerpoint presentation styles guidelines. This is a two stage process. The stages in this process are scatter chart, percentage, product.

Radar Chart Ppt PowerPoint Presentation Professional Ideas
This is a radar chart ppt powerpoint presentation professional ideas. This is a two stage process. The stages in this process are product, percentage, management, marketing, chart.

Pie Chart Ppt PowerPoint Presentation Example 2015
This is a pie chart ppt powerpoint presentation example 2015. This is a five stage process. The stages in this process are pie chart, percentage, business, marketing, management.

Combo Chart Ppt PowerPoint Presentation Portfolio Template
This is a combo chart ppt powerpoint presentation portfolio template. This is a three stage process. The stages in this process are product, business, marketing, combo chart, percentage.
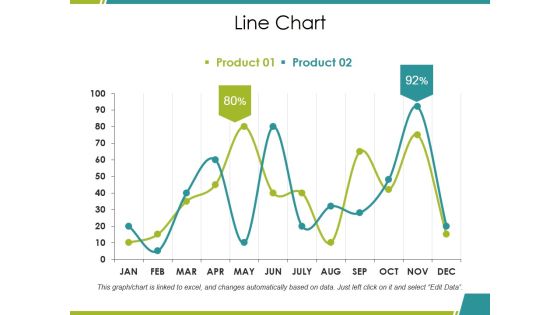
Line Chart Ppt PowerPoint Presentation Model Pictures
This is a line chart ppt powerpoint presentation model pictures. This is a two stage process. The stages in this process are product, percentage, growth, line chart, business.
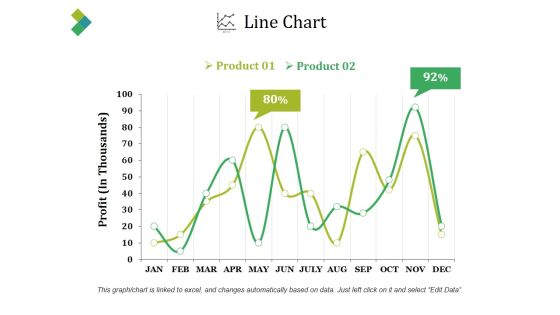
Line Chart Ppt PowerPoint Presentation Slides
This is a line chart ppt powerpoint presentation slides. This is a two stage process. The stages in this process are product, profit, percentage, finance, line chart.
Donut Chart Ppt PowerPoint Presentation Icon Rules
This is a donut chart ppt powerpoint presentation icon rules. This is a four stage process. The stages in this process are donut chart, percentage, business, management, process.

Pie Chart Ppt PowerPoint Presentation Professional Pictures
This is a pie chart ppt powerpoint presentation professional pictures. This is a five stage process. The stages in this process are pie chart, percentage, finance, process, business.
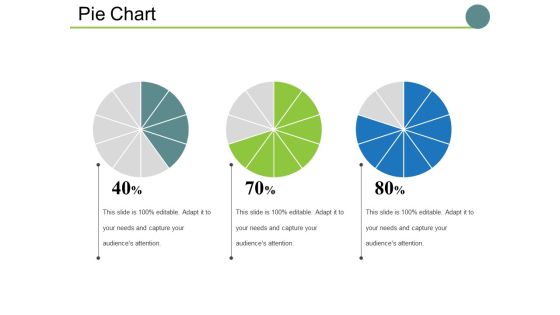
Pie Chart Ppt PowerPoint Presentation File Good
This is a pie chart ppt powerpoint presentation file good. This is a three stage process. The stages in this process are chart, percentage, business, process, management.
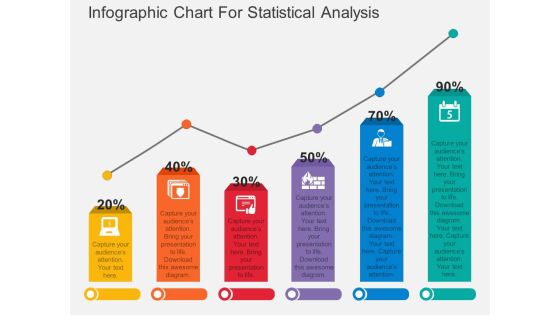
Infographic Chart For Statistical Analysis Powerpoint Template
Download this exclusive business diagram to display statistical analysis. This PowerPoint template contains bar chart with percentage values. This diagram is useful for business presentations.
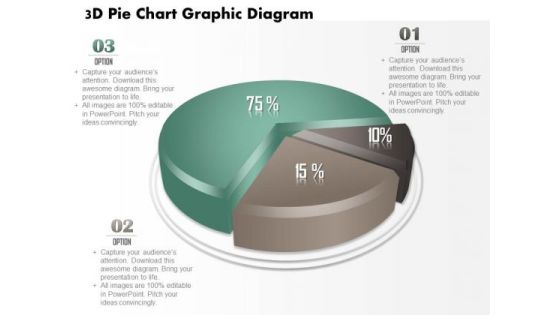
Business Diagram 3d Pie Chart Graphic Diagram PowerPoint Ppt Presentation
This business diagram displays 3d pie chart. It contains pie chart with percentage ratios. This pie chart is a visual way of displaying data. Use this diagram to make outstanding presentations.

Pie Chart For Customer Analysis Powerpoint Slides
This PowerPoint template has been designed with percentage ratio pie chart. This PPT slide can be used to display customer analysis. You can download finance PowerPoint template to prepare awesome presentations.

Employees Sales Performance Comparison Circle Chart Topics PDF
This slide shows the sales share percentage chart by salespersons to gain an understanding of the performance of employees. It includes teams and their sales percentage. Pitch your topic with ease and precision using this Employees Sales Performance Comparison Circle Chart Topics PDF. This layout presents information on Employees Sales Performance, Comparison Circle Chart. It is also available for immediate download and adjustment. So, changes can be made in the color, design, graphics or any other component to create a unique layout.

Area Chart Ppt PowerPoint Presentation Inspiration Elements
This is a area chart ppt powerpoint presentation inspiration elements. This is a two stage process. The stages in this process are chart, growth, percentage, strategy, business, marketing.

Area Chart Ppt PowerPoint Presentation Layouts Gridlines
This is a area chart ppt powerpoint presentation layouts gridlines. This is a two stage process. The stages in this process are area chart, product, percentage, analysis, capture.

Bar Chart Ppt PowerPoint Presentation Portfolio Slides
This is a bar chart ppt powerpoint presentation portfolio slides. This is a one stage process. The stages in this process are product, percentage, marketing, business, bar chart.
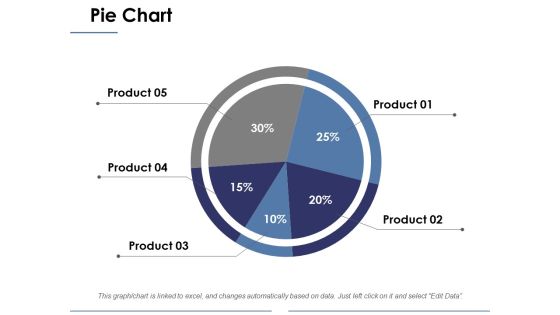
Pie Chart Ppt PowerPoint Presentation Infographics Shapes
This is a pie chart ppt powerpoint presentation infographics shapes. This is a five stage process. The stages in this process are business, pie chart, marketing, percentage, strategy.

Bubble Chart Ppt PowerPoint Presentation Portfolio Files
This is a bubble chart ppt powerpoint presentation portfolio files. This is a five stage process. The stages in this process are profit, bubble chart, in percentage.
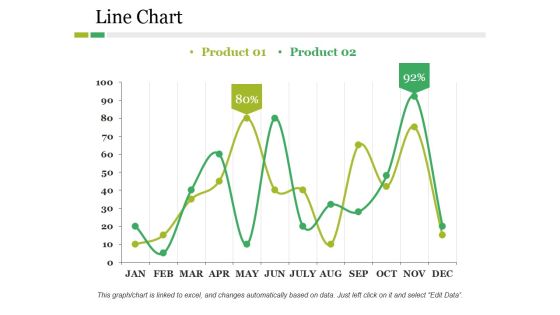
Line Chart Ppt PowerPoint Presentation Pictures Structure
This is a line chart ppt powerpoint presentation pictures structure. This is a two stage process. The stages in this process are product, business, line chart, finance, percentage.

Area Chart Ppt PowerPoint Presentation Summary Example Introduction
This is a area chart ppt powerpoint presentation summary example introduction. This is a two stage process. The stages in this process are product, sales in percentage, percentage, area chart, business.
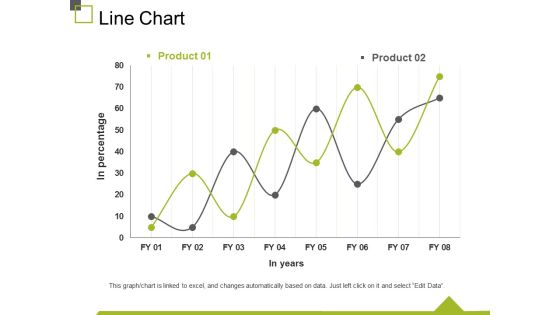
Line Chart Ppt PowerPoint Presentation Infographics Display
This is a line chart ppt powerpoint presentation infographics display. This is a two stage process. The stages in this process are in percentage, in years, chart, business, marketing.

Bubble Chart Ppt PowerPoint Presentation Outline Deck
This is a bubble chart ppt powerpoint presentation outline deck. This is a two stage process. The stages in this process are in percentage, profit, bubble chart, business, marketing.

Area Chart Ppt PowerPoint Presentation Inspiration Themes
This is a area chart ppt powerpoint presentation inspiration themes. This is a two stage process. The stages in this process are sales in percentage, product, area chart, business, marketing.

Area Chart Ppt PowerPoint Presentation Slides Example
This is a area chart ppt powerpoint presentation slides example. This is a two stage process. The stages in this process are sales in percentage, product, area chart, business, finance.

Line Chart Ppt PowerPoint Presentation Infographic Template Design Ideas
This is a line chart ppt powerpoint presentation infographic template design ideas. This is a two stage process. The stages in this process are product, in millions, percentage, line chart, success.

Column Chart Ppt PowerPoint Presentation Portfolio Example Topics
This is a column chart ppt powerpoint presentation portfolio example topics. This is a two stage process. The stages in this process are product, financial year, sales in percentage, column chart.

Area Chart Ppt PowerPoint Presentation Styles Graphics Download
This is a area chart ppt powerpoint presentation styles graphics download. This is a two stage process. The stages in this process are product, in percentage, area chart, business, marketing.
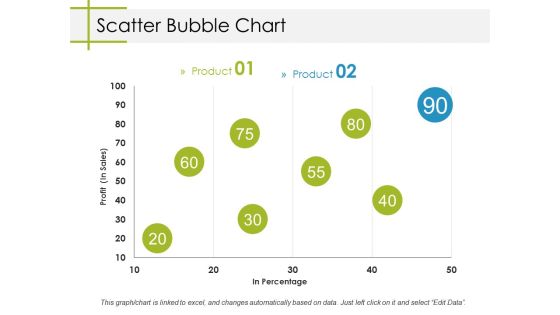
Scatter Bubble Chart Ppt PowerPoint Presentation Model Designs
This is a scatter bubble chart ppt powerpoint presentation model designs. This is a two stage process. The stages in this process are business, profit, in percentage, bubble chart, marketing.

Area Chart Ppt PowerPoint Presentation Infographics Graphics Pictures
This is a area chart ppt powerpoint presentation infographics graphics pictures. This is a two stage process. The stages in this process are business, sales in percentage, area chart, marketing, graph.

Area Chart Ppt PowerPoint Presentation Inspiration Background Designs
This is a area chart ppt powerpoint presentation inspiration background designs. This is a two stage process. The stages in this process are business, sales in percentage, area chart, marketing, finance.

Area Chart Ppt PowerPoint Presentation Layouts Background Designs
This is a area chart ppt powerpoint presentation layouts background designs. This is a two stage process. The stages in this process are business, marketing, in percentage, area chart, finance.

Bubble Chart Ppt PowerPoint Presentation Summary Graphics Tutorials
This is a bubble chart ppt powerpoint presentation summary graphics tutorials. This is a three stage process. The stages in this process are product, sales in percentage, bubble chart.

Bar Chart Ppt PowerPoint Presentation Ideas Graphic Tips
This is a bar chart ppt powerpoint presentation ideas graphic tips. This is a seven stage process. The stages in this process are sales in percentage, bar chart, growth, business, marketing.

Column Chart For Financial Analysis Powerpoint Slides
This PowerPoint template has been designed with graphics of column chart with percentage values. You may use this business slide design for topics like financial analysis and planning. This PPT slide is powerful tool to describe your ideas.
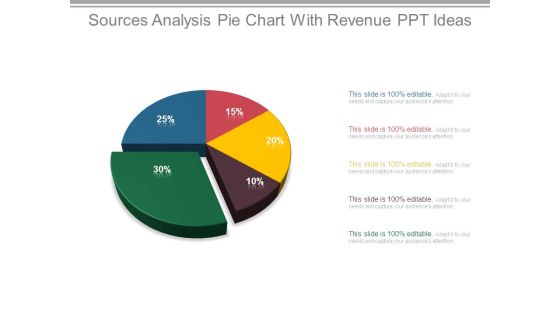
Sources Analysis Pie Chart With Revenue Ppt Ideas
This is a sources analysis pie chart with revenue ppt ideas. This is a five stage process. The stages in this process are finance, success, business, marketing, percentage, pie chart.

Area Chart Ppt PowerPoint Presentation Icon Graphics Tutorials
This is a area chart ppt powerpoint presentation icon graphics tutorials. This is a two stage process. The stages in this process are chart, percentage, business, growth, strategy.

Area Chart Ppt PowerPoint Presentation Outline Graphics Download
This is a area chart ppt powerpoint presentation outline graphics download. This is a two stage process. The stages in this process are chart, percentage, business, marketing, strategy.
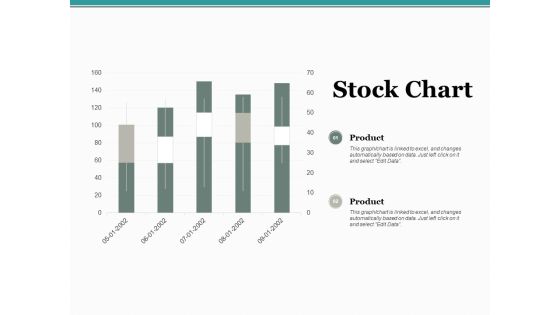
Stock Chart Ppt PowerPoint Presentation Professional Slide Download
This is a stock chart ppt powerpoint presentation professional slide download. This is a two stage process. The stages in this process are product, percentage, management, marketing, chart.

Donut Pie Chart Ppt PowerPoint Presentation Infographics Styles
This is a donut pie chart ppt powerpoint presentation infographics styles. This is a six stage process. The stages in this process are chart, percentage, years, business, management.
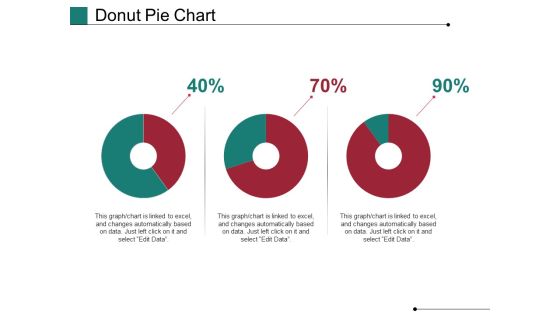
Donut Pie Chart Ppt PowerPoint Presentation Portfolio Backgrounds
This is a donut pie chart ppt powerpoint presentation portfolio backgrounds. This is a three stage process. The stages in this process are chart, percentage, business, marketing.
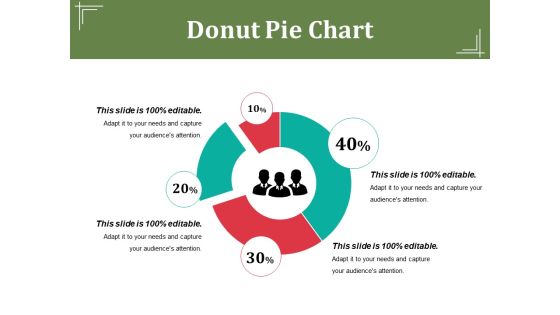
Donut Pie Chart Ppt PowerPoint Presentation Pictures Example
This is a donut pie chart ppt powerpoint presentation pictures example. This is a four stage process. The stages in this process are chart, percentage, business, management, process.
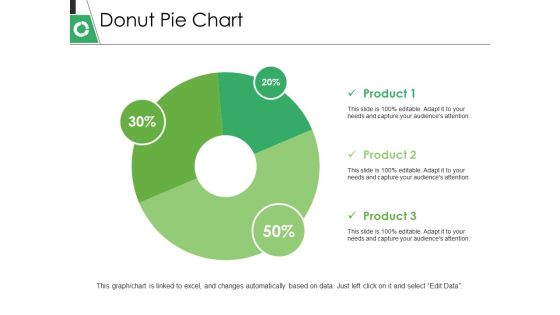
Donut Pie Chart Ppt PowerPoint Presentation Outline Visuals
This is a donut pie chart ppt powerpoint presentation outline visuals. This is a three stage process. The stages in this process are business, marketing, chart, percentage, strategy.

Donut Pie Chart Ppt PowerPoint Presentation Infographics Summary
This is a donut pie chart ppt powerpoint presentation infographics summary. This is a four stage process. The stages in this process are business, marketing, chart, percentage, process.

Bubble Chart Ppt PowerPoint Presentation Outline Demonstration
This is a bubble chart ppt powerpoint presentation outline demonstration. This is a two stage process. The stages in this process are bubble chart, product, in percentage.

Area Chart Ppt PowerPoint Presentation Portfolio Examples
This is a area chart ppt powerpoint presentation portfolio examples. This is a two stage process. The stages in this process are product, area chart, sales in percentage.

Area Chart Ppt PowerPoint Presentation Model Guidelines
This is a area chart ppt powerpoint presentation model guidelines. This is a two stage process. The stages in this process are product, area chart, sales in percentage.

Area Chart Ppt PowerPoint Presentation Inspiration Slides
This is a area chart ppt powerpoint presentation inspiration slides. This is a two stage process. The stages in this process are area chart, product, in percentage.

Pie Chart Ppt PowerPoint Presentation Show Outfit
This is a pie chart ppt powerpoint presentation show outfit. This is a five stage process. The stages in this process are chart, business, marketing, percentage, strategy.
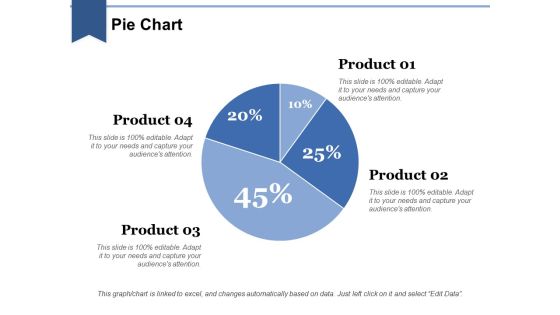
Pie Chart Ppt PowerPoint Presentation Slide
This is a pie chart ppt powerpoint presentation slide. This is a four stage process. The stages in this process are pie chart, business, management, percentage, Process.

Car Company Market Share Circle Chart Slides PDF
This slide depicts the market share percentage chart of car companies in the USA to determine the market leader. It shows percentage share of General motors, Toyota, Stellanis, and Hyundai. Showcasing this set of slides titled Car Company Market Share Circle Chart Slides PDF. The topics addressed in these templates are Car Company Market, Share Circle Chart. All the content presented in this PPT design is completely editable. Download it and make adjustments in color, background, font etc. as per your unique business setting.

Area Chart Ppt PowerPoint Presentation Icon Summary
This is a area chart ppt powerpoint presentation icon summary. This is a two stage process. The stages in this process are financial year, area chart, in percentage, product.

Bar Chart Ppt PowerPoint Presentation Icon Layout
This is a bar chart ppt powerpoint presentation icon layout. This is a one stage process. The stages in this process are sales in percentage, financial years, bar chart, finance, marketing.

Combo Chart Ppt PowerPoint Presentation Model Vector
This is a combo chart ppt powerpoint presentation model vector. This is a two stage process. The stages in this process are financial year, in percentage, business, marketing, combo chart.

Line Chart Ppt PowerPoint Presentation Inspiration Graphics
This is a line chart ppt powerpoint presentation inspiration graphics. This is a two stage process. The stages in this process are line chart, growth, percentage, marketing, analysis, business.
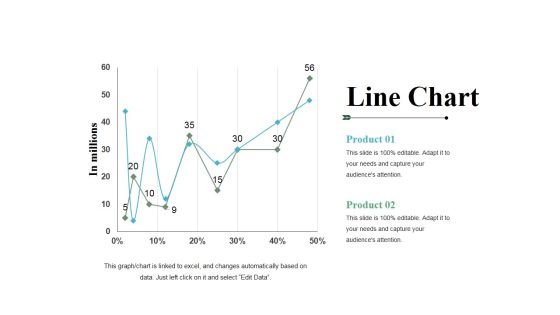
Line Chart Ppt PowerPoint Presentation File Templates
This is a line chart ppt powerpoint presentation file templates. This is a two stage process. The stages in this process are product, line chart, growth, percentage, in millions.

Line Chart Ppt PowerPoint Presentation Infographics Infographics
This is a line chart ppt powerpoint presentation infographics infographics. This is a two stage process. The stages in this process are product, sales in percentage, financial year, line chart, finance.

Clustered Chart Ppt PowerPoint Presentation Outline Templates
This is a clustered chart ppt powerpoint presentation outline templates. This is a three stage process. The stages in this process are product, in percentage, in years, clustered chart.

Bar Chart Ppt PowerPoint Presentation Model Picture
This is a bar chart ppt powerpoint presentation model picture. This is a two stage process. The stages in this process are product, sales in percentage, financial years, bar chart.
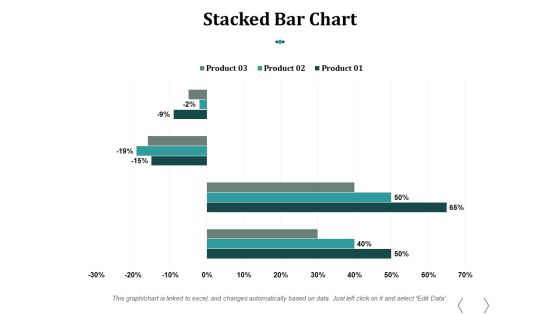
Stacked Bar Chart Ppt PowerPoint Presentation Influencers
This is a stacked bar chart ppt powerpoint presentation influencers. This is a three stage process. The stages in this process are stacked bar chart, product, percentage, finance, business.

Area Chart Ppt PowerPoint Presentation Outline Inspiration
This is a area chart ppt powerpoint presentation outline inspiration. This is a two stage process. The stages in this process are chart, finance, marketing, business, percentage.

Line Chart Ppt PowerPoint Presentation Ideas Portfolio
This is a line chart ppt powerpoint presentation ideas portfolio. This is a two stage process. The stages in this process are line chart, in years, in percentage.

Area Chart Ppt PowerPoint Presentation Inspiration Images
This is a area chart ppt powerpoint presentation inspiration images. This is a two stage process. The stages in this process are area chart, product, sales in percentage.

Pie Chart Ppt PowerPoint Presentation Design Templates
This is a pie chart ppt powerpoint presentation design templates. This is a two stage process. The stages in this process are pie chart, finance, business, marketing, percentage.
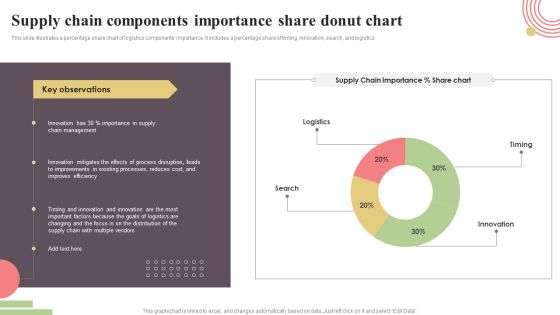
Supply Chain Components Importance Share Donut Chart Rules PDF
This slide illustrates a percentage share chart of logistics components importance. It includes a percentage share of timing, innovation, search, and logistics. Showcasing this set of slides titled Supply Chain Components Importance Share Donut Chart Rules PDF. The topics addressed in these templates are Timing, Innovation, Search, Logistics. All the content presented in this PPT design is completely editable. Download it and make adjustments in color, background, font etc. as per your unique business setting.

Insurance Policy Proportion Types Column Chart With Key Insights Ideas PDF
This slide illustrates policy percentage chart in various cities of Unites States of America to increase policy sales. It depicts cities, and insurance counts Showcasing this set of slides titled Insurance Policy Proportion Types Column Chart With Key Insights Ideas PDF. The topics addressed in these templates are Floods Hurricanes, Tourists Visit, Invest Property. All the content presented in this PPT design is completely editable. Download it and make adjustments in color, background, font etc. as per your unique business setting.
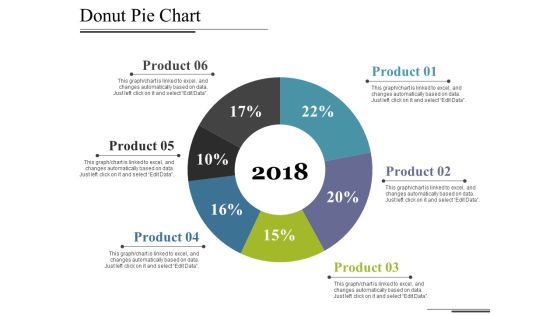
Donut Pie Chart Ppt PowerPoint Presentation Show Grid
This is a donut pie chart ppt powerpoint presentation show grid. This is a six stage process. The stages in this process are chart, years, percentage, business, management.

Area Chart Ppt PowerPoint Presentation Slides Graphics Design
This is a area chart ppt powerpoint presentation slides graphics design. This is a two stage process. The stages in this process are area chart, in percentage, product.
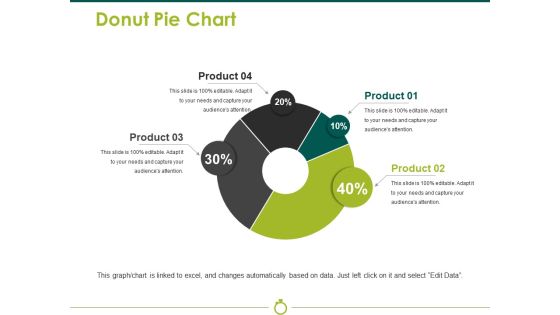
Donut Pie Chart Ppt PowerPoint Presentation File Portrait
This is a donut pie chart ppt powerpoint presentation file portrait. This is a four stage process. The stages in this process are chart, business, percentage, process, management.

Donut Pie Chart Ppt PowerPoint Presentation Styles Summary
This is a donut pie chart ppt powerpoint presentation styles summary. This is a five stage process. The stages in this process are business, chart, marketing, percentage, process.
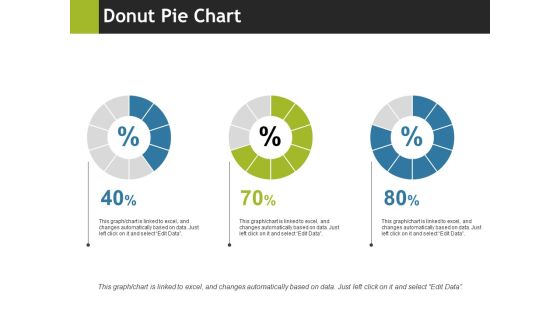
Donut Pie Chart Ppt PowerPoint Presentation File Grid
This is a donut pie chart ppt powerpoint presentation file grid. This is a three stage process. The stages in this process are business, marketing, chart, process, percentage.

Annual Chronic Patients Change Linear Chart Demonstration PDF
The following slide highlights the percentage change of chronically ill patients. It shows the annual percentage change for the for a decade Showcasing this set of slides titled Annual Chronic Patients Change Linear Chart Demonstration PDF. The topics addressed in these templates are Key Observations, Annual Percentage, Linear Chart. All the content presented in this PPT design is completely editable. Download it and make adjustments in color, background, font etc. as per your unique business setting.

Area Chart Ppt PowerPoint Presentation Styles Show
This is a area chart ppt powerpoint presentation styles show. This is a two stage process. The stages in this process are business, marketing, area chart, sales in percentage, percentage.

Column Chart Ppt PowerPoint Presentation Layouts Vector
This is a column chart ppt powerpoint presentation layouts vector. This is a two stage process. The stages in this process are product, column chart, bar graph, percentage, finance.

Area Chart Ppt PowerPoint Presentation Ideas Icon
This is a area chart ppt powerpoint presentation ideas icon. This is a two stage process. The stages in this process are product, area chart, sales in percentage, growth, success.
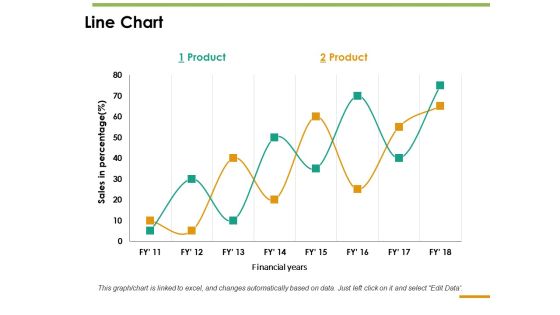
Line Chart Ppt PowerPoint Presentation Inspiration Guide
This is a line chart ppt powerpoint presentation inspiration guide. This is a two stage process. The stages in this process are line chart, sales in percentage, product, financial years.

Line Chart Ppt PowerPoint Presentation Professional Grid
This is a line chart ppt powerpoint presentation professional grid. This is a two stage process. The stages in this process are sales in percentage, financial years, product, line chart.
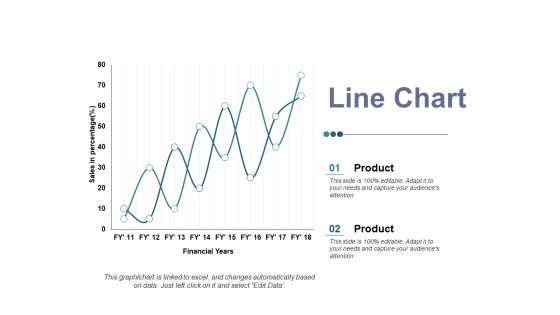
Line Chart Ppt PowerPoint Presentation Ideas Elements
This is a line chart ppt powerpoint presentation ideas elements. This is a two stage process. The stages in this process are product, sales in percentage, financial year, business, line chart.

Scatter Chart Ppt PowerPoint Presentation Outline Ideas
This is a scatter chart ppt powerpoint presentation outline ideas. This is a two stage process. The stages in this process are product, scatter chart, business, in percentage, marketing.

Pie Chart Ppt PowerPoint Presentation Infographics Show
This is a pie chart ppt powerpoint presentation infographics show. This is a three stage process. The stages in this process are process, percentage, business, marketing, success, pie chart.
Scatter Chart Ppt PowerPoint Presentation Icon Example Introduction
This is a scatter chart ppt powerpoint presentation icon example introduction. This is a two stage process. The stages in this process are product, profit, in percentage, growth, scattered chart.
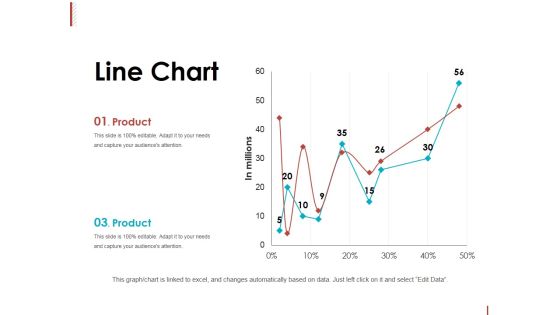
Line Chart Ppt PowerPoint Presentation Slides Graphics Tutorials
This is a line chart ppt powerpoint presentation slides graphics tutorials. This is a two stage process. The stages in this process are product, in millions, line chart, percentage, finance.

Bar Chart Ppt PowerPoint Presentation Professional Graphics Download
This is a bar chart ppt powerpoint presentation professional graphics download. This is a seven stage process. The stages in this process are sales in percentage, financial years, chart, business.
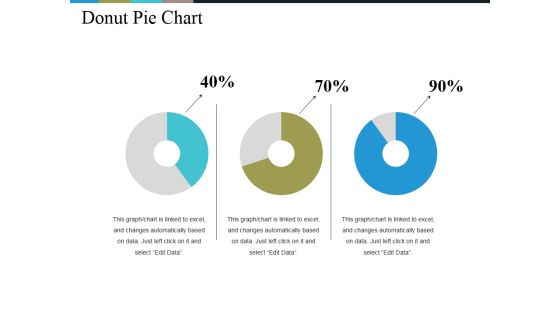
Donut Pie Chart Ppt PowerPoint Presentation Infographics Background Images
This is a donut pie chart ppt powerpoint presentation infographics background images. This is a three stage process. The stages in this process are chart, percentage, business, management, process.

Donut Pie Chart Ppt PowerPoint Presentation Ideas Background Image
This is a donut pie chart ppt powerpoint presentation ideas background image. This is a four stage process. The stages in this process are chart, percentage, process, management, circular.
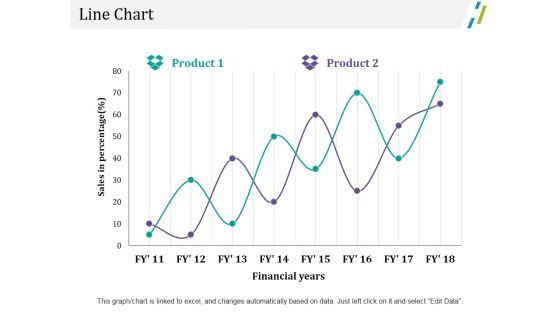
Line Chart Ppt PowerPoint Presentation Outline File Formats
This is a line chart ppt powerpoint presentation outline file formats. This is a two stage process. The stages in this process are business, marketing, sales in percentage, financial years, chart.

Line Chart Ppt PowerPoint Presentation File Designs Download
This is a line chart ppt powerpoint presentation file designs download. This is a two stage process. The stages in this process are business, marketing, profit, line chart, percentage.
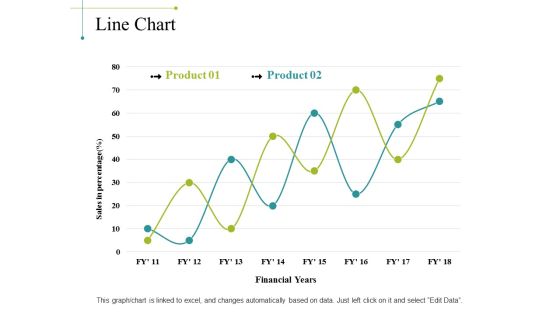
Line Chart Ppt PowerPoint Presentation Portfolio Background Image
This is a line chart ppt powerpoint presentation portfolio background image. This is a two stage process. The stages in this process are sales in percentage, financial years, chart, business, marketing, finance.
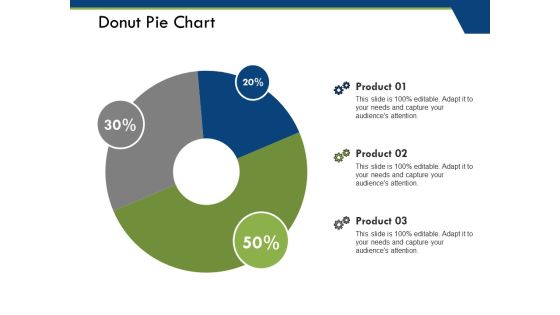
Donut Pie Chart Ppt PowerPoint Presentation Pictures File Formats
This is a donut pie chart ppt powerpoint presentation pictures file formats. This is a three stage process. The stages in this process are product, donut pie chart, percentage, business, marketing.
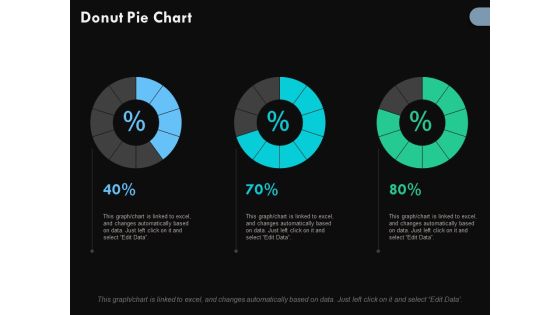
Donut Pie Chart Finance Ppt PowerPoint Presentation Outline Portrait
This is a donut pie chart finance ppt powerpoint presentation outline portrait. This is a three stage process. The stages in this process are donut pie chart, percentage, marketing, business, analysis.
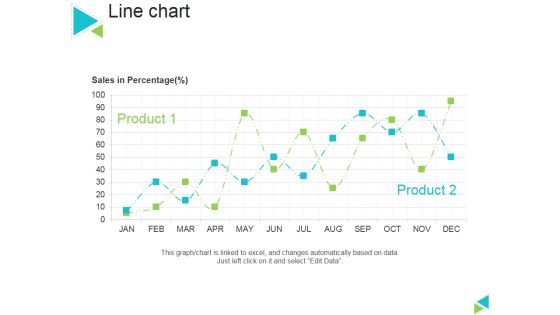
Line Chart Ppt PowerPoint Presentation Gallery Master Slide
This is a line chart ppt powerpoint presentation gallery master slide. This is a two stage process. The stages in this process are sales in percentage, product, line chart.

Bubble Chart Ppt PowerPoint Presentation Layouts Design Ideas
This is a bubble chart ppt powerpoint presentation layouts design ideas. This is a eight stage process. The stages in this process are in percentage, profit, bubble chart, business, marketing.
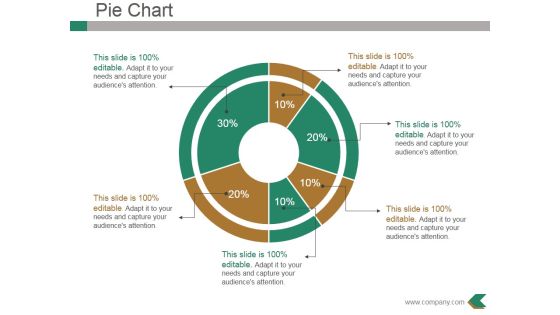
Pie Chart Ppt PowerPoint Presentation File Background Designs
This is a pie chart ppt powerpoint presentation file background designs. This is a six stage process. The stages in this process are business, marketing, pie chart, percentage, finance.
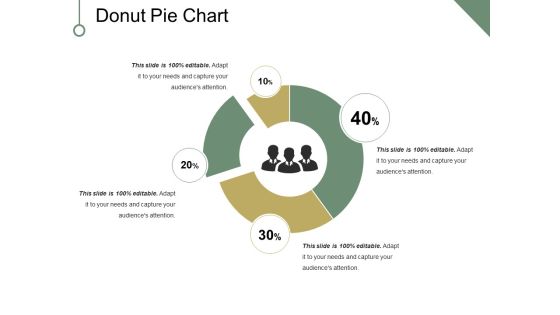
Donut Pie Chart Ppt PowerPoint Presentation Ideas File Formats
This is a donut pie chart ppt powerpoint presentation ideas file formats. This is a four stage process. The stages in this process are chart, percentage, business, marketing, strategy.

Donut Pie Chart Ppt PowerPoint Presentation File Graphics Template
This is a donut pie chart ppt powerpoint presentation file graphics template. This is a five stage process. The stages in this process are business, marketing, chart, percentage, strategy.

Pie Chart Ppt PowerPoint Presentation Layouts Background Designs
This is a pie chart ppt powerpoint presentation layouts background designs. This is a three stage process. The stages in this process are business, chart, percentage, management, marketing, strategy.
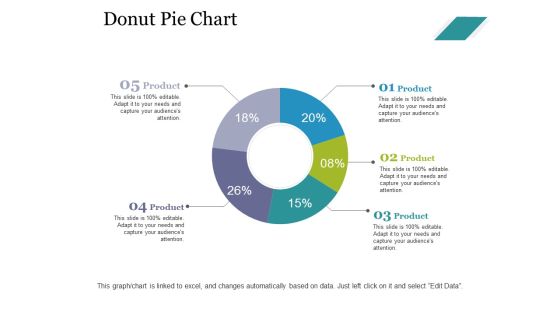
Donut Pie Chart Ppt PowerPoint Presentation Slides Design Ideas
This is a donut pie chart ppt powerpoint presentation slides design ideas. This is a five stage process. The stages in this process are business, marketing, chart, percentage, process.

Donut Pie Chart Ppt PowerPoint Presentation Summary Example
This is a donut pie chart ppt powerpoint presentation summary example. This is a three stage process. The stages in this process are business, management, percentage, process, donut chart.

Area Chart Ppt PowerPoint Presentation Show Graphics Tutorials
This is a area chart ppt powerpoint presentation show graphics tutorials. This is a two stage process. The stages in this process are area chart, percentage, product, marketing, management.
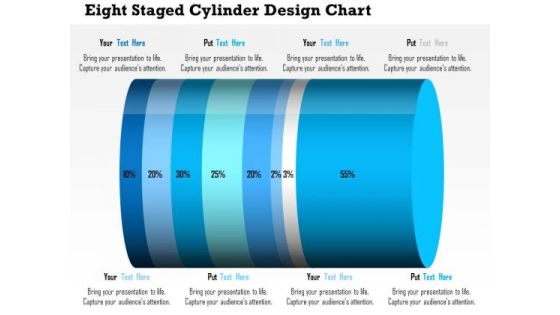
Business Daigram Eight Staged Cylinder Design Chart Presentation Templets
This business diagram contains eight staged cylinder design chart with percentage ratio. Download this diagram to display financial analysis. Use this diagram to make business and marketing related presentations.

Change Management Performance Dashboard Ppt PowerPoint Presentation Slides Rules
This is a change management performance dashboard ppt powerpoint presentation slides rules. This is a two stage process. The stages in this process are percentage, chart, marketing, management.

Company Shareholder Structure With Percentages Template PDF
This slide shows companys Shareholder structure with shareholder names and their respective percentages. Deliver and pitch your topic in the best possible manner with this company shareholder structure with percentages template pdf. Use them to share invaluable insights on company shareholder structure with percentages and impress your audience. This template can be altered and modified as per your expectations. So, grab it now.

Company Shareholder Structure With Percentages Clipart PDF
Deliver an awe-inspiring pitch with this creative company shareholder structure with percentages clipart pdf. bundle. Topics like angel investors, promoters, micro venture capitalist. can be discussed with this completely editable template. It is available for immediate download depending on the needs and requirements of the user.

Area Chart Ppt PowerPoint Presentation Layouts Vector
This is a area chart ppt powerpoint presentation layouts vector. This is a two stage process. The stages in this process are area chart, product, sales in percentage, financial year.

Area Chart Ppt PowerPoint Presentation Infographics Guide
This is a area chart ppt powerpoint presentation infographics guide. This is a two stage process. The stages in this process are area chart, product, sales in percentage, finance, business.

Scatter Bubble Chart Ppt PowerPoint Presentation Professional
This is a scatter bubble chart ppt powerpoint presentation professional. This is a three stage process. The stages in this process are scatter bubble chart, product, in price, percentage, business.

Bar Chart Ppt PowerPoint Presentation Professional Files
This is a bar chart ppt powerpoint presentation professional files. This is a seven stage process. The stages in this process are bar chart, product, sales in percentage, financial years.

Area Chart Ppt PowerPoint Presentation Pictures Graphics Design
This is a area chart ppt powerpoint presentation pictures graphics design. This is a two stage process. The stages in this process are charts, success, finance, percentage, growth.
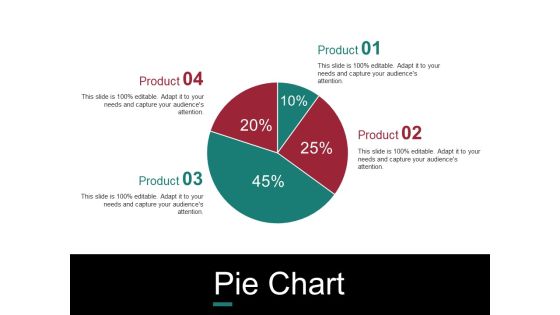
Pie Chart Ppt PowerPoint Presentation Outline Example Topics
This is a pie chart ppt powerpoint presentation outline example topics. This is a four stage process. The stages in this process are chart, process, business, percentage.
 Home
Home