AI PPT Maker
Templates
PPT Bundles
Design Services
Business PPTs
Business Plan
Management
Strategy
Introduction PPT
Roadmap
Self Introduction
Timelines
Process
Marketing
Agenda
Technology
Medical
Startup Business Plan
Cyber Security
Dashboards
SWOT
Proposals
Education
Pitch Deck
Digital Marketing
KPIs
Project Management
Product Management
Artificial Intelligence
Target Market
Communication
Supply Chain
Google Slides
Research Services
 One Pagers
All Categories
-
Home
- Customer Favorites
- Percentage Charts
Percentage Charts

Column Chart Ppt PowerPoint Presentation Slides Show
This is a column chart ppt powerpoint presentation slides show. This is a two stage process. The stages in this process are column chart, product, sales in percentage, financial year, growth.

Pie Chart Ppt PowerPoint Presentation Ideas Designs
This is a pie chart ppt powerpoint presentation ideas designs. This is a six stage process. The stages in this process are pie chart, business, management, marketing, percentage, product.
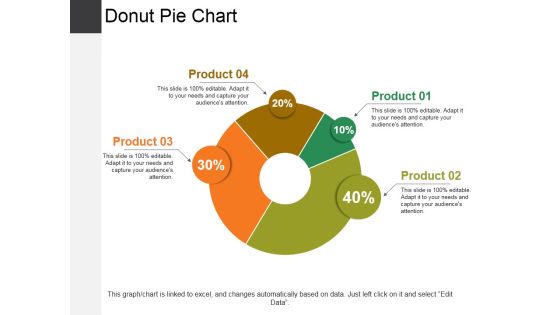
Donut Pie Chart Ppt PowerPoint Presentation Styles Show
This is a donut pie chart ppt powerpoint presentation styles show. This is a four stage process. The stages in this process are chart, business, management, percentage, process.
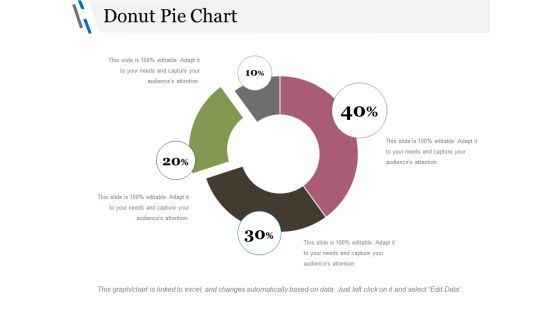
Donut Pie Chart Ppt PowerPoint Presentation Gallery Infographics
This is a donut pie chart ppt powerpoint presentation gallery infographics. This is a four stage process. The stages in this process are chart, business, management, percentage, process.

Combo Chart Ppt PowerPoint Presentation Shapes
This is a combo chart ppt powerpoint presentation shapes. This is a eight stage process. The stages in this process are combo chart, business, marketing, sales in percentage, bar graph.

Area Chart Ppt PowerPoint Presentation Inspiration Rules
This is a area chart ppt powerpoint presentation inspiration rules. This is a two stage process. The stages in this process are area chart, business, marketing, sales in percentage, product.

Area Chart Ppt PowerPoint Presentation Inspiration Graphics
This is a area chart ppt powerpoint presentation inspiration graphics. This is a two stage process. The stages in this process are product, area chart, business, growth, sales in percentage.

Bar Chart Ppt PowerPoint Presentation Inspiration Demonstration
This is a bar chart ppt powerpoint presentation inspiration demonstration. This is a two stage process. The stages in this process are bar chart, financial years, sales in percentage, product, finance.

Bar Chart Ppt PowerPoint Presentation Infographic Template Picture
This is a bar chart ppt powerpoint presentation infographic template picture. This is a two stage process. The stages in this process are financial, in percentage, business, marketing, bar chart.

Area Chart Ppt PowerPoint Presentation Infographics Visual Aids
This is a area chart ppt powerpoint presentation infographics visual aids. This is a two stage process. The stages in this process are product, area chart, in percentage, growth, success.

Scatter Chart Ppt PowerPoint Presentation Show Graphic Images
This is a scatter chart ppt powerpoint presentation show graphic images. This is a one stage process. The stages in this process are in percentage, in billions, scatter chart.
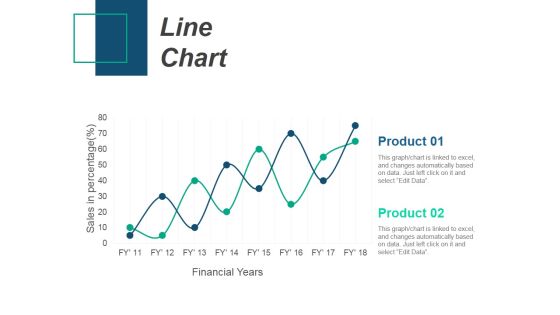
Line Chart Ppt PowerPoint Presentation Infographic Template Introduction
This is a line chart ppt powerpoint presentation infographic template introduction. This is a two stage process. The stages in this process are product, sales in percentage, financial years, line chart.
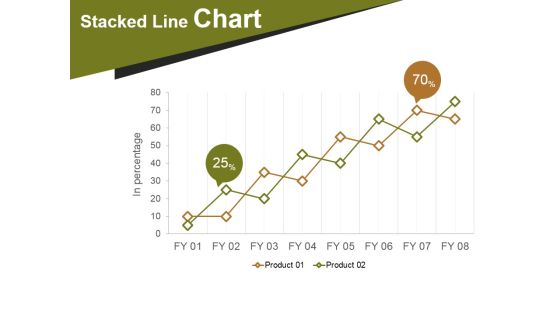
Stacked Line Chart Template 2 Ppt PowerPoint Presentation Rules
This is a stacked line chart template 2 ppt powerpoint presentation rules. This is a two stage process. The stages in this process are stacked line chart, in percentage, product.

Area Chart Ppt PowerPoint Presentation Infographic Template Model
This is a area chart ppt powerpoint presentation infographic template model. This is a two stage process. The stages in this process are product, area chart, growth, percentage, success.

Donut Pie Chart Ppt PowerPoint Presentation Pictures Master Slide
This is a donut pie chart ppt powerpoint presentation pictures master slide. This is a four stage process. The stages in this process are chart, business, percentage, process, circular.

Pie Chart Ppt PowerPoint Presentation Inspiration Example File
This is a pie chart ppt powerpoint presentation inspiration example file. This is a four stage process. The stages in this process are pie chart, finance, percentage, business, marketing.
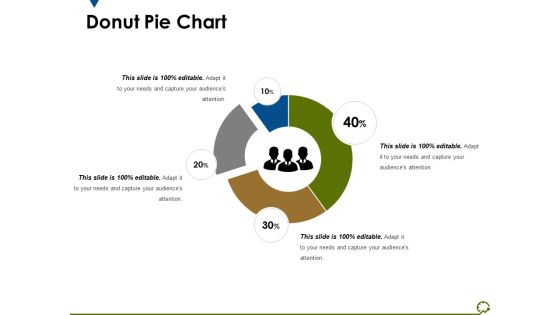
Donut Pie Chart Ppt PowerPoint Presentation Show Styles
This is a donut pie chart ppt powerpoint presentation show styles. This is a four stage process. The stages in this process are chart, business, process, management, percentage.

Column Chart Ppt PowerPoint Presentation Ideas Vector
This is a column chart ppt powerpoint presentation ideas vector. This is a two stage process. The stages in this process are column chart, product, financial years, sales in percentage, growth.
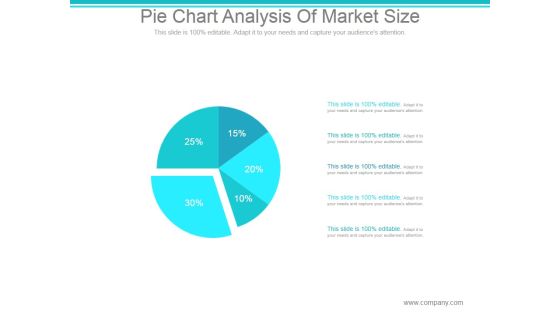
Pie Chart Analysis Of Market Size Ppt PowerPoint Presentation Show
This is a pie chart analysis of market size ppt powerpoint presentation show. This is a five stage process. The stages in this process are chart, graph, pie, percentage, business.

Column Chart Ppt PowerPoint Presentation Layouts File Formats
This is a column chart ppt powerpoint presentation layouts file formats. This is a three stage process. The stages in this process are column chart, product, in percentage, year, finance.

Scatter Chart Template 1 Ppt PowerPoint Presentation Outline Gridlines
This is a scatter chart template 1 ppt powerpoint presentation outline gridlines. This is a one stage process. The stages in this process are scatter chart, sales in percentage, business, marketing, growth.

Area Chart Ppt PowerPoint Presentation Icon Layout Ideas
This is a area chart ppt powerpoint presentation icon layout ideas. This is a two stage process. The stages in this process are area chart, sales in percentage, years, planning, business.

Stacked Line Chart Ppt PowerPoint Presentation Model Show
This is a stacked line chart ppt powerpoint presentation model show. This is a two stage process. The stages in this process are stacked line chart, product, profit, percentage, growth.

Bar Chart Ppt PowerPoint Presentation Slides Design Ideas
This is a bar chart ppt powerpoint presentation slides design ideas. This is a six stage process. The stages in this process are product, bar chart, sales in percentage.
Line Chart Ppt PowerPoint Presentation Infographic Template Icons
This is a line chart ppt powerpoint presentation infographic template icons. This is a two stage process. The stages in this process are sales in percentage, financial years, product, line chart.

Area Chart Ppt PowerPoint Presentation Infographics Graphics Tutorials
This is a area chart ppt powerpoint presentation infographics graphics tutorials. This is a two stage process. The stages in this process are product, area chart, sales in percentage.

Line Chart Ppt PowerPoint Presentation Summary Graphic Tips
This is a line chart ppt powerpoint presentation summary graphic tips. This is a two stage process. The stages in this process are line chart, product, in percentage, analysis, business.

Bubble Chart Ppt PowerPoint Presentation Infographic Template Layouts
This is a bubble chart ppt powerpoint presentation infographic template layouts. This is a two stage process. The stages in this process are bubble chart, product, sales in percentage, growth.
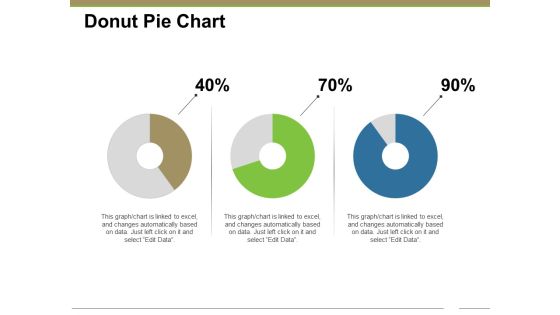
Donut Pie Chart Ppt PowerPoint Presentation Infographic Template Aids
This is a donut pie chart ppt powerpoint presentation infographic template aids. This is a three stage process. The stages in this process are chart, business, management, process, percentage.

Column Chart Ppt PowerPoint Presentation Gallery Design Inspiration
This is a column chart ppt powerpoint presentation gallery design inspiration. This is a two stage process. The stages in this process are column chart, product, sales in percentage, financial years.

Area Chart Ppt PowerPoint Presentation Infographics File Formats
This is a area chart ppt powerpoint presentation infographics file formats. This is a two stage process. The stages in this process are area chart, product, sales in percentage, growth, success.

Stacked Column Chart Ppt PowerPoint Presentation Summary Gallery
This is a stacked column chart ppt powerpoint presentation summary gallery. This is a two stage process. The stages in this process are stacked column chart, product, in years, growth, percentage.
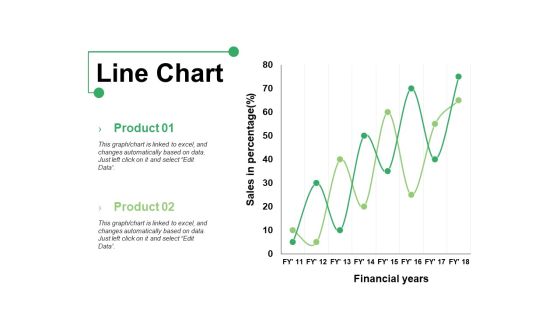
Line Chart Ppt PowerPoint Presentation Show Graphics Example
This is a line chart ppt powerpoint presentation show graphics example. This is a two stage process. The stages in this process are product, line chart, financial years, sales in percentage.

Area Chart Ppt PowerPoint Presentation Inspiration Icons Ppt PowerPoint Presentation Professional File Formats
This is a area chart ppt powerpoint presentation inspiration icons ppt powerpoint presentation professional file formats. This is a two stage process. The stages in this process are area chart, product, percentage, business, growth.

Company Shareholder Structure With Percentages Ppt Show Example PDF
This slide shows companys Shareholder structure with shareholder names and their respective percentages.Deliver an awe-inspiring pitch with this creative company shareholder structure with percentages ppt show example pdf. bundle. Topics like promoters, micro venture capitalist, accelerators can be discussed with this completely editable template. It is available for immediate download depending on the needs and requirements of the user.

Company Shareholder Structure With Percentages Ppt Model PDF
This slide shows companys Shareholder structure with shareholder names and their respective percentages. Deliver an awe-inspiring pitch with this creative company shareholder structure with percentages ppt model pdf bundle. Topics like shareholder, promoters, angel investors can be discussed with this completely editable template. It is available for immediate download depending on the needs and requirements of the user.

Company Shareholder Structure With Percentages Ppt Professional Microsoft PDF
This slide shows companys Shareholder structure with shareholder names and their respective percentages. Deliver and pitch your topic in the best possible manner with this company shareholder structure with percentages ppt professional microsoft pdf. Use them to share invaluable insights on company shareholder structure with percentagesg and impress your audience. This template can be altered and modified as per your expectations. So, grab it now.
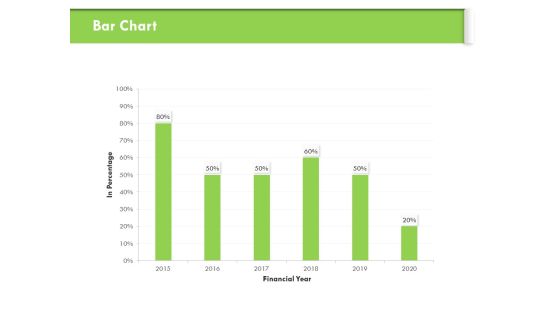
Understanding Organizational Structures Bar Chart Ppt Professional Visuals PDF
Presenting this set of slides with name understanding organizational structures bar chart ppt professional visuals pdf. The topics discussed in these slides are bar chart, financial year, percentage. This is a completely editable PowerPoint presentation and is available for immediate download. Download now and impress your audience.

Business Framework Slide Showing Variances And Percentages PowerPoint Presentation
Green and red four arrows in reverse direction have been used to design this power point template slide. This PPT slide contains the concept of variance and percentage. Display finance and data calculation in your presentation by using this exclusive PPT slide.
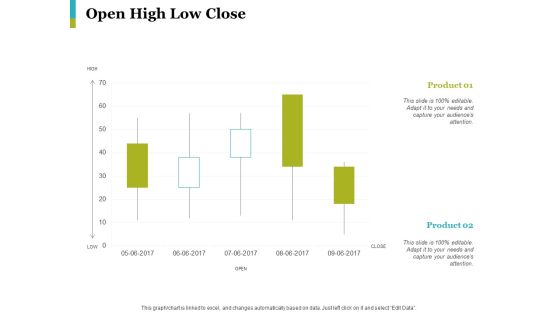
Open High Low Close Ppt PowerPoint Presentation Styles Graphics Example
This is a open high low close ppt powerpoint presentation styles graphics example.This is a two stage process. The stages in this process are product, percentage, chart, management, marketing.
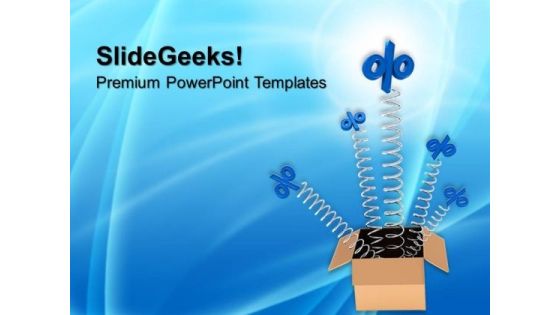
Box With Percentages Business PowerPoint Templates And PowerPoint Themes 0712
Box With Percentages Business PowerPoint Templates And PowerPoint Themes Business Power Points-Microsoft Powerpoint Templates and Background with box with percentage

Business Diagram Thermometer With Percentages Growth Presentation Template
This business diagram has been crafted with graphic of thermometer and percentage values. This PPT diagram can be used for science and finance related presentations.

Business Diagram Bars For Profit Percentages Presentation Template
Download this exclusive business diagram to present profit in percentage ratio. This slide contains the graphic of bars. This diagram can be useful for business presentations.

Achieved And Pending Workplace Diversity Objectives Chart Guidelines PDF
This slide displays the bar chart representing the percentage of diversity goals achieved. It also includes some key insights such as an increase in the women workforce in tech roles, increase in director level black representation, etc. Showcasing this set of slides titled Achieved And Pending Workplace Diversity Objectives Chart Guidelines PDF. The topics addressed in these templates are Achieved And Pending Workplace, Diversity Objectives Chart. All the content presented in this PPT design is completely editable. Download it and make adjustments in color, background, font etc. as per your unique business setting.
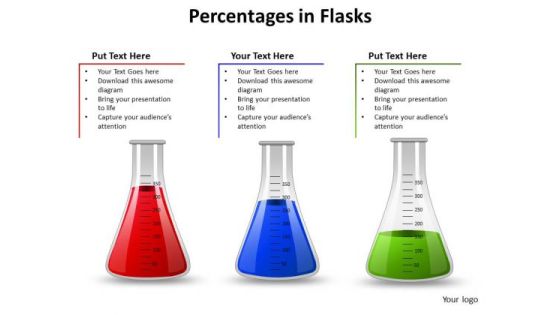
Business Framework Model Percentages In Flasks Marketing Diagram
Your Listeners Will Never Doodle. Our Business Framework Model Percentages In Flasks Marketing Diagram Powerpoint Templates Will Hold Their Concentration.

Editable Percentages Conversion Funnel PowerPoint Templates Ppt Slides
Editable Percentages Conversion Funnel PowerPoint templates PPT Slides-These high quality powerpoint pre-designed slides and powerpoint templates have been carefully created by our professional team to help you impress your audience. All slides have been created and are 100% editable in powerpoint. Each and every property of any graphic - color, size, orientation, shading, outline etc. can be modified to help you build an effective powerpoint presentation. Any text can be entered at any point in the powerpoint template or slide. Simply DOWNLOAD, TYPE and PRESENT! These PowerPoint presentation slides can be used to represent themes relating to --arrow, business, chart, choice, development, diagram, financial, flow, funnel, liquid, phase, process, product, select, separate, shape, sift, silver, spout, transparent-Editable Percentages Conversion Funnel PowerPoint templates PPT Slides

Company Profit Share With Percentages Ppt PowerPoint Presentation Influencers
This is a company profit share with percentages ppt powerpoint presentation influencers. This is one stage process. The stages in this process are canada, brazil, eurozone, ireland, world, russia, china, japan, australia, india.

Company Budget Figures With Margin Percentages Ppt PowerPoint Presentation Templates
This is a company budget figures with margin percentages ppt powerpoint presentation templates. This is six stage process. The stages in this process are campaign, daily budget, max pub cost, max of budget, number of days at or above budget, margin.
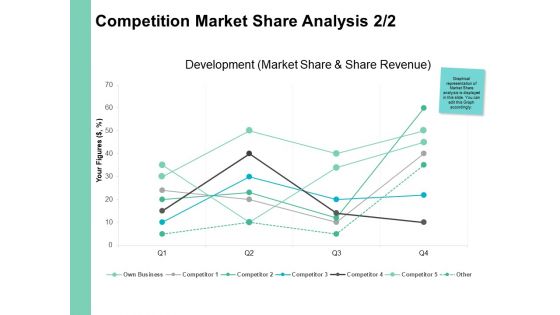
Competition Market Share Analysis Percentages Ppt PowerPoint Presentation Styles Ideas
Presenting this set of slides with name competition market share analysis percentages ppt powerpoint presentation styles ideas. The topics discussed in these slides are marketing, business, management, planning, strategy. This is a completely editable PowerPoint presentation and is available for immediate download. Download now and impress your audience.

Comparison Percentages Ppt PowerPoint Presentation Styles Clipart Images
Presenting this set of slides with name comparison percentages ppt powerpoint presentation styles clipart images. This is a three stage process. The stages in this process are compare, marketing, business, management, planning. This is a completely editable PowerPoint presentation and is available for immediate download. Download now and impress your audience.
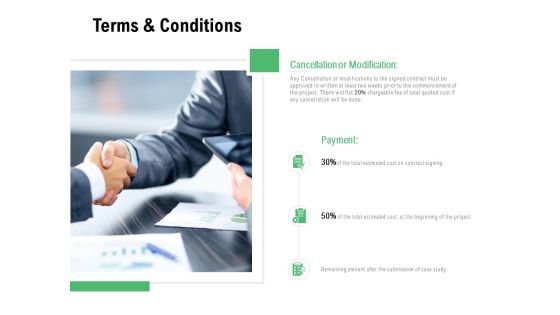
Terms And Conditions Percentages Ppt PowerPoint Presentation Model Portrait
Presenting this set of slides with name terms and conditions percentages ppt powerpoint presentation model portrait. This is a one stage process. The stages in this process are opportunity, business, management, planning, strategy. This is a completely editable PowerPoint presentation and is available for immediate download. Download now and impress your audience.

Business Diagram Timeline Slider Percentages Info Graphic Presentation Template
This business diagram has been designed with graphic of slider. This slider contains the three tags. Use this timeline diagram in your business presentation to show time based events and growth.

Profit Chart Success PowerPoint Templates And PowerPoint Themes 1012
Profit Chart Success PowerPoint Templates And PowerPoint Themes 1012-The above template displays a diagram of a profit chart with percentages on tab. This image represents the concept of business success. It is a useful captivating tool conceived to enable you to define your message in your Business and Marketing PPT presentations. Go ahead and add personality to your presentations with our high quality growth business chart template.-Profit Chart Success PowerPoint Templates And PowerPoint Themes 1012-This PowerPoint template can be used for presentations relating to-Success profit chart graphic, business, finance, success, money, marketing
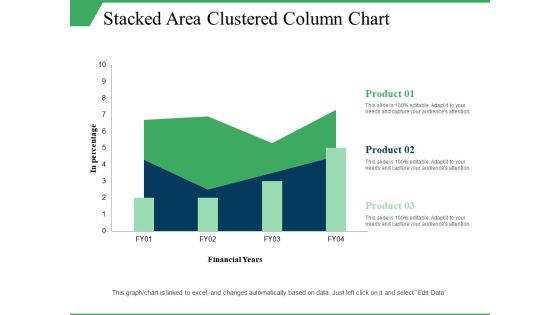
Stacked Area Clustered Column Chart Ppt PowerPoint Presentation Visual Aids Model
This is a stacked area clustered column chart ppt powerpoint presentation visual aids model. This is a three stage process. The stages in this process are in percentage, product, financial years, growth, column chart.

Employee Performance Information Chart Powerpoint Slides
This dashboard template contains employee picture with percentage slides. This dashboard PowerPoint template conveys employees performance in a visual manner. Download this PPT slide for quick decision-making.

Bar Chart Ppt PowerPoint Presentation File Slide
This is a bar chart ppt powerpoint presentation file slide. This is a one stage process. The stages in this process are sales in percentage financial years, business, marketing, strategy, graph.

Crm Sales Rep Dashboard Ppt PowerPoint Presentation Shapes
This is a crm sales rep dashboard ppt powerpoint presentation shapes. This is a three stage process. The stages in this process are business, finance, percentage, graph, chart.

Two Teams Performance Analysis Chart Powerpoint Slides
This PowerPoint template has been designed with icons of two teams with percentage values. Download this PPT slide to depict team?s performance analysis. Deliver amazing presentations to mesmerize your audience by using this PPT slide design.

Four Months Sales Statistics Chart Powerpoint Slides
This PowerPoint template has been designed with four shopping bags with percentage values. Download this PPT slide to display four months sales statistics. Add this slide to your presentation and impress your superiors.
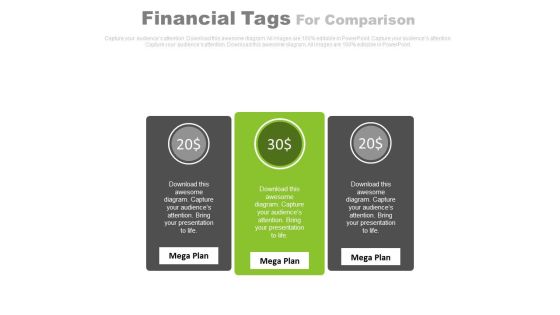
Three Text Tags Compare Chart Powerpoint Slides
This PowerPoint template has been designed with text tags and percentage data. You may download this PPT slide to display data comparison and analysis. Add this slide to your presentation and impress your superiors.

Retail Outlet Revenue Growth Chart Mockup PDF
This slide shows the revenue growth line chart of a retail store which includes passing footfall, customers per day, percentage of customer who purchased, revenue per day and revenue per year. Pitch your topic with ease and precision using this retail outlet revenue growth chart mockup pdf This layout presents information on Retail outlet revenue growth chart It is also available for immediate download and adjustment. So, changes can be made in the color, design, graphics or any other component to create a unique layout.

Weekly Performance Incentive Ceiling Chart Demonstration PDF
This slide illustrates tabular representation of bonus ceiling and percentage of performance bonus allowed for sales team working in a corporation. It includes various levels like platinum, gold, silver and quartz etc. Presenting Weekly Performance Incentive Ceiling Chart Demonstration PDF to dispense important information. This template comprises one stages. It also presents valuable insights into the topics including Level, Performance, Incentive Ceiling. This is a completely customizable PowerPoint theme that can be put to use immediately. So, download it and address the topic impactfully.

6 Stages Illustration Of Circular Pie Chart Simple Business Plan PowerPoint Slides
We present our 6 stages illustration of circular pie chart simple business plan PowerPoint Slides.Present our Circle Charts PowerPoint Templates because You have gained great respect for your brilliant ideas. Use our PowerPoint Templates and Slides to strengthen and enhance your reputation. Download our Business PowerPoint Templates because Our PowerPoint Templates and Slides are created by a hardworking bunch of busybees. Always flitting around with solutions gauranteed to please. Download and present our Shapes PowerPoint Templates because These PowerPoint Templates and Slides will give the updraft to your ideas. See them soar to great heights with ease. Use our Signs PowerPoint Templates because Our PowerPoint Templates and Slides are truly out of this world. Even the MIB duo has been keeping tabs on our team. Download and present our Metaphors-Visual Concepts PowerPoint Templates because Our PowerPoint Templates and Slides are a sure bet. Gauranteed to win against all odds. Use these PowerPoint slides for presentations relating to business, chart, circle, circular, diagram, economy, finance, framework, graph, isolated, percentage, pie chart, results, scheme, statistics, stats, strategy, success. The prominent colors used in the PowerPoint template are Purple, Yellow, Green.
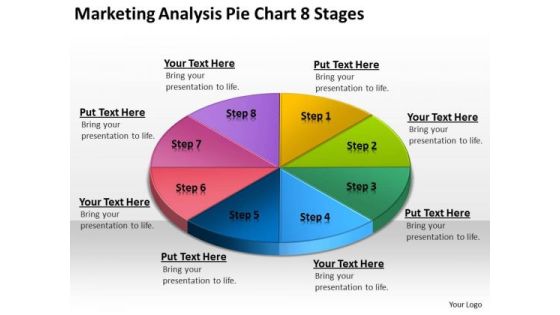
Marketing Analysis Pie Chart 8 Stages Business Plan Basics PowerPoint Templates
We present our marketing analysis pie chart 8 stages business plan basics PowerPoint templates.Download and present our Circle Charts PowerPoint Templates because Our PowerPoint Templates and Slides will Activate the energies of your audience. Get their creative juices flowing with your words. Present our Business PowerPoint Templates because Our PowerPoint Templates and Slides will let you meet your Deadlines. Use our Shapes PowerPoint Templates because Our PowerPoint Templates and Slides will effectively help you save your valuable time. They are readymade to fit into any presentation structure. Present our Signs PowerPoint Templates because You can Connect the dots. Fan expectations as the whole picture emerges. Use our Metaphors-Visual Concepts PowerPoint Templates because Our PowerPoint Templates and Slides will let your words and thoughts hit bullseye everytime.Use these PowerPoint slides for presentations relating to business, chart, circle, circular, diagram, economy, finance, framework, graph, isolated, percentage, pie chart, results, scheme, statistics, stats, strategy, success. The prominent colors used in the PowerPoint template are Yellow, Green, Blue.

Chart Data Comparison 7 Stages Examples Of Business Plans For PowerPoint Slides
We present our chart data comparison 7 stages examples of business plans for PowerPoint Slides.Download and present our Circle Charts PowerPoint Templates because You are well armed with penetrative ideas. Our PowerPoint Templates and Slides will provide the gunpowder you need. Use our Business PowerPoint Templates because It can be used to Set your controls for the heart of the sun. Our PowerPoint Templates and Slides will be the propellant to get you there. Present our Shapes PowerPoint Templates because You will get more than you ever bargained for. Download and present our Signs PowerPoint Templates because Our PowerPoint Templates and Slides are truly out of this world. Even the MIB duo has been keeping tabs on our team. Present our Metaphors-Visual Concepts PowerPoint Templates because Our PowerPoint Templates and Slides will bullet point your ideas. See them fall into place one by one.Use these PowerPoint slides for presentations relating to business, chart, circle, circular, diagram, economy, finance, framework, graph, isolated, percentage, pie chart, results, scheme, statistics, stats, strategy, success. The prominent colors used in the PowerPoint template are Red, Pink, Green.

Pitch Deck For Raising Capital For Inorganic Growth Company Shareholder Structure With Percentages Rules PDF
This slide shows companys Shareholder structure with shareholder names and their respective percentages. Deliver and pitch your topic in the best possible manner with this pitch deck for raising capital for inorganic growth company shareholder structure with percentages rules pdf. Use them to share invaluable insights on company shareholder structure with percentages and impress your audience. This template can be altered and modified as per your expectations. So, grab it now.
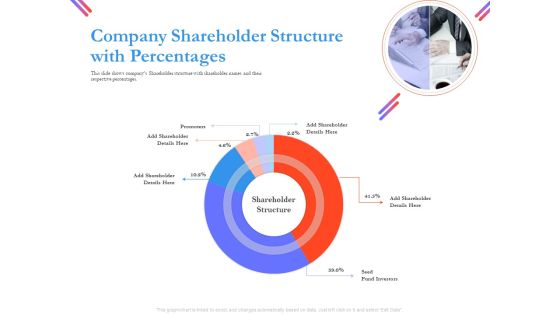
Pitch Deck For Fund Raising From Series C Funding Company Shareholder Structure With Percentages Ideas PDF
This slide shows companys Shareholder structure with shareholder names and their respective percentages. Deliver and pitch your topic in the best possible manner with this pitch deck for fund raising from series c funding company shareholder structure with percentages ideas pdf. Use them to share invaluable insights on company shareholder structure with percentages and impress your audience. This template can be altered and modified as per your expectations. So, grab it now.

Pitch Presentation Raising Series C Funds Investment Company Shareholder Structure With Percentages Introduction PDF
This slide shows companys Shareholder structure with shareholder names and their respective percentages. Deliver and pitch your topic in the best possible manner with this pitch presentation raising series c funds investment company shareholder structure with percentages introduction pdf. Use them to share invaluable insights on company shareholder structure with percentages and impress your audience. This template can be altered and modified as per your expectations. So, grab it now.

Pitch Deck For Fundraising From Angel Investors Company Shareholder Structure With Percentages Formats PDF
This slide shows companys Shareholder structure with shareholder names and their respective percentages. Deliver and pitch your topic in the best possible manner with this pitch deck for fundraising from angel investors company shareholder structure with percentages formats pdf. Use them to share invaluable insights on angel investors, micro venture capitalist, company shareholder structure with percentages and impress your audience. This template can be altered and modified as per your expectations. So, grab it now.
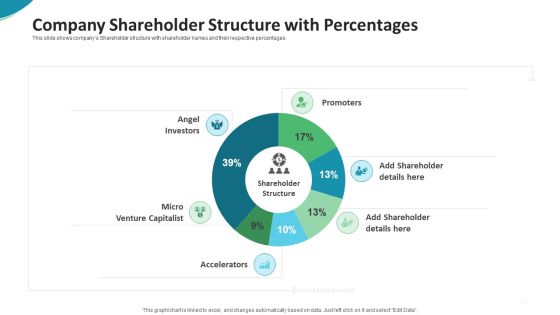
Investor Pitch Deck For Seed Funding From Private Investor Company Shareholder Structure With Percentages Pictures PDF
This slide shows companys Shareholder structure with shareholder names and their respective percentages.Deliver an awe-inspiring pitch with this creative investor pitch deck for seed funding from private investor company shareholder structure with percentages pictures pdf. bundle. Topics like company shareholder structure with percentages can be discussed with this completely editable template. It is available for immediate download depending on the needs and requirements of the user.

Company Shareholder Structure With Percentages Investor Pitch Deck For PE Funding Designs PDF
This slide shows companys Shareholder structure with shareholder names and their respective percentages. Deliver an awe inspiring pitch with this creative company shareholder structure with percentages investor pitch deck for pe funding designs pdf bundle. Topics like company shareholder structure with percentages can be discussed with this completely editable template. It is available for immediate download depending on the needs and requirements of the user.

Assessing Startup Funding Channels Shareholder Structure Of The Company With Percentages Formats PDF
This slide shows companys Shareholder structure with shareholder names and their respective percentages. Formulating a presentation can take up a lot of effort and time, so the content and message should always be the primary focus. The visuals of the PowerPoint can enhance the presenters message, so our Assessing Startup Funding Channels Shareholder Structure Of The Company With Percentages Formats PDF was created to help save time. Instead of worrying about the design, the presenter can concentrate on the message while our designers work on creating the ideal templates for whatever situation is needed. Slidegeeks has experts for everything from amazing designs to valuable content, we have put everything into Assessing Startup Funding Channels Shareholder Structure Of The Company With Percentages Formats PDF.

Shareholder Structure Of The Company With Percentages Ppt Pictures Slide Portrait PDF
This slide shows companys Shareholder structure with shareholder names and their respective percentages. This Shareholder Structure Of The Company With Percentages Ppt Pictures Slide Portrait PDF is perfect for any presentation, be it in front of clients or colleagues. It is a versatile and stylish solution for organizing your meetings. The product features a modern design for your presentation meetings. The adjustable and customizable slides provide unlimited possibilities for acing up your presentation. Slidegeeks has done all the homework before launching the product for you. So, do not wait, grab the presentation templates today
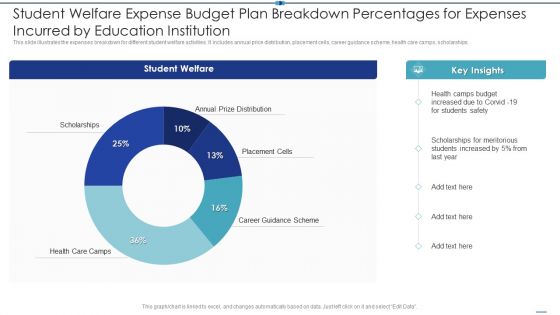
Student Welfare Expense Budget Plan Breakdown Percentages For Expenses Incurred By Education Institution Demonstration PDF
This slide illustrates the expenses breakdown for different student welfare activities. It includes annual price distribution, placement cells, career guidance scheme, health care camps, scholarships.Showcasing this set of slides titled Student Welfare Expense Budget Plan Breakdown Percentages For Expenses Incurred By Education Institution Demonstration PDF The topics addressed in these templates are Scholarships For Meritorious, Students Increased, Student Welfare All the content presented in this PPT design is completely editable. Download it and make adjustments in color, background, font etc. as per your unique business setting.

Bar Chart Ppt PowerPoint Presentation Model Sample
This is a bar chart ppt powerpoint presentation model sample. This is a two stage process. The stages in this process are sales in percentage, business, marketing, graph, percentage, year.

Line Chart Ppt PowerPoint Presentation Professional Ideas
This is a line chart ppt powerpoint presentation professional ideas. This is a two stage process. The stages in this process are in percentage, product, business, marketing, finance, percentage.

Area Chart Ppt PowerPoint Presentation Summary Information
This is a area chart ppt powerpoint presentation summary information. This is a two stage process. The stages in this process are business, sales in percentage, percentage, marketing, graph.

Area Chart Ppt PowerPoint Presentation Pictures Vector
This is a area chart ppt powerpoint presentation pictures vector. This is a two stage process. The stages in this process are sales in percentage, business, marketing, graph, percentage.
Scatter Chart Ppt PowerPoint Presentation Icon Mockup
This is a scatter chart ppt powerpoint presentation icon mockup. This is a nine stage process. The stages in this process are product, in percentage, dollars, percentage, finance.

Scatter Chart Ppt PowerPoint Presentation Gallery Vector
This is a scatter chart ppt powerpoint presentation gallery vector. This is a nine stage process. The stages in this process are in percentage, dollars, product, percentage, finance.

Bar Chart Ppt PowerPoint Presentation Ideas
This is a bar chart ppt powerpoint presentation ideas. This is a nine stage process. The stages in this process are graph, in percentage, growth, business, marketing.

Bar Chart Ppt PowerPoint Presentation Styles
This is a bar chart ppt powerpoint presentation styles. This is a nine stage process. The stages in this process are business, management, sales in percentage, growth.

Column Chart Ppt PowerPoint Presentation Professional Template
This is a column chart ppt powerpoint presentation professional template. This is a two stage process. The stages in this process are product, percentage, finance, bar graph, growth.

Area Chart Ppt PowerPoint Presentation Icon Gallery
This is a area chart ppt powerpoint presentation icon gallery. This is a two stage process. The stages in this process are sales in percentage, product, bar graph.
Line Chart Ppt PowerPoint Presentation Icon Inspiration
This is a line chart ppt powerpoint presentation icon inspiration. This is a two stage process. The stages in this process are product, financial years, sales in percentage.

Combo Chart Ppt PowerPoint Presentation Information
This is a combo chart ppt powerpoint presentation information. This is a four stage process. The stages in this process are growth, product, in percentage.

Scatter Chart Ppt PowerPoint Presentation Gallery Guide
This is a scatter chart ppt powerpoint presentation gallery guide. This is a one stage process. The stages in this process are profit, product, in percentage, growth, success.

Scatter Chart Ppt PowerPoint Presentation Ideas Professional
This is a scatter chart ppt powerpoint presentation ideas professional. This is a one stage process. The stages in this process are product, percentage, growth, success, line graph.

Line Chart Ppt PowerPoint Presentation Ideas
This is a line chart ppt powerpoint presentation ideas. This is a two stage process. The stages in this process are marketing, in percentage, sun, mon, tue, wed.

Scatter Chart Ppt PowerPoint Presentation Outline
This is a scatter chart ppt powerpoint presentation outline. This is a five stage process. The stages in this process are business, marketing, graph, percentage, finance.
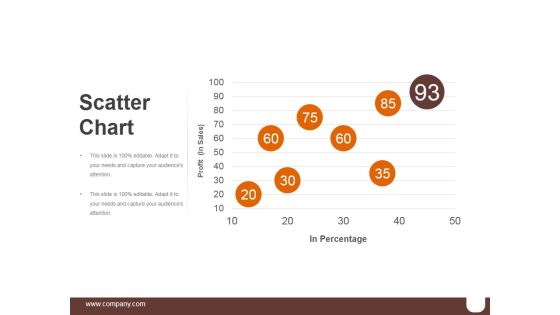
Scatter Chart Ppt PowerPoint Presentation Graphics
This is a scatter chart ppt powerpoint presentation graphics. This is a five stage process. The stages in this process are business, marketing, percentage, success, finance.

Column Chart Ppt PowerPoint Presentation Professional Aids
This is a column chart ppt powerpoint presentation professional aids. This is a two stage process. The stages in this process are product, sales in percentage, financial years.

Column Chart Ppt PowerPoint Presentation Gallery Layout
This is a column chart ppt powerpoint presentation gallery layout. This is a two stage process. The stages in this process are product, sales in percentage, year.
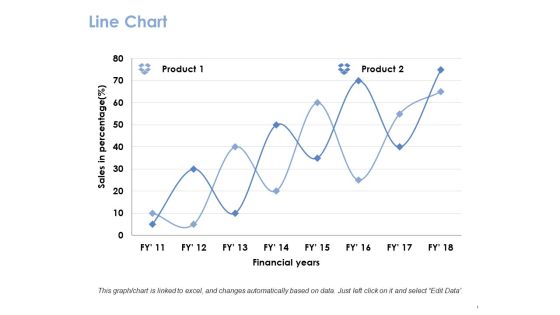
Line Chart Ppt PowerPoint Presentation Gallery Guide
This is a line chart ppt powerpoint presentation gallery guide. This is a two stage process. The stages in this process are product, financial years, sales in percentage.

Scatter Chart Ppt PowerPoint Presentation Show Sample
This is a scatter chart ppt powerpoint presentation show sample. This is a one stage process. The stages in this process are product, dollar, in percentage.

Area Chart Ppt PowerPoint Presentation Styles Brochure
This is a area chart ppt powerpoint presentation styles brochure. This is a two stage process. The stages in this process are product, financial years, in percentage.

Area Chart Ppt PowerPoint Presentation Show Graphics
This is a area chart ppt powerpoint presentation show graphics. This is a three stage process. The stages in this process are percentage, product, marketing, management, business.

Combo Chart Ppt PowerPoint Presentation Slides Slideshow
This is a combo chart ppt powerpoint presentation slides slideshow. This is a three stage process. The stages in this process are percentage, product, marketing, management, business.

Column Chart Ppt PowerPoint Presentation Show Objects
This is a column chart ppt powerpoint presentation show objects. This is a two stage process. The stages in this process are percentage, product, business, management, marketing.

Column Chart Ppt PowerPoint Presentation Model Slideshow
This is a column chart ppt powerpoint presentation model slideshow. This is a two stage process. The stages in this process are percentage, product, business, marketing.

Combo Chart Ppt PowerPoint Presentation Styles Topics
This is a combo chart ppt powerpoint presentation styles topics. This is a three stage process. The stages in this process are percentage, product, business, management, marketing.

Column Chart Financial Ppt PowerPoint Presentation Information
This is a column chart financial ppt powerpoint presentation information. This is a three stage process. The stages in this process are business, management, marketing, percentage, product.

Column Chart Ppt PowerPoint Presentation Slides Clipart
This is a column chart ppt powerpoint presentation slides clipart. This is a two stage process. The stages in this process are business, management, marketing, percentage, product.

Bar Chart Ppt PowerPoint Presentation Pictures Inspiration
This is a bar chart ppt powerpoint presentation pictures inspiration. This is a seven stage process. The stages in this process are in percentage, business, marketing, finance, graph.

Bar Chart Ppt PowerPoint Presentation Professional Examples
This is a bar chart ppt powerpoint presentation professional examples. This is a four stage process. The stages in this process are percentage, marketing, management, product.

Bar Chart Ppt PowerPoint Presentation Show Deck
This is a bar chart ppt powerpoint presentation show deck. This is a two stage process. The stages in this process are percentage, product, business, marketing.

Area Chart Ppt Powerpoint Presentation Ideas Templates
This is a area chart ppt powerpoint presentation ideas templates. This is a two stage process. The stages in this process are product, financial year, in percentage, graph.
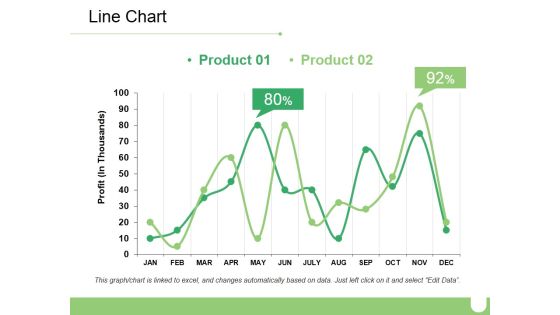
Line Chart Ppt PowerPoint Presentation Ideas Diagrams
This is a line chart ppt powerpoint presentation ideas diagrams. This is a two stage process. The stages in this process are business, marketing, percentage, financial, profit.
Pie Chart Ppt PowerPoint Presentation Outline Icon
This is a pie chart ppt powerpoint presentation outline icon. This is a four stage process. The stages in this process are pie, process, percentage, finance, business.
Pie Chart Ppt PowerPoint Presentation Icon Outline
This is a pie chart ppt powerpoint presentation icon outline. This is a four stage process. The stages in this process are pie, process, percentage, product, business.

Area Chart Ppt PowerPoint Presentation Icon Smartart
This is a area chart ppt powerpoint presentation icon smartart. This is a two stage process. The stages in this process are percentage, product, business, marketing.

Area Chart Ppt PowerPoint Presentation Show
This is a area chart ppt powerpoint presentation show. This is a two stage process. The stages in this process are sales in percentage, business, marketing, analysis, success.

Pie Chart Ppt PowerPoint Presentation Visual Aids
This is a pie chart ppt powerpoint presentation visual aids. This is a five stage process. The stages in this process are pie, finance, analysis, division, percentage.

Pie Chart Ppt PowerPoint Presentation Deck
This is a pie chart ppt powerpoint presentation deck. This is a five stage process. The stages in this process are business, pie, finance, percentage, product.

Pie Chart Ppt PowerPoint Presentation Layouts Topics
This is a pie chart ppt powerpoint presentation layouts topics. This is a three stage process. The stages in this process are pie, process, percentage, finance, business.
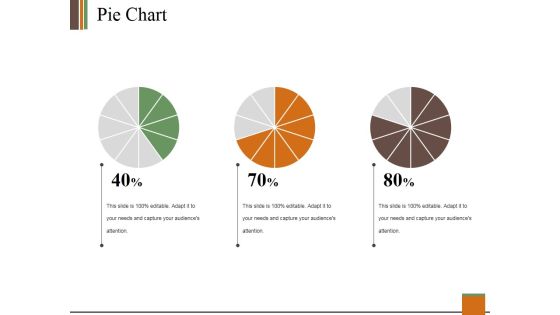
Pie Chart Ppt PowerPoint Presentation Summary Infographics
This is a pie chart ppt powerpoint presentation summary infographics. This is a three stage process. The stages in this process are pie, process, percentage, finance, business.
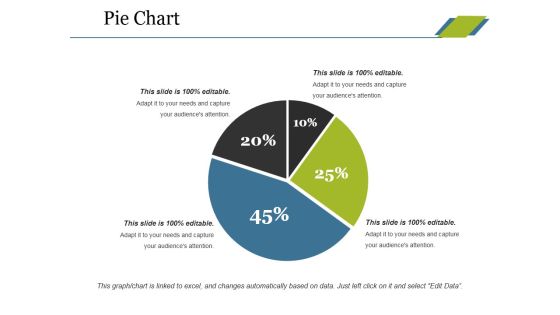
Pie Chart Ppt PowerPoint Presentation Layouts Gridlines
This is a pie chart ppt powerpoint presentation layouts gridlines. This is a four stage process. The stages in this process are pie, process, percentage, finance, business.

Area Chart Ppt PowerPoint Presentation Ideas Tips
This is a area chart ppt powerpoint presentation ideas tips. This is a two stage process. The stages in this process are in percentage, financial, year, business, marketing.
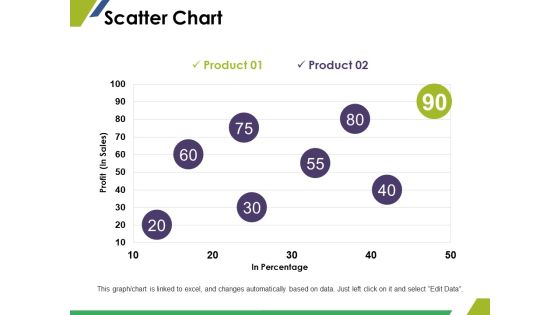
Scatter Chart Ppt PowerPoint Presentation Styles Images
This is a scatter chart ppt powerpoint presentation styles images. This is a two stage process. The stages in this process are in percentage, profit, finance, marketing, business.
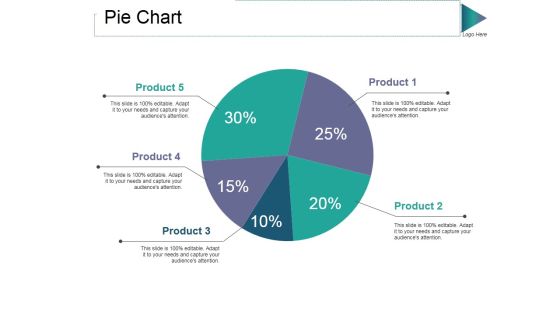
Pie Chart Ppt PowerPoint Presentation Model Grid
This is a pie chart ppt powerpoint presentation model grid. This is a five stage process. The stages in this process are product, pie, process, percentage, finance.
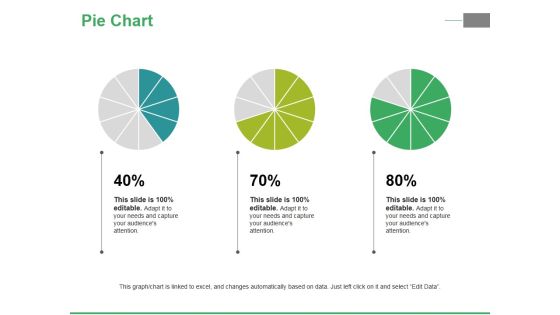
Pie Chart Ppt PowerPoint Presentation Ideas Inspiration
This is a pie chart ppt powerpoint presentation ideas inspiration. This is a three stage process. The stages in this process are pie, process, percentage, finance, business.
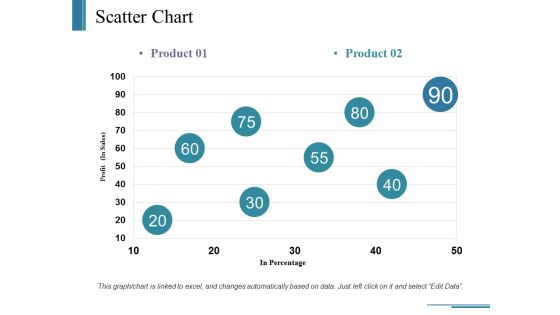
Scatter Chart Ppt PowerPoint Presentation Ideas Example
This is a scatter chart ppt powerpoint presentation ideas example. This is a two stage process. The stages in this process are business, in percentage, profit, marketing, graph.
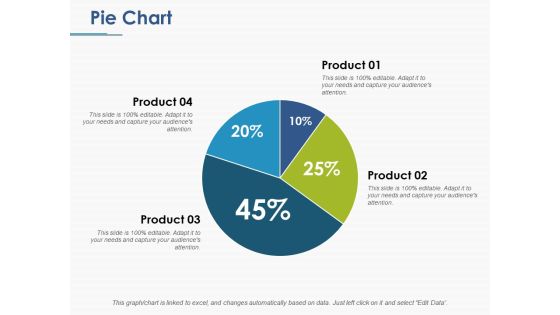
Pie Chart Ppt PowerPoint Presentation File Background
This is a pie chart ppt powerpoint presentation file background. This is a four stage process. The stages in this process are pie, process, percentage, finance, business.

Pie Chart Ppt PowerPoint Presentation Ideas Deck
This is a pie chart ppt powerpoint presentation ideas deck. This is a four stage process. The stages in this process are pie, process, percentage, finance, business.

Area Chart Ppt PowerPoint Presentation Summary Backgrounds
This is a area chart ppt powerpoint presentation summary backgrounds. This is a two stage process. The stages in this process are percentage, financial, business, management.

Area Chart Ppt PowerPoint Presentation Styles Ideas
This is a area chart ppt powerpoint presentation styles ideas. This is a three stage process. The stages in this process are percentage, product, business.

Bubble Chart Ppt PowerPoint Presentation Background Designs
This is a bubble chart ppt powerpoint presentation background designs. This is a two stage process. The stages in this process are product, percentage, marketing, business.

Column Chart Ppt PowerPoint Presentation Pictures Aids
This is a column chart ppt powerpoint presentation pictures aids. This is a two stage process. The stages in this process are Percentage, Product, Marketing, Management.

Bubble Chart Ppt PowerPoint Presentation Ideas Images
This is a bubble chart ppt powerpoint presentation ideas images. This is a three stage process. The stages in this process are percentage, product, marketing, business.

Bar Chart Ppt PowerPoint Presentation Microsoft
This is a bar chart ppt powerpoint presentation microsoft. This is a eleven stage process. The stages in this process are sales in percentage, fy, graph, success, business.

Scatter Chart Ppt PowerPoint Presentation Styles Show
This is a scatter chart ppt powerpoint presentation styles show. This is a nine stage process. The stages in this process are dollars, in percentage, finance, growth strategy.

Staked Line Chart Ppt PowerPoint Presentation Topics
This is a staked line chart ppt powerpoint presentation topics. This is a two stage process. The stages in this process are in percentage, product.

Area Chart Ppt PowerPoint Presentation Professional
This is a area chart ppt powerpoint presentation professional. This is a one stage process. The stages in this process are product, in percentage, jan, feb, mar, apr.

Area Chart Ppt PowerPoint Presentation Samples
This is a area chart ppt powerpoint presentation samples. This is a two stage process. The stages in this process are financial year, sales in percentage, jan, feb.

Area Chart Ppt PowerPoint Presentation Picture
This is a area chart ppt powerpoint presentation picture. This is a two stage process. The stages in this process are product, in percentage, graph, management, business.
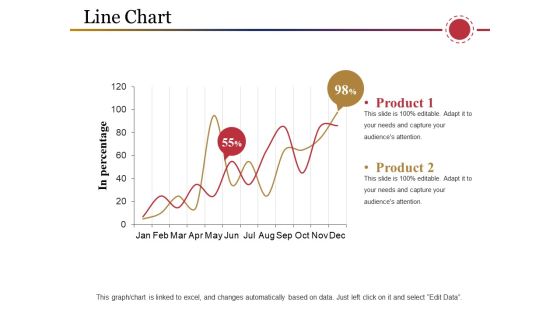
Line Chart Ppt PowerPoint Presentation Inspiration Samples
This is a line chart ppt powerpoint presentation inspiration samples. This is a two stage process. The stages in this process are product, in percentage, business, marketing, graph.
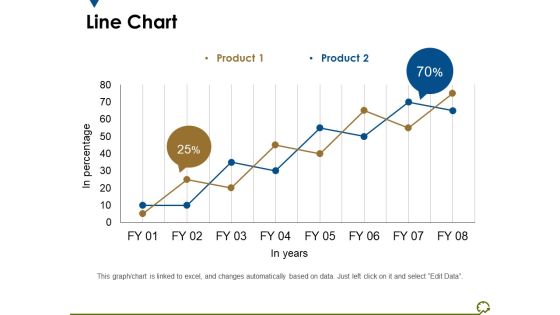
Line Chart Ppt PowerPoint Presentation Outline Diagrams
This is a line chart ppt powerpoint presentation outline diagrams. This is a two stage process. The stages in this process are in percentage, in years, percentage, business, marketing.
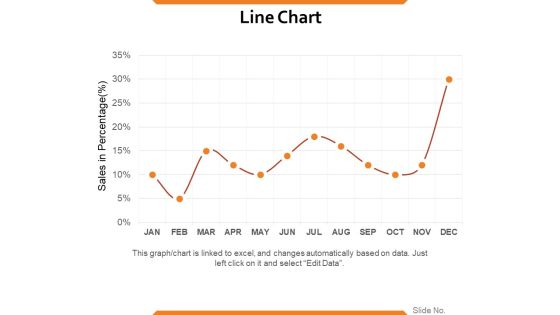
Line Chart Ppt PowerPoint Presentation Summary Samples
This is a line chart ppt powerpoint presentation summary samples. This is a one stage process. The stages in this process are sales in percentage, percentage, business, marketing, strategy.

Bar Chart Ppt PowerPoint Presentation Icon Information
This is a bar chart ppt powerpoint presentation icon information. This is a one stage process. The stages in this process are product, sales in percentage, financial years, bar graph, growth.

Bar Chart Ppt PowerPoint Presentation Diagram Lists
This is a bar chart ppt powerpoint presentation diagram lists. This is a two stage process. The stages in this process are business, marketing, financial years, sales in percentage, graph.

Line Chart Ppt PowerPoint Presentation Styles Themes
This is a line chart ppt powerpoint presentation styles themes. This is a two stage process. The stages in this process are business, marketing, financial years, sales in percentage.

Line Chart Ppt PowerPoint Presentation Pictures Templates
This is a line chart ppt powerpoint presentation pictures templates. This is a two stage process. The stages in this process are sales in percentage, financial years, business, marketing, growth.

Column Chart Ppt PowerPoint Presentation Layouts Tips
This is a column chart ppt powerpoint presentation layouts tips. This is a six stage process. The stages in this process are sales in percentage, financial year, bar graph, growth, success.
Scatter Chart Ppt PowerPoint Presentation Professional Icons
This is a scatter chart ppt powerpoint presentation professional icons. This is a six stage process. The stages in this process are in dollars, in percentage, graph, business, marketing.

Bar Chart Ppt PowerPoint Presentation Summary Themes
This is a bar chart ppt powerpoint presentation summary themes. This is a three stage process. The stages in this process are financial years, sales in percentage, business, marketing, graph.

Bar Chart Ppt PowerPoint Presentation Portfolio Diagrams
This is a bar chart ppt powerpoint presentation portfolio diagrams. This is a three stage process. The stages in this process are sales in percentage, business, marketing, graph, finance.
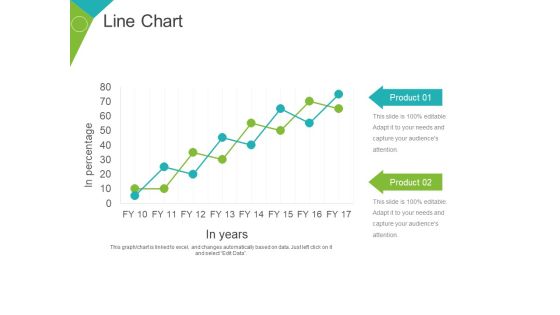
Line Chart Ppt PowerPoint Presentation Gallery Objects
This is a line chart ppt powerpoint presentation gallery objects. This is a two stage process. The stages in this process are product, business, marketing, growth, in years, in percentage.

Scatter Chart Ppt PowerPoint Presentation Slides Summary
This is a scatter chart ppt powerpoint presentation slides summary. This is a nine stage process. The stages in this process are sales in percentage, growth, graph, business, marketing.

Column Chart Ppt PowerPoint Presentation Slides Smartart
This is a column chart ppt powerpoint presentation slides smartart. This is a two stage process. The stages in this process are sales in percentage, financial year in, business, growth, strategy.
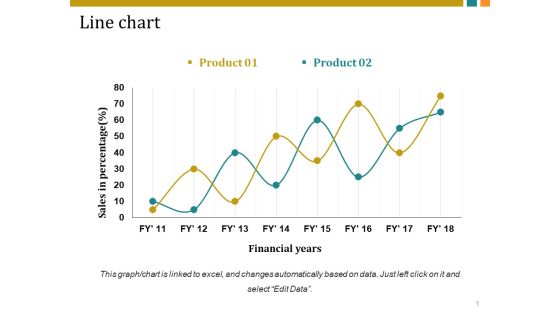
Line Chart Ppt PowerPoint Presentation Inspiration Vector
This is a line chart ppt powerpoint presentation inspiration vector. This is a two stage process. The stages in this process are sales in percentage, financial years, business, marketing, growth.

Area Chart Ppt PowerPoint Presentation Topics
This is a area chart ppt powerpoint presentation topics. This is a two stage process. The stages in this process are product, in percentage, jan, feb, mar, apr, may.

Column Chart Ppt PowerPoint Presentation Show
This is a column chart ppt powerpoint presentation show. This is a six stage process. The stages in this process are product, in percentage, jan, feb, mar, apr, may.

Combo Chart Ppt PowerPoint Presentation Infographics Introduction
This is a combo chart ppt powerpoint presentation infographics introduction. This is a three stage process. The stages in this process are profit in percentage, business, graph, strategy, product.

Combo Chart Ppt PowerPoint Presentation Summary Layouts
This is a combo chart ppt powerpoint presentation summary layouts. This is a eight stage process. The stages in this process are product, sales in percentage, in years, in price, graph.

Column Chart Ppt PowerPoint Presentation Outline Styles
This is a column chart ppt powerpoint presentation outline styles. This is a two stage process. The stages in this process are sales in percentage, financial year in, business, marketing, graph.

Bar Chart Ppt PowerPoint Presentation Layouts Template
This is a bar chart ppt powerpoint presentation layouts template. This is a two stage process. The stages in this process are financial year, sales in percentage, business, marketing, finance.

Bar Chart Ppt PowerPoint Presentation Icon Introduction
This is a bar chart ppt powerpoint presentation icon introduction. This is a seven stage process. The stages in this process are in years, in percentage, business, marketing, graph.
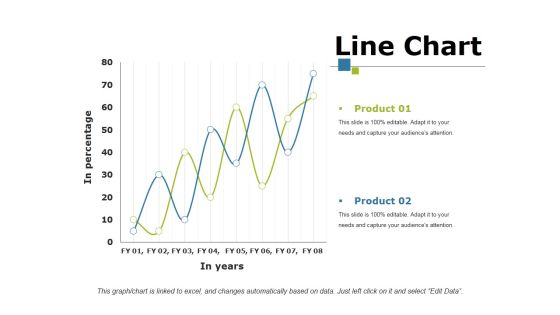
Line Chart Ppt PowerPoint Presentation Portfolio Mockup
This is a line chart ppt powerpoint presentation portfolio mockup. This is a two stage process. The stages in this process are product, in percentage, in year, growth, success.

Column Chart Ppt PowerPoint Presentation Gallery Background
This is a column chart ppt powerpoint presentation gallery background. This is a two stage process. The stages in this process are product, sales in percentage, financial year, graph, success.

Bar Chart Ppt PowerPoint Presentation Layouts Pictures
This is a bar chart ppt powerpoint presentation layouts pictures. This is a three stage process. The stages in this process are bar graph, product, sales in percentage, business, marketing.

Bar Chart Ppt PowerPoint Presentation Outline Introduction
This is a bar chart ppt powerpoint presentation outline introduction. This is a one stage process. The stages in this process are sales in percentage, product, business, financial years, graph.

Bar Chart Ppt PowerPoint Presentation Styles Outfit
This is a bar chart ppt powerpoint presentation styles outfit. This is a Seven stage process. The stages in this process are sales in percentage, financial years, graph, business.

Area Chart Ppt PowerPoint Presentation Show Templates
This is a area chart ppt powerpoint presentation show templates. This is a two stage process. The stages in this process are product, in percentage, in years, finance, graph.

Column Chart Ppt PowerPoint Presentation Icon Guide
This is a column chart ppt powerpoint presentation icon guide. This is a two stage process. The stages in this process are business, year, sales in percentage, marketing, graph.

Area Chart Ppt PowerPoint Presentation Icon Aids
This is a area chart ppt powerpoint presentation icon aids. This is a three stage process. The stages in this process are financial years, sales in percentage, business, marketing, graph.

Area Chart Ppt Powerpoint Presentation File Show
This is a area chart ppt powerpoint presentation file show. This is a two stage process. The stages in this process are sales in percentage, financial year, product, financial, business.

Area Chart Ppt PowerPoint Presentation Slides Rules
This is a area chart ppt powerpoint presentation slides rules. This is a two stage process. The stages in this process are sales in percentage, business, marketing, product, finance.

Area Chart Ppt PowerPoint Presentation Summary Objects
This is a area chart ppt powerpoint presentation summary objects. This is a two stage process. The stages in this process are product, sales in percentage, finance, business, marketing.

Area Chart Ppt PowerPoint Presentation Layouts Maker
This is a area chart ppt powerpoint presentation layouts maker. This is a two stage process. The stages in this process are financial year, sales in percentage, graph, business, marketing.
Scatter Chart Ppt PowerPoint Presentation Slides Examples
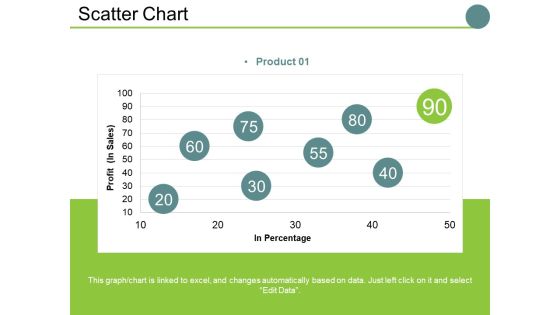
This is a scatter chart ppt powerpoint presentation slides examples. This is a one stage process. The stages in this process are profit , in percentage, business, marketing, finance, graph.

Area Chart Ppt PowerPoint Presentation Professional Brochure
This is a area chart ppt powerpoint presentation professional brochure. This is a two stage process. The stages in this process are sales in percentage, business, marketing, finance, graph.

Area Chart Ppt PowerPoint Presentation Summary Show
This is a area chart ppt powerpoint presentation summary show. This is a two stage process. The stages in this process are sales in percentage, financial year, business, marketing, finance.

area chart ppt powerpoint presentation professional elements
This is a area chart ppt powerpoint presentation professional elements. This is a two stage process. The stages in this process are financial year sales in percentage, business, marketing, graph.

Area Chart Ppt PowerPoint Presentation File Visuals
This is a area chart ppt powerpoint presentation file visuals. This is a two stage process. The stages in this process are business, sales in percentage, marketing, graph, strategy, finance.

Line Chart Ppt PowerPoint Presentation Professional Portfolio
This is a line chart ppt powerpoint presentation professional portfolio. This is a two stage process. The stages in this process are business, marketing, profit, percentage, graph, strategy, finance.

Line Chart Ppt PowerPoint Presentation Outline Ideas
This is a line chart ppt powerpoint presentation outline ideas. This is a two stage process. The stages in this process are business, marketing, financial years, sales in percentage, strategy.

Column Chart Ppt PowerPoint Presentation Show Structure
This is a column chart ppt powerpoint presentation show structure. This is a two stage process. The stages in this process are business, financial year in, sales in percentage, marketing, graph.

Area Chart Ppt PowerPoint Presentation Model Demonstration
This is a area chart ppt powerpoint presentation model demonstration. This is a two stage process. The stages in this process are business, marketing, financial year, in percentage, graph.

Area Chart Ppt PowerPoint Presentation Summary Templates
This is a area chart ppt powerpoint presentation summary templates. This is a two stage process. The stages in this process are product, in percentage, bar graph, growth, business.

Line Chart Ppt PowerPoint Presentation Ideas Example
This is a line chart ppt powerpoint presentation ideas example. This is a two stage process. The stages in this process are sales in percentage, bar graph, business, marketing, growth.
