Percentage Bar

Clustered Column Ppt PowerPoint Presentation Gallery Structure
This is a clustered column ppt powerpoint presentation gallery structure. This is a two stage process. The stages in this process are product, sales in percentage, financial year, bar graph, finance.

Stacked Area Clustered Column Ppt PowerPoint Presentation Summary Slides
This is a stacked area clustered column ppt powerpoint presentation summary slides. This is a three stage process. The stages in this process are product, in percentage, financial year, bar graph.

Business Diagram Diagram For Visual Data Display Presentation Template
Four colored cylindrical bars with percentage values are used to design this power point template. This diagram slide helps to display financial data analysis. Use this diagram for your business and finance related presentations.
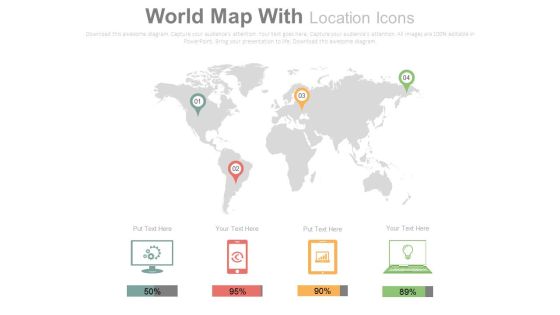
Electronic Devices Global Market Reports PowerPoint Slides
The fight between various gadget manufacturers, internet service providers and operating systems is no longer limited to any specific country. It has gone global and this slide can help present relevant data in a very modern and easy to understand and remember manner. This template has been created by our experienced designers keeping in mind the regular reporting and the data that is to be maintained regarding the number of users and their patterns by various technology companies. The slide has icons of a desktop, a smartphone, a tablet and a laptop accompanied with percentage bars. These can be effectively used to mark the percentage of users on each device, users accessing a website or an app on each device or the sales figures. The location pins can be used to mark the location with maximum number of users or the maximum sales from a location.

Column Chart Ppt PowerPoint Presentation Infographics Model
This is a column chart ppt powerpoint presentation infographics model. This is a two stage process. The stages in this process are bar graph, growth, product, percentage, year.
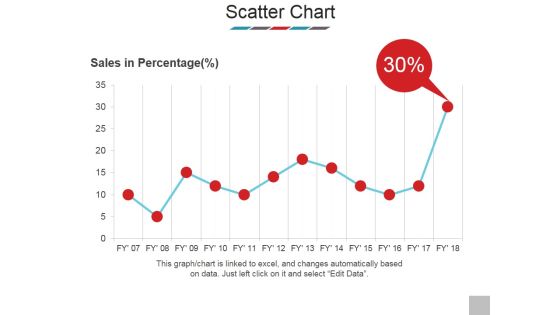
Scatter Chart Ppt PowerPoint Presentation Model Show
This is a scatter chart ppt powerpoint presentation model show. This is a one stage process. The stages in this process are sales in percentage, scatter chart, business, bar graph, marketing.

Column Chart Ppt PowerPoint Presentation Gallery Slide Portrait
This is a column chart ppt powerpoint presentation gallery slide portrait. This is a two stage process. The stages in this process are sales in percentage, financial year, product, bar graph, growth.

Column Chart Ppt PowerPoint Presentation Layouts Vector
This is a column chart ppt powerpoint presentation layouts vector. This is a two stage process. The stages in this process are product, column chart, bar graph, percentage, finance.

Clustered Column Line Ppt PowerPoint Presentation Model Images
This is a clustered column line ppt powerpoint presentation model images. This is a four stage process. The stages in this process are sales in percentage, product, business, marketing, bar graph.

Clustered Column Template 2 Ppt PowerPoint Presentation Summary Smartart
This is a clustered column template 2 ppt powerpoint presentation summary smartart. This is a two stage process. The stages in this process are product, bar graph, in percentage, clustered column, growth.

Adjusted Roce Template 2 Ppt PowerPoint Presentation Icon Pictures
This is a adjusted roce template 2 ppt powerpoint presentation icon pictures. This is a five stage process. The stages in this process are bar graph, finance, percentage, business, marketing.
Product Launch Budget Plan Ppt PowerPoint Presentation Icon Slide
This is a product launch budget plan ppt powerpoint presentation icon slide. This is a seven stage process. The stages in this process are bar graph, icons, percentage, finance, business.

Stacked Area Clustered Column Ppt PowerPoint Presentation Gallery Gridlines
This is a stacked area clustered column ppt powerpoint presentation gallery gridlines. This is a three stage process. The stages in this process are bar graph, product, in percentage.
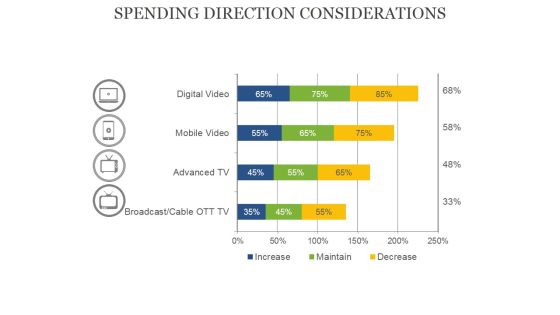
Spending Direction Considerations Ppt PowerPoint Presentation Portfolio Graphics Template
This is a spending direction considerations ppt powerpoint presentation portfolio graphics template. This is a four stage process. The stages in this process are bar graph, business, presentation, percentage, finance.

Stacked Area Clustered Column Ppt PowerPoint Presentation Summary Professional
This is a stacked area clustered column ppt powerpoint presentation summary professional. This is a three stage process. The stages in this process are product, bar graph, growth, success, in percentage.

Column Chart Ppt PowerPoint Presentation Slides Visual Aids
This is a column chart ppt powerpoint presentation slides visual aids. This is a six stage process. The stages in this process are bar graph, growth, success, sales in percentage, financial year.

Product Roadmap Layout 2 Ppt PowerPoint Presentation Portfolio File Formats
This is a product roadmap layout 2 ppt powerpoint presentation portfolio file formats. This is a eight stage process. The stages in this process are bar, finance, analysis, planning, percentage.

Clustered Column Line Ppt PowerPoint Presentation Slide
This is a clustered column line ppt powerpoint presentation slide. This is a three stage process. The stages in this process are bar graph, growth, finance, product, sales in percentage.

Growth Graph Moving Up PowerPoint Templates And PowerPoint Themes 1012
Growth Graph Moving Up PowerPoint Templates And PowerPoint Themes 1012-This PowerPoint Template shows the Bar Graph with increasing percentage which signifies the Financial Growth. The Template signifies the concept of Team Work, Team Leader etc. The structure of our templates allows you to effectively highlight the key issues concerning the growth of your business.-Growth Graph Moving Up PowerPoint Templates And PowerPoint Themes 1012-This PowerPoint template can be used for presentations relating to-Business graph with rising arrow, success, business, arrows, marketing, finance
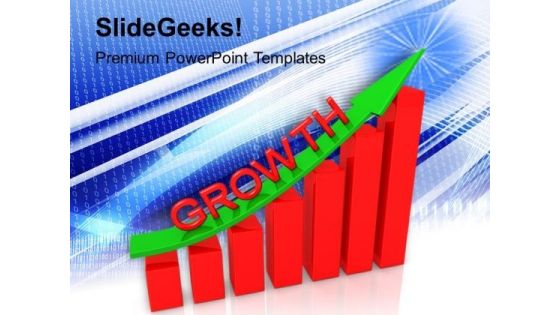
Business Graph Up PowerPoint Templates And PowerPoint Themes 1012
Business Graph Up PowerPoint Templates And PowerPoint Themes 1012-This PowerPoint Template shows the Bar Graph with increasing percentage which signifies the Financial Growth. The Template signifies the concept of Team Work, Team Leader etc. The structure of our templates allows you to effectively highlight the key issues concerning the growth of your business.-Business Graph Up PowerPoint Templates And PowerPoint Themes 1012-This PowerPoint template can be used for presentations relating to-Business graph, success, arrows, business, signs, shapes

Employees Weekly Task Output Status Summary Report Information PDF
This slide covers task completion output report sheet for a week. It includes task, assigned person, priority status and the task progress bar with percentage. Pitch your topic with ease and precision using this Employees Weekly Task Output Status Summary Report Information PDF. This layout presents information on Opening Meeting, Brainstorming Session, Media Engagement. It is also available for immediate download and adjustment. So, changes can be made in the color, design, graphics or any other component to create a unique layout.
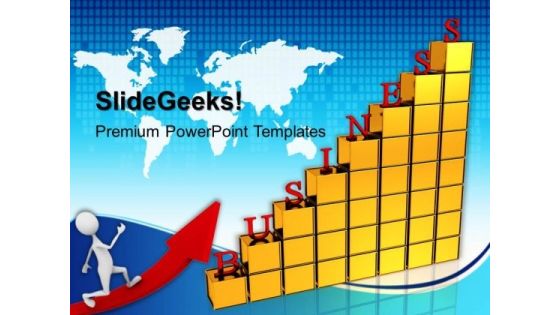
A Corporate Business Growth Graph PowerPoint Templates And PowerPoint Themes 1012
A Corporate Business Growth Graph PowerPoint Templates And PowerPoint Themes 1012-This PowerPoint Template shows the Bar Graph with increasing percentage which signifies the Financial or Business Growth. The Template signifies business concept. It signifies teamwork and team leader. Use this template for Global Business. The structure of our templates allows you to effectively highlight the key issues concerning the growth of your business.-A Corporate Business Growth Graph PowerPoint Templates And PowerPoint Themes 1012-This PowerPoint template can be used for presentations relating to-Business bar graph chart, technology, finance, arrows, business, success

Clustered Column Line Chart Ppt PowerPoint Presentation File Pictures
This is a clustered column line chart ppt powerpoint presentation file pictures. This is a four stage process. The stages in this process are clustered bar, product, planning, business, sales in percentage.

Achieved And Pending Workplace Diversity Objectives Chart Guidelines PDF
This slide displays the bar chart representing the percentage of diversity goals achieved. It also includes some key insights such as an increase in the women workforce in tech roles, increase in director level black representation, etc. Showcasing this set of slides titled Achieved And Pending Workplace Diversity Objectives Chart Guidelines PDF. The topics addressed in these templates are Achieved And Pending Workplace, Diversity Objectives Chart. All the content presented in this PPT design is completely editable. Download it and make adjustments in color, background, font etc. as per your unique business setting.
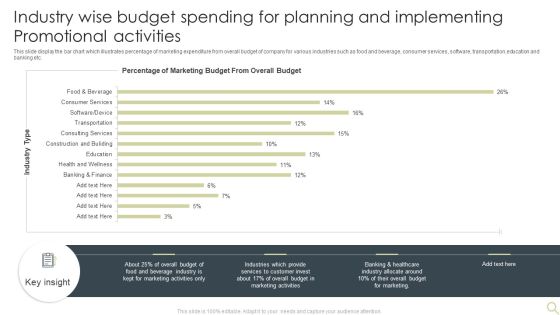
Industry Wise Budget Spending For Planning And Implementing Promotional Activities Introduction PDF
This slide display the bar chart which illustrates percentage of marketing expenditure from overall budget of company for various industries such as food and beverage, consumer services, software, transportation,education and banking etc. Showcasing this set of slides titled Industry Wise Budget Spending For Planning And Implementing Promotional Activities Introduction PDF. The topics addressed in these templates are Marketing, Beverage Industry, Budget. All the content presented in this PPT design is completely editable. Download it and make adjustments in color, background, font etc. as per your unique business setting.

Domestic Budget Plan Expenses Category Analysis Ppt PowerPoint Presentation Layouts Inspiration PDF
The slide shows a bar graph showing minimum and maximum percentage of spending in domestic financial management. It includes categories like food and non alcoholic, clothing and footwear, housing, water, electricity, domestic furnishing, health, transport, education, etc.Showcasing this set of slides titled Domestic Budget Plan Expenses Category Analysis Ppt PowerPoint Presentation Layouts Inspiration PDF. The topics addressed in these templates are Part Earnings, Electricity Consumptions, Least Spending. All the content presented in this PPT design is completely editable. Download it and make adjustments in color, background, font etc. as per your unique business setting.

Success Graph Finance PowerPoint Templates And PowerPoint Themes 1012
Success Graph Finance PowerPoint Templates And PowerPoint Themes 1012-The Above PowerPoint Template shows the Bar graph of Several Components showing the Percentage of each component. It signifies the Concept of Growth, Finance, Investment etc. Prove how they mesh to motivate the company team and provide the steam to activate the composite machine. You have noted down some very fruitful ideas that have occurred to you at random moments. Organize them all and prioritize them effectively.-Success Graph Finance PowerPoint Templates And PowerPoint Themes 1012-This PowerPoint template can be used for presentations relating to-Business growth, Business, Finance, Marketing, Success, Symbol
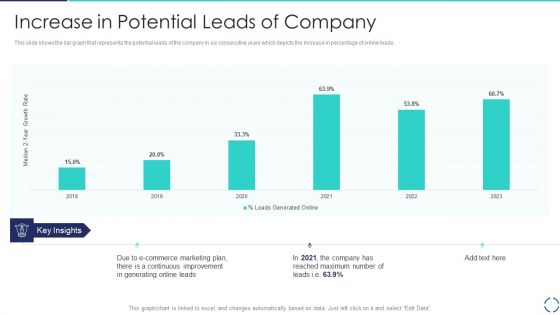
Optimizing E Business Promotion Plan Increase In Potential Leads Of Company Background PDF
This slide shows the bar graph that represents the potential leads of the company in six consecutive years which depicts the increase in percentage of online leads. Deliver an awe inspiring pitch with this creative Optimizing E Business Promotion Plan Increase In Potential Leads Of Company Background PDF bundle. Topics like Company, Increase Potential can be discussed with this completely editable template. It is available for immediate download depending on the needs and requirements of the user.
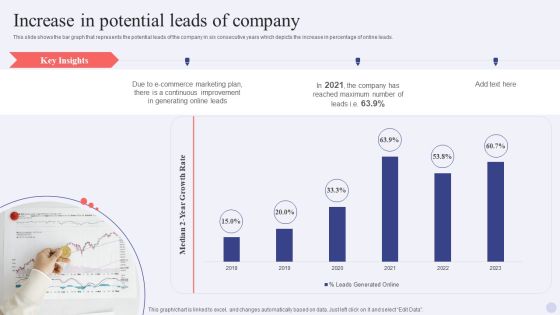
Electronic Commerce Systems Increase In Potential Leads Of Company Graphics PDF
This slide shows the bar graph that represents the potential leads of the company in six consecutive years which depicts the increase in percentage of online leads. Deliver an awe inspiring pitch with this creative Electronic Commerce Systems Increase In Potential Leads Of Company Graphics PDF bundle. Topics like E Commerce Marketing Plan, Generating Online Leads, Continuous Improvement can be discussed with this completely editable template. It is available for immediate download depending on the needs and requirements of the user.
Implementing Ecommerce Marketing Services Plan Increase In Potential Leads Of Company Elements PDF
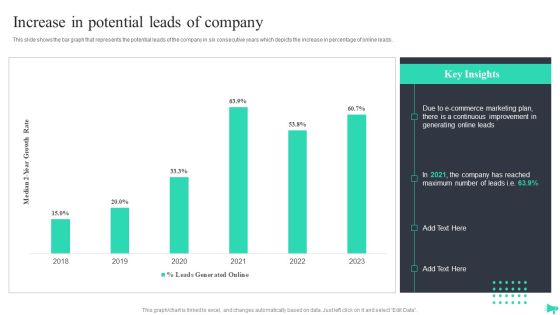
This slide shows the bar graph that represents the potential leads of the company in six consecutive years which depicts the increase in percentage of online leads. There are so many reasons you need a Implementing Ecommerce Marketing Services Plan Increase In Potential Leads Of Company Elements PDF. The first reason is you can not spend time making everything from scratch, Thus, Slidegeeks has made presentation templates for you too. You can easily download these templates from our website easily.
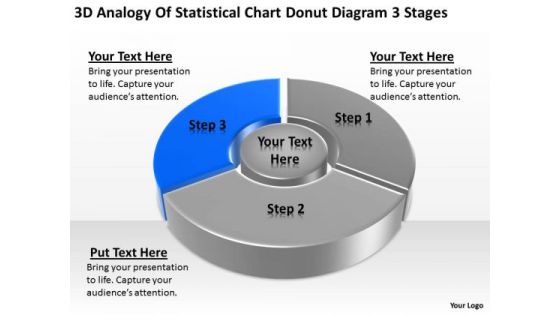
Statistical Chart Donut Diagram 3 Stages Ppt Samples Business Plan PowerPoint Slides
We present our statistical chart donut diagram 3 stages ppt samples business plan PowerPoint Slides.Download our Finance PowerPoint Templates because you should Experience excellence with our PowerPoint Templates and Slides. They will take your breath away. Present our Marketing PowerPoint Templates because our bewitching PowerPoint Templates and Slides will delight your audience with the magic of your words. Use our Sales PowerPoint Templates because You have gained great respect for your brilliant ideas. Use our PowerPoint Templates and Slides to strengthen and enhance your reputation. Download our Business PowerPoint Templates because You have a driving passion to excel in your field. Our PowerPoint Templates and Slides will prove ideal vehicles for your ideas. Download our Success PowerPoint Templates because You should Kick up a storm with our PowerPoint Templates and Slides. The heads of your listeners will swirl with your ideas.Use these PowerPoint slides for presentations relating to Chart, Business, Data, Donut, Market, Sales, Document, Economy, Display, Bar, Corporate, Income, Concept, Success, Presentation, Symbol, Diagram, Percentage, Graphic, Finance, Stock, Clean, Analysis, Report, Marketing, Accounting, Management, Graph, Colors, Forecast, Design, Growth, Competition, Progress, Profit, Information, Background, Trade, Investment, Statistic, Financial. The prominent colors used in the PowerPoint template are Blue, Gray, Black.
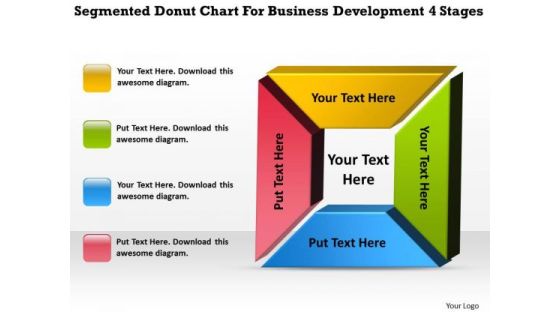
Donut Chart For Business Development 4 Stages Plan Excel PowerPoint Templates
We present our donut chart for business development 4 stages plan excel PowerPoint templates.Download our Finance PowerPoint Templates because Our PowerPoint Templates and Slides are created by a hardworking bunch of busybees. Always flitting around with solutions gauranteed to please. Present our Marketing PowerPoint Templates because Our PowerPoint Templates and Slides team portray an attitude of elegance. Personify this quality by using them regularly. Download and present our Shapes PowerPoint Templates because Our PowerPoint Templates and Slides are innately eco-friendly. Their high recall value negate the need for paper handouts. Download our Business PowerPoint Templates because It will mark the footprints of your journey. Illustrate how they will lead you to your desired destination. Download and present our Process and Flows PowerPoint Templates because Our PowerPoint Templates and Slides will provide you a launch platform. Give a lift off to your ideas and send them into orbit.Use these PowerPoint slides for presentations relating to chart, business, data, donut, market, sales, document, economy, display, bar, corporate, income, concept, success, presentation, symbol, diagram, percentage, graphic, finance, stock, clean, analysis, report, marketing, accounting, management, graph, forecast, design, growth, competition, progress, profit, information, background, trade, investment, statistic, financial, infographics, 3d. The prominent colors used in the PowerPoint template are Yellow, Green, Blue.

3d Circular 8 Stages Donut Model Business Plan PowerPoint Templates
We present our 3d circular 8 stages donut model business plan PowerPoint templates.Present our Ring Charts PowerPoint Templates because You canTake a leap off the starting blocks with our PowerPoint Templates and Slides. They will put you ahead of the competition in quick time. Download and present our Process and Flows PowerPoint Templates because Our PowerPoint Templates and Slides will effectively help you save your valuable time. They are readymade to fit into any presentation structure. Use our Flow Charts PowerPoint Templates because you should Whip up a frenzy with our PowerPoint Templates and Slides. They will fuel the excitement of your team. Use our Business PowerPoint Templates because You can Inspire your team with our PowerPoint Templates and Slides. Let the force of your ideas flow into their minds. Download and present our Shapes PowerPoint Templates because It can Bubble and burst with your ideas.Use these PowerPoint slides for presentations relating to Pie, isolated, bar, business, concept, sign, render, spectrum, bright, diagram, circle, percentage, light, graphic, element, digital, report,marketing, eight, graph, wheel, modern, creative, illustration, icon, chart, colour, up, web, design, color, colorful, painting, set, art, progress, effect, style,part, background, image, rainbow, pattern, financial. The prominent colors used in the PowerPoint template are Pink, Purple, Red.
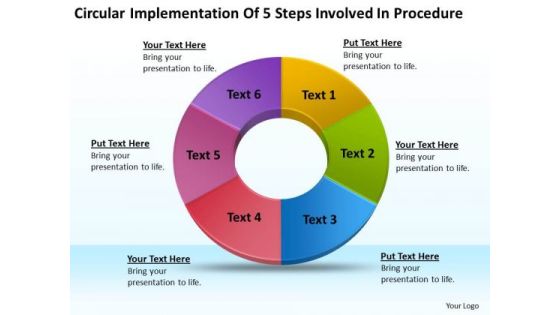
Implementation Of 5 Steps Involved Procedure Business Plan Online PowerPoint Templates
We present our implementation of 5 steps involved procedure business plan online PowerPoint templates.Use our Ring Charts PowerPoint Templates because It will Give impetus to the hopes of your colleagues. Our PowerPoint Templates and Slides will aid you in winning their trust. Download our Process and Flows PowerPoint Templates because Our PowerPoint Templates and Slides are the chords of your song. String them along and provide the lilt to your views. Download our Flow Charts PowerPoint Templates because Our PowerPoint Templates and Slides has conjured up a web of all you need with the help of our great team. Use them to string together your glistening ideas. Download our Business PowerPoint Templates because Our PowerPoint Templates and Slides help you meet the demand of the Market. Just browse and pick the slides that appeal to your intuitive senses. Use our Success PowerPoint Templates because You have a driving passion to excel in your field. Our PowerPoint Templates and Slides will prove ideal vehicles for your ideas.Use these PowerPoint slides for presentations relating to Pie, isolated, bar, business, concept, sign, render, spectrum, bright, diagram, circle, percentage, light, graphic, element, digital, report,marketing, abstract, graph, wheel, modern, creative, illustration, icon, chart, colour, up, web, design, color, colorful, painting, set, art, progress, effect, style,part, background, five, rainbow, pattern, financial. The prominent colors used in the PowerPoint template are Red, Yellow, Blue.
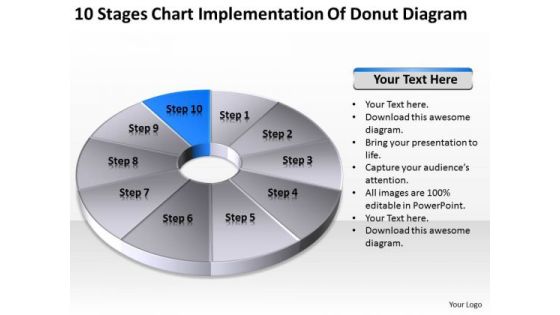
Chart Implementation Of Donut Diagram Ppt Business Plan Outline Template Free PowerPoint Templates
We present our chart implementation of donut diagram ppt business plan outline template free PowerPoint templates.Download our Ring Charts PowerPoint Templates because They will Put the wind in your sails. Skim smoothly over the choppy waters of the market. Present our Process and Flows PowerPoint Templates because They will Put the wind in your sails. Skim smoothly over the choppy waters of the market. Present our Flow Charts PowerPoint Templates because Our PowerPoint Templates and Slides will Embellish your thoughts. They will help you illustrate the brilliance of your ideas. Use our Marketing PowerPoint Templates because Our PowerPoint Templates and Slides come in all colours, shades and hues. They help highlight every nuance of your views. Download and present our Business PowerPoint Templates because It will Strengthen your hand with your thoughts. They have all the aces you need to win the day.Use these PowerPoint slides for presentations relating to Pie, chart, isolated, white, bar, business, concept, sign, render, spectrum, bright, diagram, circle, percentage, light, graphic,element, digital, report, marketing, abstract, graph, modern, creative, illustration, icon, up, web, design, painting, set, art, progress, effect, style, steps,ten,pattern, financial. The prominent colors used in the PowerPoint template are Gray, Blue, White.
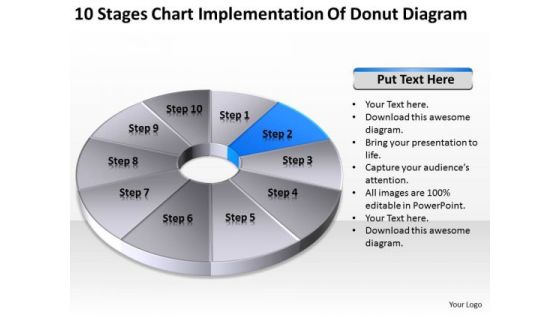
Chart Implementation Of Donut Diagram Ppt How To Wright Business Plan PowerPoint Templates
We present our chart implementation of donut diagram ppt how to wright business plan PowerPoint templates.Download and present our Ring Charts PowerPoint Templates because Our PowerPoint Templates and Slides help you pinpoint your timelines. Highlight the reasons for your deadlines with their use. Download and present our Process and Flows PowerPoint Templates because Your audience will believe you are the cats whiskers. Present our Flow Charts PowerPoint Templates because Our PowerPoint Templates and Slides are effectively colour coded to prioritise your plans They automatically highlight the sequence of events you desire. Use our Marketing PowerPoint Templates because Your ideas provide food for thought. Our PowerPoint Templates and Slides will help you create a dish to tickle the most discerning palate. Present our Business PowerPoint Templates because Our PowerPoint Templates and Slides will provide you a launch platform. Give a lift off to your ideas and send them into orbit.Use these PowerPoint slides for presentations relating to Pie, chart, isolated, white, bar, business, concept, sign, render, spectrum, bright, diagram, circle, percentage, light, graphic,element, digital, report, marketing, abstract, graph, modern, creative, illustration, icon, up, web, design, painting, set, art, progress, effect, style, steps,ten,pattern, financial. The prominent colors used in the PowerPoint template are Blue, Black, Gray.
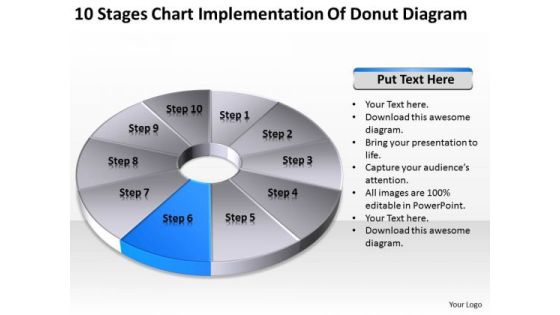
Chart Implementation Of Donut Diagram Simple Business Plan Templates PowerPoint
We present our chart implementation of donut diagram simple business plan templates PowerPoint.Present our Ring Charts PowerPoint Templates because Our PowerPoint Templates and Slides will steer your racing mind. Hit the right buttons and spur on your audience. Download and present our Process and Flows PowerPoint Templates because Our PowerPoint Templates and Slides will let Your superior ideas hit the target always and everytime. Use our Flow Charts PowerPoint Templates because Our PowerPoint Templates and Slides have the Brilliant backdrops. Guaranteed to illuminate the minds of your audience. Use our Marketing PowerPoint Templates because our PowerPoint Templates and Slides will give your ideas the shape. Use our Business PowerPoint Templates because You are an avid believer in ethical practices. Highlight the benefits that accrue with our PowerPoint Templates and Slides.Use these PowerPoint slides for presentations relating to Pie, chart, isolated, white, bar, business, concept, sign, render, spectrum, bright, diagram, circle, percentage, light, graphic,element, digital, report, marketing, abstract, graph, modern, creative, illustration, icon, up, web, design, painting, set, art, progress, effect, style, steps,ten,pattern, financial. The prominent colors used in the PowerPoint template are Gray, White, Blue.

Corporate Physical Health And Fitness Culture Playbook Physical Wellbeing Evaluation Inspiration PDF
Mentioned slide showcases checklist that can be used by managers to evaluate employees monthly calorie intake. Sections covered in the checklist are meal, calories, grams of fat, fat percentage etc. Deliver an awe inspiring pitch with this creative corporate physical health and fitness culture playbook physical wellbeing evaluation inspiration pdf bundle. Topics like monthly summary, calories consumed, fat percentage can be discussed with this completely editable template. It is available for immediate download depending on the needs and requirements of the user.

Optimizing Ecommerce Marketing Plan To Improve Sales Increase In Potential Leads Of Company Background PDF
This slide shows the bar graph that represents the potential leads of the company in six consecutive years which depicts the increase in percentage of online leads. Deliver an awe inspiring pitch with this creative Optimizing Ecommerce Marketing Plan To Improve Sales Increase In Potential Leads Of Company Background PDF bundle. Topics like E Commerce Marketing Plan, Potential Leads Of Company can be discussed with this completely editable template. It is available for immediate download depending on the needs and requirements of the user.
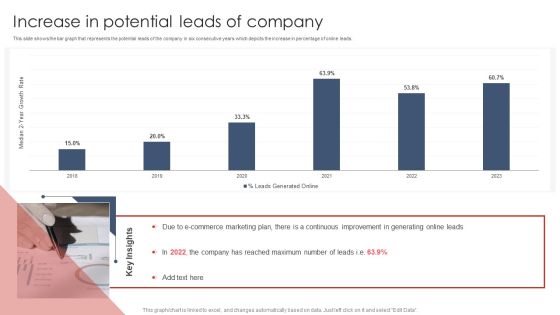
Increase In Potential Leads Of Company Digital Marketing Strategy Deployment Slides PDF
This slide shows the bar graph that represents the potential leads of the company in six consecutive years which depicts the increase in percentage of online leads.If you are looking for a format to display your unique thoughts, then the professionally designed Increase In Potential Leads Of Company Digital Marketing Strategy Deployment Slides PDF is the one for you. You can use it as a Google Slides template or a PowerPoint template. Incorporate impressive visuals, symbols, images, and other charts. Modify or reorganize the text boxes as you desire. Experiment with shade schemes and font pairings. Alter, share or cooperate with other people on your work. Download Increase In Potential Leads Of Company Digital Marketing Strategy Deployment Slides PDF and find out how to give a successful presentation. Present a perfect display to your team and make your presentation unforgettable.
Optimizing Digital Channels To Enhance Marketing Strategy Increase In Potential Leads Of Company Structure PDF
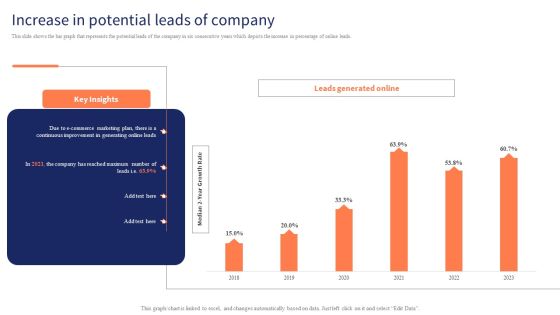
This slide shows the bar graph that represents the potential leads of the company in six consecutive years which depicts the increase in percentage of online leads. Do you have to make sure that everyone on your team knows about any specific topic I yes, then you should give Optimizing Digital Channels To Enhance Marketing Strategy Increase In Potential Leads Of Company Structure PDF a try. Our experts have put a lot of knowledge and effort into creating this impeccable Optimizing Digital Channels To Enhance Marketing Strategy Increase In Potential Leads Of Company Structure PDF. You can use this template for your upcoming presentations, as the slides are perfect to represent even the tiniest detail. You can download these templates from the Slidegeeks website and these are easy to edit. So grab these today.

Business Diagram 3d Pie Chart One Blue Piece Presentation Template
This business plan power point diagram template has been designed with graphic of 3d pyramid and five stages. Explain the concept of percentage and finance related topics in your financial presentations. Use this diagram template and display linear sequential flow of any financial process.
Quality Management Kpis To Measure Customer Service Agents Performance Sample PDF
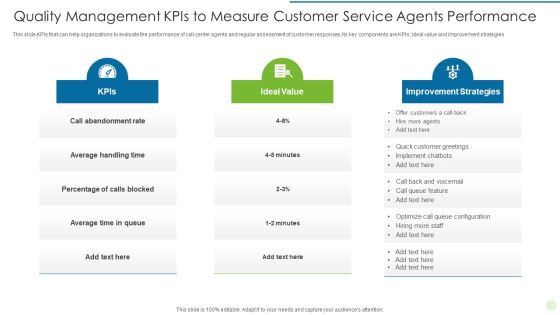
Presenting Quality Management Kpis To Measure Customer Service Agents Performance Sample PDF to dispense important information. This template comprises three stages. It also presents valuable insights into the topics including Improvement Strategies, Customer Greetings, Percentage Of Calls Blocked This is a completely customizable PowerPoint theme that can be put to use immediately. So, download it and address the topic impactfully.

PMI Agile Certification Program IT Exam Blueprint Of PMI ACP Certification Slides PDF
Mentioned slide illustrates information on the exam blueprint of PMI Agile Certified Practitioner certification. Sections covered in the slide are domain and percentage of questions.Deliver an awe inspiring pitch with this creative pmi agile certification program it exam blueprint of pmi acp certification slides pdf bundle. Topics like exam blueprint of pmi acp certification can be discussed with this completely editable template. It is available for immediate download depending on the needs and requirements of the user.
Workspace Wellness Playbook Physical Wellbeing Evaluation Checklist For Calorie Intake Brochure PDF
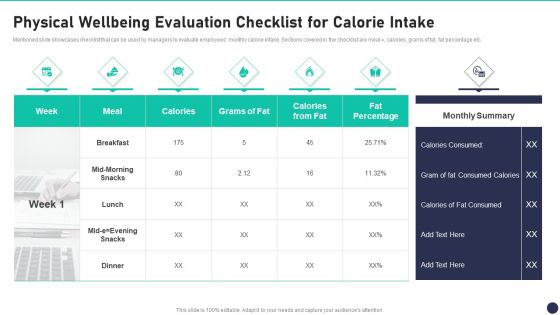
Mentioned slide showcases checklist that can be used by managers to evaluate employees monthly calorie intake. Sections covered in the checklist are meal , calories, grams of fat, fat percentage etc.Deliver an awe inspiring pitch with this creative workspace wellness playbook physical wellbeing evaluation checklist for calorie intake brochure pdf bundle. Topics like physical wellbeing evaluation checklist for calorie intake can be discussed with this completely editable template. It is available for immediate download depending on the needs and requirements of the user.

Digital Email Bounce Rate Improvement Plan Results Diagrams PDF
This slide shows quarterly percentage of email bounce before and after implementing improvement plan. It includes hard bounce, soft bounce, general bounce, blocked, etc. Showcasing this set of slides titled Digital Email Bounce Rate Improvement Plan Results Diagrams PDF. The topics addressed in these templates are Implementing, Protect Delivery Reputation, Strategy. All the content presented in this PPT design is completely editable. Download it and make adjustments in color, background, font etc. as per your unique business setting.

Analysis Of Stress Level At Work In Organization One Pager Documents
This slide covers details regarding percentage of stress related absence in organization. Presenting you an exemplary Analysis Of Stress Level At Work In Organization One Pager Documents. Our one-pager comprises all the must-have essentials of an inclusive document. You can edit it with ease, as its layout is completely editable. With such freedom, you can tweak its design and other elements to your requirements. Download this Analysis Of Stress Level At Work In Organization One Pager Documents brilliant piece now.

Pmi Agile Scrum Master Certification It Exam Blueprint Of Pmi Acp Certification Portrait PDF
Mentioned slide illustrates information on the exam blueprint of PMI Agile Certified Practitioner certification. Sections covered in the slide are domain and percentage of questions. Presenting pmi agile scrum master certification it exam blueprint of pmi acp certification portrait pdf to provide visual cues and insights. Share and navigate important information on two stages that need your due attention. This template can be used to pitch topics like team performance, adaptive planning, product process. In addtion, this PPT design contains high resolution images, graphics, etc, that are easily editable and available for immediate download.
Health And Wellbeing Playbook Physical Wellbeing Evaluation Checklist For Calorie Intake Introduction PDF
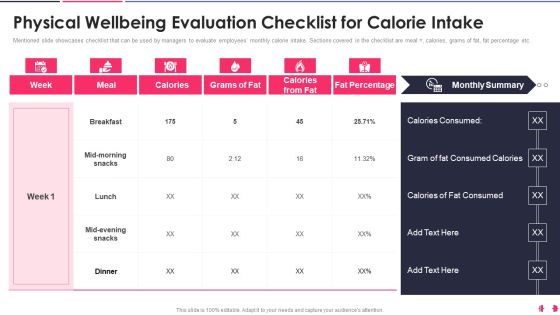
Mentioned slide showcases checklist that can be used by managers to evaluate employees monthly calorie intake. Sections covered in the checklist are meal calories, grams of fat, fat percentage etc.Deliver an awe inspiring pitch with this creative health and wellbeing playbook physical wellbeing evaluation checklist for calorie intake introduction pdf bundle. Topics like calories consumed, gram of fat consumed calories, calories of fat consumed can be discussed with this completely editable template. It is available for immediate download depending on the needs and requirements of the user.

Agile Professional Certification PMI IT Exam Blueprint Of PMI ACP Certification Icons PDF
Mentioned slide illustrates information on the exam blueprint of PMI Agile Certified Practitioner certification. Sections covered in the slide are domain and percentage of questions.Presenting agile professional certification pmi it exam blueprint of pmi acp certification icons pdf to provide visual cues and insights. Share and navigate important information on one stage that need your due attention. This template can be used to pitch topics like stakeholder engagement, team performance, continuous improvement In addtion, this PPT design contains high resolution images, graphics, etc, that are easily editable and available for immediate download.
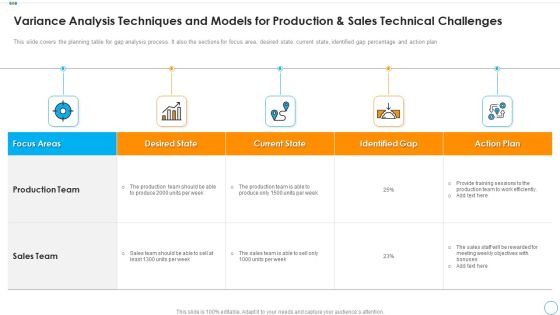
Variance Analysis Techniques And Models For Production And Sales Technical Challenges Graphics PDF
This slide covers the planning table for gap analysis process. It also the sections for focus area, desired state, current state, identified gap percentage and action plan.Persuade your audience using this variance analysis techniques and models for production and sales technical challenges graphics pdf. This PPT design covers five stages, thus making it a great tool to use. It also caters to a variety of topics including production team, sales team, identified gap. Download this PPT design now to present a convincing pitch that not only emphasizes the topic but also showcases your presentation skills.
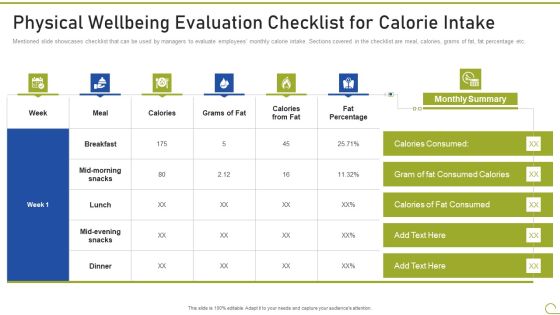
Health And Fitness Playbook Physical Wellbeing Evaluation Checklist For Calorie Intake Topics PDF
Mentioned slide showcases checklist that can be used by managers to evaluate employees monthly calorie intake. Sections covered in the checklist are meal, calories, grams of fat, fat percentage etc. Deliver an awe inspiring pitch with this creative health and fitness playbook physical wellbeing evaluation checklist for calorie intake topics pdf bundle. Topics like calories consumed, gram fat consumed calories, calories fat consumed can be discussed with this completely editable template. It is available for immediate download depending on the needs and requirements of the user.

Agile Certified Professional Exam Blueprint Of PMI ACP Certification Topics PDF
Mentioned slide illustrates information on the exam blueprint of PMI Agile Certified Practitioner certification. Sections covered in the slide are domain and percentage of questions. Presenting Agile Certified Professional Exam Blueprint Of PMI ACP Certification Topics PDF to provide visual cues and insights. Share and navigate important information on one stages that need your due attention. This template can be used to pitch topics like PMI To ACP Examination, Content Outline, Agile Principal And Mindset, Stakeholder Engagement. In addtion, this PPT design contains high resolution images, graphics, etc, that are easily editable and available for immediate download.

Key Findings Of Supplier Assessment And Evaluation Elements PDF
The purpose of this slide is to showcase major findings of supplier performance assessment. The key attributes include weightage, score, percentage of compliance, and minimum score requirement against each assessment section. Showcasing this set of slides titled Key Findings Of Supplier Assessment And Evaluation Elements PDF. The topics addressed in these templates are Supply Chain Management, Operational Capabilities, Corporate Social Responsibility. All the content presented in this PPT design is completely editable. Download it and make adjustments in color, background, font etc. as per your unique business setting.
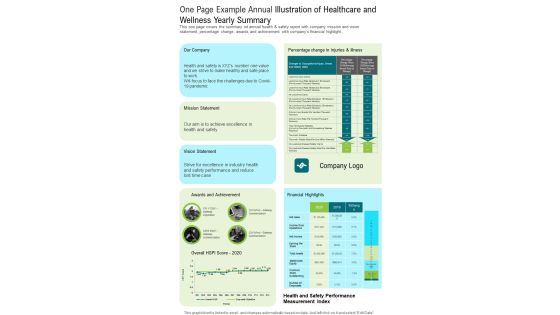
One Page Example Annual Illustration Of Healthcare And Wellness Yearly Summary One Pager Documents
This one page covers the summary od annual health and safety report with company mission and vision statement, percentage change, awards and achievement with companys financial highlight. Presenting you a fantastic One Page Example Annual Illustration Of Healthcare And Wellness Yearly Summary One Pager Documents. This piece is crafted on hours of research and professional design efforts to ensure you have the best resource. It is completely editable and its design allow you to rehash its elements to suit your needs. Get this One Page Example Annual Illustration Of Healthcare And Wellness Yearly Summary One Pager Documents A4 One-pager now.
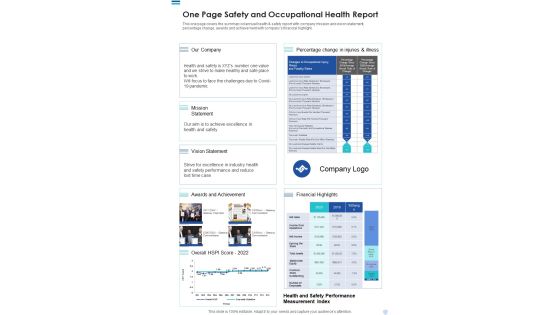
One Page Safety And Occupational Health Report One Pager Documents
This one page covers the summary od annual health and safety report with company mission and vision statement, percentage change, awards and achievement with companys financial highlight. Presenting you a fantastic One Page Safety And Occupational Health Report One Pager Documents. This piece is crafted on hours of research and professional design efforts to ensure you have the best resource. It is completely editable and its design allow you to rehash its elements to suit your needs. Get this One Page Safety And Occupational Health Report One Pager Documents A4 One-pager now.

Breakdown Of Shareholder Information By Type One Pager Documents
Mentioned slide shows breakdown of companys valuable shareholder information by type. It also includes the information of top 10 shareholders with no. of shares held and percentage of total number of shares issued. Presenting you an exemplary Breakdown Of Shareholder Information By Type One Pager Documents. Our one-pager comprises all the must-have essentials of an inclusive document. You can edit it with ease, as its layout is completely editable. With such freedom, you can tweak its design and other elements to your requirements. Download this Breakdown Of Shareholder Information By Type One Pager Documents brilliant piece now.
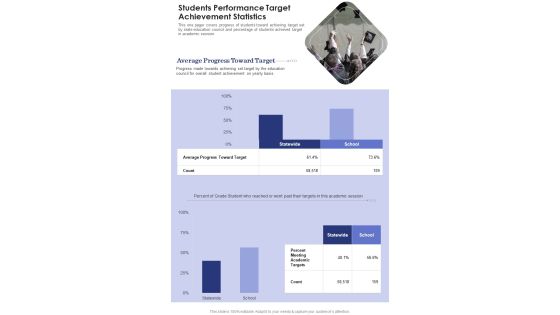
Students Performance Target Achievement Statistics One Pager Documents
This one pager covers progress of students toward achieving target set by state education council and percentage of students achieved target in academic session. Presenting you an exemplary Students Performance Target Achievement Statistics One Pager Documents. Our one-pager comprises all the must-have essentials of an inclusive document. You can edit it with ease, as its layout is completely editable. With such freedom, you can tweak its design and other elements to your requirements. Download this Students Performance Target Achievement Statistics One Pager Documents brilliant piece now.
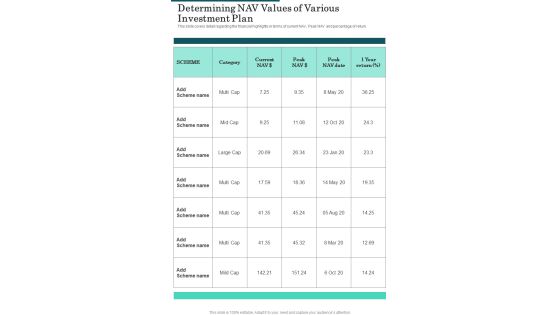
Determining NAV Values Of Various Investment Plan One Pager Documents
This slide covers detail regarding the financial highlights in terms of current NAV, Peak NAV and percentage of return. Presenting you an exemplary Determining NAV Values Of Various Investment Plan One Pager Documents. Our one-pager comprises all the must-have essentials of an inclusive document. You can edit it with ease, as its layout is completely editable. With such freedom, you can tweak its design and other elements to your requirements. Download this Determining NAV Values Of Various Investment Plan One Pager Documents brilliant piece now.

Companys Workforce Full Time Employees By Years Of Service One Pager Documents
This page covers the percentage split of total number employees by their years of services in this company. Presenting you a fantastic Companys Workforce Full Time Employees By Years Of Service One Pager Documents. This piece is crafted on hours of research and professional design efforts to ensure you have the best resource. It is completely editable and its design allow you to rehash its elements to suit your needs. Get this Companys Workforce Full Time Employees By Years Of Service One Pager Documents A4 One-pager now.

 Home
Home