Percentage Bar

Bar Chart Ppt PowerPoint Presentation Infographic Template Skills
This is a bar chart ppt powerpoint presentation infographic template skills. This is a nine stage process. The stages in this process are sales in percentage, finance, business, marketing, strategy, success.

Bar Graph Ppt PowerPoint Presentation Visual Aids Model
This is a bar graph ppt powerpoint presentation visual aids model. This is a three stage process. The stages in this process are business, strategy, analysis, planning, sales in percentage.

Bar Graph Product Ppt PowerPoint Presentation Model Graphic Tips
This is a bar graph product ppt powerpoint presentation model graphic tips. This is a three stage process. The stages in this process are product, percentage, business, management, marketing.

Bar Chart Ppt PowerPoint Presentation Pictures Background Image
This is a bar chart ppt powerpoint presentation pictures background image. This is a seven stage process. The stages in this process are financial years, sales in percentage, graph, business.
Stacked Bar Template 2 Ppt PowerPoint Presentation Icon Pictures
This is a stacked bar template 2 ppt powerpoint presentation icon pictures. This is a four stage process. The stages in this process are product, percentage, finance, business, marketing.

Bar Graph Template 2 Ppt PowerPoint Presentation Ideas Files
This is a bar graph template 2 ppt powerpoint presentation ideas files. This is a five stage process. The stages in this process are in percentage, business, marketing, finance, graph.

Stacked Bar Template 1 Ppt PowerPoint Presentation Ideas Design Templates
This is a stacked bar template 1 ppt powerpoint presentation ideas design templates. This is a two stage process. The stages in this process are product, finance, percentage, business, marketing.

Bar Chart Ppt PowerPoint Presentation Professional Graphics Download
This is a bar chart ppt powerpoint presentation professional graphics download. This is a seven stage process. The stages in this process are sales in percentage, financial years, chart, business.
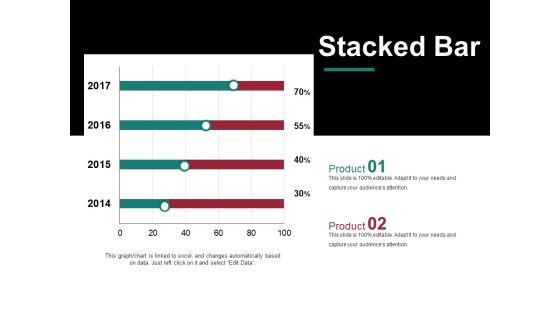
Stacked Bar Template 2 Ppt PowerPoint Presentation Model Graphic Images
This is a stacked bar template 2 ppt powerpoint presentation model graphic images. This is a two stage process. The stages in this process are business, years, marketing, percentage, finance.
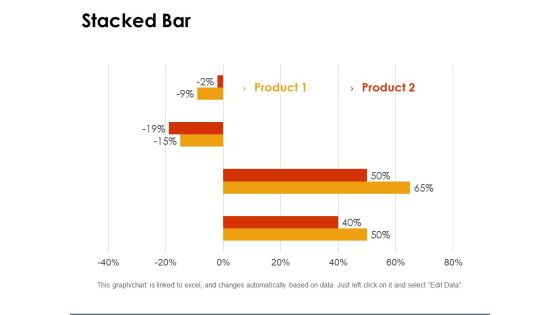
Stacked Bar Template 1 Ppt PowerPoint Presentation Gallery Clipart
This is a stacked bar template 1 ppt powerpoint presentation gallery clipart. This is a two stage process. The stages in this process are percentage, graph, business, marketing, finance.
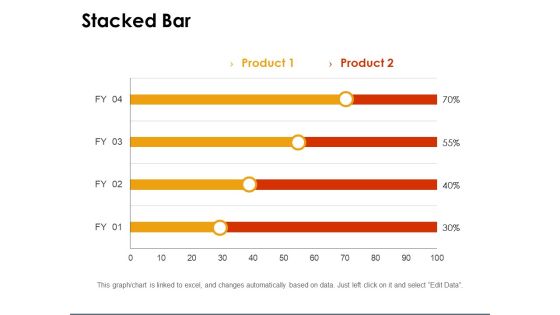
Stacked Bar Template 2 Ppt PowerPoint Presentation Infographics Graphics Design
This is a stacked bar template 2 ppt powerpoint presentation infographics graphics design. This is a two stage process. The stages in this process are percentage, business, marketing, finance.

Stacked Bar Ppt PowerPoint Presentation Portfolio Background Image
This is a two stacked bar ppt powerpoint presentation portfolio background image. This is a two stage process. The stages in this process are sales in percentage, graph, business, marketing, strategy.
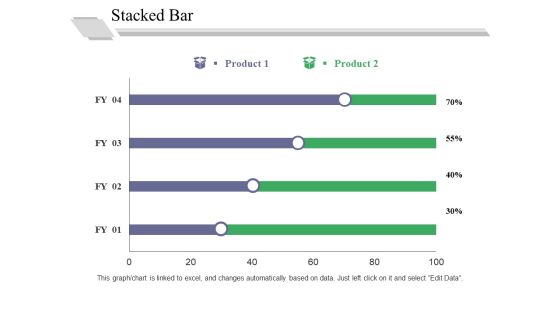
Stacked Bar Template 1 Ppt PowerPoint Presentation Outline Good
This is a stacked bar template 1 ppt powerpoint presentation outline good. This is a two stage process. The stages in this process are in percentage, business, marketing, graph, strategy.
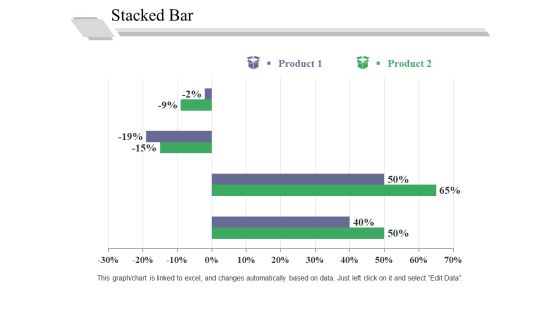
Stacked Bar Template 2 Ppt PowerPoint Presentation Professional Graphics Pictures
This is a stacked bar template 2 ppt powerpoint presentation professional graphics pictures. This is a two stage process. The stages in this process are in percentage, business, marketing, graph, strategy.

Bar Chart Ppt PowerPoint Presentation Visual Aids Diagrams
This is a bar chart ppt powerpoint presentation visual aids diagrams. This is a two stage process. The stages in this process are business, marketing, financial years, sales in percentage, graph.

Bar Chart Ppt PowerPoint Presentation Inspiration Background Image
This is a bar chart ppt powerpoint presentation inspiration background image. This is a two stage process. The stages in this process are business, marketing, strategy, finance, in years, in percentage.
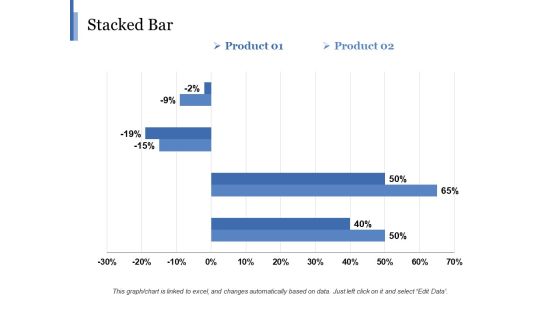
Stacked Bar Template 2 Ppt PowerPoint Presentation Gallery Background
This is a stacked bar template 2 ppt powerpoint presentation gallery background. This is a two stage process. The stages in this process are business, marketing, finance, graph, strategy, percentage.

Bar Chart Ppt PowerPoint Presentation Summary File Formats
This is a bar chart ppt powerpoint presentation summary file formats. This is a two stage process. The stages in this process are business, finance, financial years, sales in percentage, graph.

Bar Chart Ppt PowerPoint Presentation Slides Example File
This is a bar chart ppt powerpoint presentation slides example file. This is a two stage process. The stages in this process are product, financial years, sales in percentage.

Bar Chart Ppt PowerPoint Presentation Infographic Template Graphics Design
This is a bar chart ppt powerpoint presentation infographic template graphics design. This is a five stage process. The stages in this process are management, marketing, business, percentage, product.

Clustered Bar Financial Ppt PowerPoint Presentation Gallery Designs Download
This is a clustered bar financial ppt powerpoint presentation gallery designs download. This is a three stage process. The stages in this process are percentage, product, business, management, marketing.

Clustered Bar Business Product Ppt PowerPoint Presentation Gallery Background
This is a clustered bar business product ppt powerpoint presentation gallery background. This is a three stage process. The stages in this process are business, management, marketing, percentage, product.
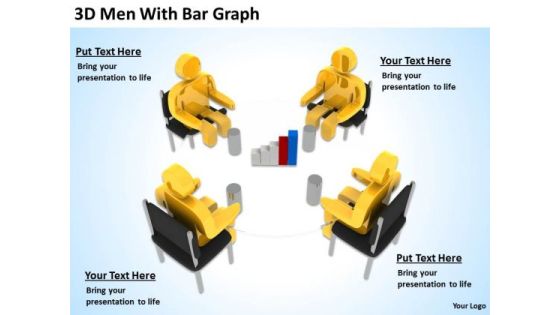
Business People Vector 3d Men With Bar Graph PowerPoint Slides
We present our business people vector 3d men with bar graph PowerPoint Slides.Use our People PowerPoint Templates because Our PowerPoint Templates and Slides are a sure bet. Gauranteed to win against all odds. Download and present our Business PowerPoint Templates because Our PowerPoint Templates and Slides will bullet point your ideas. See them fall into place one by one. Download and present our Flow Charts PowerPoint Templates because Our PowerPoint Templates and Slides are created by a hardworking bunch of busybees. Always flitting around with solutions gauranteed to please. Download our Marketing PowerPoint Templates because It can Bubble and burst with your ideas. Use our Shapes PowerPoint Templates because Our PowerPoint Templates and Slides will let you Leave a lasting impression to your audiences. They possess an inherent longstanding recall factor.Use these PowerPoint slides for presentations relating to 3d, accounting, analysis, bar, business, cartoon,cash, character, chart, clipart, committee, company, concept, corporate,council, directors, display, document, economics, executive, figure, finance,financial, goal, graph, group, growth, guy, human, humanoid, man, management,market, meeting, money, office, percentage, performance, pie, presentation, report,room, statistics, table, team. The prominent colors used in the PowerPoint template are Yellow, Black, Gray. Professionals tell us our business people vector 3d men with bar graph PowerPoint Slides have awesome images to get your point across. Professionals tell us our analysis PowerPoint templates and PPT Slides will help you be quick off the draw. Just enter your specific text and see your points hit home. People tell us our business people vector 3d men with bar graph PowerPoint Slides effectively help you save your valuable time. Customers tell us our bar PowerPoint templates and PPT Slides are effectively colour coded to prioritise your plans They automatically highlight the sequence of events you desire. The feedback we get is that our business people vector 3d men with bar graph PowerPoint Slides will generate and maintain the level of interest you desire. They will create the impression you want to imprint on your audience. Use our business PowerPoint templates and PPT Slides have awesome images to get your point across.

Bar Chart Representing Success Rate Of Linkedin Promotion Strategy Rules PDF
This slide shows graphical representation of LinkedIn marketing strategy in terms of success percentage by companies such as B2C, B2B software , B2B business services, etc. which reflects effectiveness of strategies in business Pitch your topic with ease and precision using this bar chart representing success rate of linkedin promotion strategy rules pdf. This layout presents information on bar chart representing success rate of linkedin promotion strategy. It is also available for immediate download and adjustment. So, changes can be made in the color, design, graphics or any other component to create a unique layout.
Multiple Projects Progress Tracking Report Tracking Report With Bar Graph Information PDF
This slide shows the status report of various projects in order to help the project manager to track their performance. It includes project names, no.of tasks, start and end date, days taken for completion, progress and remaining percentage of projects.Showcasing this set of slides titled Multiple Projects Progress Tracking Report Tracking Report With Bar Graph Information PDF. The topics addressed in these templates are Multiple Projects, Progress Tracking, Report Tracking Report. All the content presented in this PPT design is completely editable. Download it and make adjustments in color, background, font etc. as per your unique business setting.

Business Education PowerPoint Templates Business Bar Graph Data Driven Ppt Slides
Business Education PowerPoint Templates Business bar graph data driven PPT Slides-This PowerPoint slide is a data driven Columns Chart. The number of columns depend on the data.-Business Editable PowerPoint Templates Business beveled column chart PPT Slides-This ppt can be used for concepts relating to-chart,, graph, growth, investment, , market, percentage, , presentation report, results, statistics, stock, success and business.

Functional Analysis Of Business Operations Clustered Bar Chart Ppt Inspiration Gallery PDF
Presenting this set of slides with name functional analysis of business operations clustered bar chart ppt inspiration gallery pdf. The topics discussed in these slides are sales in percentage, product, years. This is a completely editable PowerPoint presentation and is available for immediate download. Download now and impress your audience.
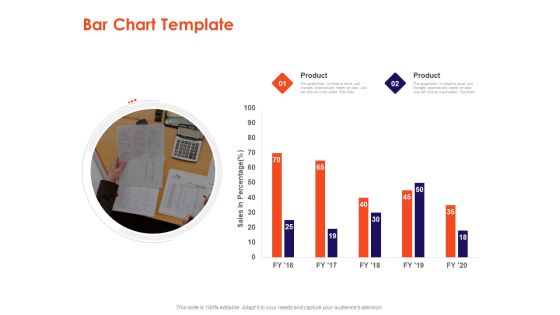
Understanding Business REQM Bar Chart Template Ppt Ideas Visual Aids PDF
Presenting this set of slides with name understanding business reqm bar chart template ppt ideas visual aids pdf. The topics discussed in these slides are product, sales, percentage. This is a completely editable PowerPoint presentation and is available for immediate download. Download now and impress your audience.

The Business People 3d Man Walking On Bar Graph Side PowerPoint Slides
We present our the business people 3d man walking on bar graph side PowerPoint Slides.Present our People PowerPoint Templates because Our PowerPoint Templates and Slides are created by a hardworking bunch of busybees. Always flitting around with solutions gauranteed to please. Present our Business PowerPoint Templates because Your success is our commitment. Our PowerPoint Templates and Slides will ensure you reach your goal. Use our Future PowerPoint Templates because you should once Tap the ingenuity of our PowerPoint Templates and Slides. They are programmed to succeed. Download and present our Success PowerPoint Templates because It can Conjure up grand ideas with our magical PowerPoint Templates and Slides. Leave everyone awestruck by the end of your presentation. Use our Process and Flows PowerPoint Templates because Our PowerPoint Templates and Slides provide you with a vast range of viable options. Select the appropriate ones and just fill in your text. Use these PowerPoint slides for presentations relating to 3d, aim, background, bar, business, chart, climbing, competition,concept, confident, corporate, design, executive, finance, financial, goal, graph,graphic, growing, growth, idea, illustration, market, men, people, percentage,person, phone, purple, race, rising, running, share, smart, succeed, success,successful, suit, walking, white, winner, worker, working. The prominent colors used in the PowerPoint template are Red, Gray, White. We assure you our the business people 3d man walking on bar graph side PowerPoint Slides will help them to explain complicated concepts. You can be sure our concept PowerPoint templates and PPT Slides will make the presenter look like a pro even if they are not computer savvy. Use our the business people 3d man walking on bar graph side PowerPoint Slides are second to none. We assure you our chart PowerPoint templates and PPT Slides are second to none. Use our the business people 3d man walking on bar graph side PowerPoint Slides will make the presenter successul in his career/life. Professionals tell us our background PowerPoint templates and PPT Slides are aesthetically designed to attract attention. We guarantee that they will grab all the eyeballs you need.

Quantitative Analysis Of Data 5 Stages Business Plan For Bar PowerPoint Slides
We present our quantitative analysis of data 5 stages business plan for bar PowerPoint Slides.Use our Circle Charts PowerPoint Templates because Our PowerPoint Templates and Slides will give good value for money. They also have respect for the value of your time. Download our Business PowerPoint Templates because Our PowerPoint Templates and Slides will let you Leave a lasting impression to your audiences. They possess an inherent longstanding recall factor. Use our Shapes PowerPoint Templates because You can safely bank on our PowerPoint Templates and Slides. They will provide a growth factor to your valuable thoughts. Use our Signs PowerPoint Templates because You have gained great respect for your brilliant ideas. Use our PowerPoint Templates and Slides to strengthen and enhance your reputation. Download and present our Metaphors-Visual Concepts PowerPoint Templates because Our PowerPoint Templates and Slides are Clear and concise. Use them and dispel any doubts your team may have.Use these PowerPoint slides for presentations relating to business, chart, circle, circular, diagram, economy, finance, framework, graph, isolated, percentage, pie chart, results, scheme, statistics, stats, strategy, success. The prominent colors used in the PowerPoint template are Purple, Yellow, Green.

How To Draw Business Process Diagram 3d Team Discussing Bar Graph PowerPoint Templates
We present our how to draw business process diagram 3d team discussing bar graph PowerPoint templates.Download and present our Business PowerPoint Templates because It will get your audience in sync. Download and present our People PowerPoint Templates because You can Be the puppeteer with our PowerPoint Templates and Slides as your strings. Lead your team through the steps of your script. Use our Finance PowerPoint Templates because Our PowerPoint Templates and Slides are created by a hardworking bunch of busybees. Always flitting around with solutions gauranteed to please. Download and present our Symbol PowerPoint Templates because Our PowerPoint Templates and Slides will provide you a launch platform. Give a lift off to your ideas and send them into orbit. Download and present our Success PowerPoint Templates because You have gained great respect for your brilliant ideas. Use our PowerPoint Templates and Slides to strengthen and enhance your reputation.Use these PowerPoint slides for presentations relating to 3d, art, boardroom, budget, business, ceo, character, communication, concept, conference, corporate, council, discussion, economy, executive, finance, gold, graph, growth, icon, idea, idiom, illustration, isolated, lecture, manage, management, market, meet, metaphor, money, office, over, percentage, planning, presentation, projection, prospectus, report, study, summit, symbol, talk, team, white. The prominent colors used in the PowerPoint template are Red, Gray, Black. The feedback we get is that our how to draw business process diagram 3d team discussing bar graph PowerPoint templates are designed by a team of presentation professionals. Customers tell us our character PowerPoint templates and PPT Slides will impress their bosses and teams. The feedback we get is that our how to draw business process diagram 3d team discussing bar graph PowerPoint templates are designed by professionals Professionals tell us our business PowerPoint templates and PPT Slides are readymade to fit into any presentation structure. Presenters tell us our how to draw business process diagram 3d team discussing bar graph PowerPoint templates will make you look like a winner. You can be sure our ceo PowerPoint templates and PPT Slides provide you with a vast range of viable options. Select the appropriate ones and just fill in your text.

Action Priority Bar Graph With Business Tasks Ppt Layouts Graphics Download PDF
Showcasing this set of slides titled action priority bar graph with business tasks ppt layouts graphics download pdf. The topics addressed in these templates are action priority bar graph with business tasks. All the content presented in this PPT design is completely editable. Download it and make adjustments in color, background, font etc. as per your unique business setting.

Clustered Column Ppt PowerPoint Presentation Infographic Template
This is a clustered column ppt powerpoint presentation infographic template. This is a two stage process. The stages in this process are finance, percentage, bar graph, business, marketing.
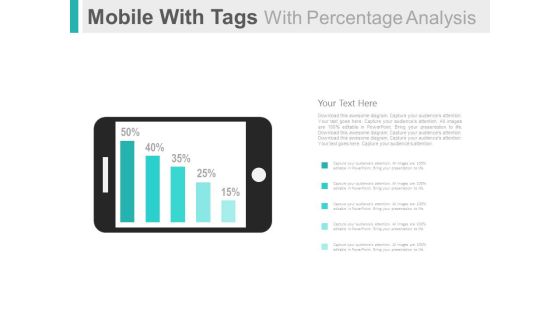
Mobile For Online Survey And Analysis Powerpoint Slides
This PowerPoint template has been designed with graphics of mobile and percentage bar graph. This PPT slide can be used to display online survey and analysis. You can download finance PowerPoint template to prepare awesome presentations.

Line Chart Ppt PowerPoint Presentation Ideas Example
This is a line chart ppt powerpoint presentation ideas example. This is a two stage process. The stages in this process are sales in percentage, bar graph, business, marketing, growth.

Area Chart Ppt PowerPoint Presentation Summary Templates
This is a area chart ppt powerpoint presentation summary templates. This is a two stage process. The stages in this process are product, in percentage, bar graph, growth, business.

Combo Chart Ppt PowerPoint Presentation Shapes
This is a combo chart ppt powerpoint presentation shapes. This is a eight stage process. The stages in this process are combo chart, business, marketing, sales in percentage, bar graph.
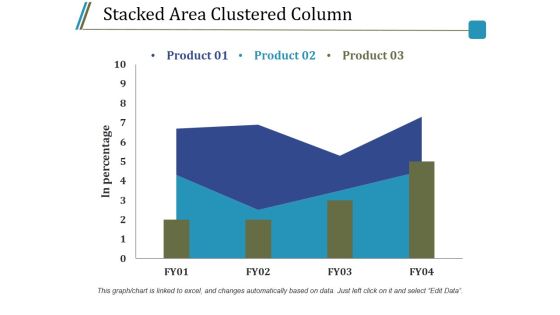
Stacked Area Clustered Column Ppt PowerPoint Presentation Model Guidelines
This is a stacked area clustered column ppt powerpoint presentation model guidelines. This is a three stage process. The stages in this process are product, in percentage, bar graph, growth, success.

Clustered Column Line Ppt PowerPoint Presentation Icon Ideas
This is a clustered column line ppt powerpoint presentation icon ideas. This is a three stage process. The stages in this process are product, in percentage, bar graph, success, growth.

Clustered Column Line Ppt PowerPoint Presentation Pictures Example
This is a clustered column line ppt powerpoint presentation pictures example. This is a three stage process. The stages in this process are product, in percentage, bar graph, growth, success.

Clustered Column Line Ppt PowerPoint Presentation Infographic Template Pictures
This is a clustered column line ppt powerpoint presentation infographic template pictures. This is a three stage process. The stages in this process are product, in percentage, bar graph, growth, success.
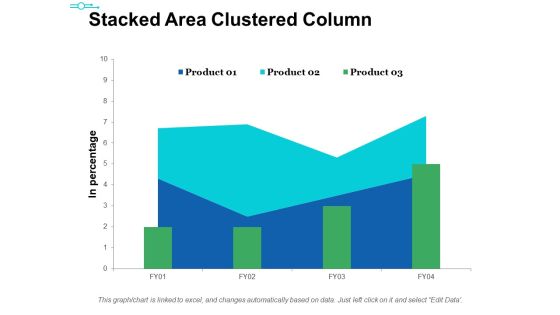
Stacked Area Clustered Column Ppt PowerPoint Presentation Ideas Themes
This is a stacked area clustered column ppt powerpoint presentation ideas themes. This is a three stage process. The stages in this process are product, in percentage, bar graph, area chart, growth.
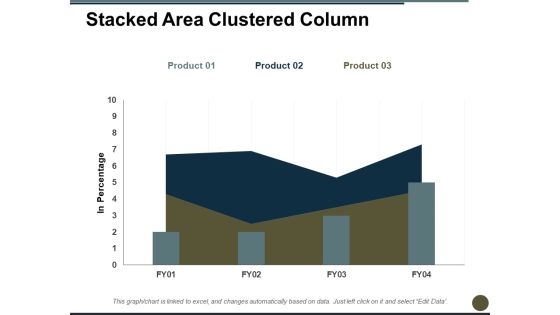
Stacked Area Clustered Column Ppt PowerPoint Presentation Professional Graphics
This is a stacked area clustered column ppt powerpoint presentation professional graphics. This is a three stage process. The stages in this process are in percentage, bar chart, product, growth, year.

Clustered Column Ppt PowerPoint Presentation File Slide
This is a clustered column ppt powerpoint presentation file slide. This is a two stage process. The stages in this process are product, financial year, sales in percentage, bar graph.

Column Chart Ppt PowerPoint Presentation Model Graphics Download
This is a column chart ppt powerpoint presentation model graphics download. This is a two stage process. The stages in this process are product, financial year, sales in percentage, bar graph, success.

Comparison Of Prices Ppt PowerPoint Presentation Designs Download
This is a comparison of prices ppt powerpoint presentation designs download. This is a two stage process. The stages in this process are comparison of prices, marketing, in percentage, bar graph, business.
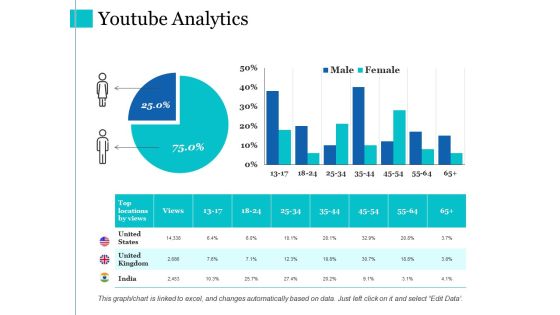
Youtube Analytics Ppt PowerPoint Presentation Layouts Graphic Images
This is a youtube analytics ppt powerpoint presentation layouts graphic images. This is a three stage process. The stages in this process are youtube analytics, finance, percentage, bar graph.

Clustered Column Ppt PowerPoint Presentation Infographic Template Background Designs
This is a clustered column ppt powerpoint presentation infographic template background designs. This is a two stage process. The stages in this process are sales in percentage, bar, business, marketing, planning.

Column Chart Ppt PowerPoint Presentation Professional Template
This is a column chart ppt powerpoint presentation professional template. This is a two stage process. The stages in this process are product, percentage, finance, bar graph, growth.

Area Chart Ppt PowerPoint Presentation Icon Gallery
This is a area chart ppt powerpoint presentation icon gallery. This is a two stage process. The stages in this process are sales in percentage, product, bar graph.

Clustered Column Line Ppt PowerPoint Presentation Samples
This is a clustered column line ppt powerpoint presentation samples. This is a four stage process. The stages in this process are finance, percentage, success, growth, bar graph.

Clustered Column Ppt PowerPoint Presentation Ideas Show
This is a clustered column ppt powerpoint presentation ideas show. This is a two stage process. The stages in this process are product, percentage, finance, business, bar graph.

Real Estate Home Price Index Ppt PowerPoint Presentation Samples
This is a real estate home price index ppt powerpoint presentation samples. This is a one stage process. The stages in this process are in percentage, business, bar graph, marketing, success, management.

Stacked Area Clustered Column Ppt PowerPoint Presentation Show Guidelines
This is a stacked area clustered column ppt powerpoint presentation show guidelines. This is a four stage process. The stages in this process are in percentage, product, bar graph, growth, success.

Clustered Column Line Ppt PowerPoint Presentation Topics
This is a clustered column line ppt powerpoint presentation topics. This is a three stage process. The stages in this process are product, in percentage, growth, bar graph, business.
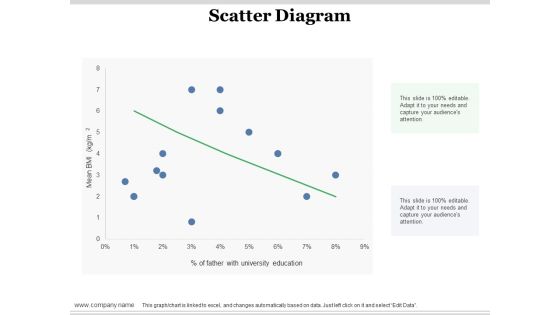
Scatter Diagram Ppt PowerPoint Presentation Infographic Template Design Ideas
This is a scatter diagram ppt powerpoint presentation infographic template design ideas. This is a one stage process. The stages in this process are scatter diagram, finance, in percentage, business, bar graph.
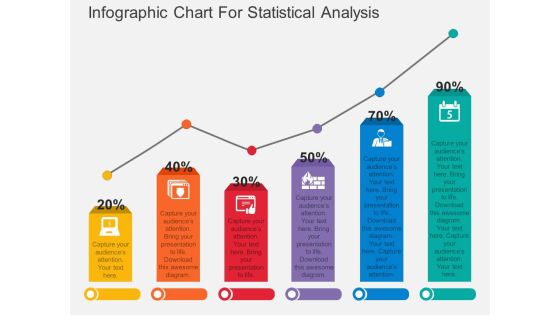
Infographic Chart For Statistical Analysis Powerpoint Template
Download this exclusive business diagram to display statistical analysis. This PowerPoint template contains bar chart with percentage values. This diagram is useful for business presentations.

Stacked Area Clustered Column Ppt PowerPoint Presentation File Background Designs
This is a stacked area clustered column ppt powerpoint presentation file background designs. This is a three stage process. The stages in this process are product, in percentage, growth, success, bar graph.

Column Chart Ppt PowerPoint Presentation Layouts Tips
This is a column chart ppt powerpoint presentation layouts tips. This is a six stage process. The stages in this process are sales in percentage, financial year, bar graph, growth, success.

Clustered Column Ppt PowerPoint Presentation Slides Smartart
This is a clustered column ppt powerpoint presentation slides smartart. This is a two stage process. The stages in this process are product, sales in percentage, financial year, bar graph.

 Home
Home