Percentage Bar

Employee Photo With Percentage Bars Powerpoint Slides
This dashboard template contains employee photo with percentage bars. This dashboard PowerPoint template conveys employees performance in a visual manner. Download this PPT slide for quick decision-making.
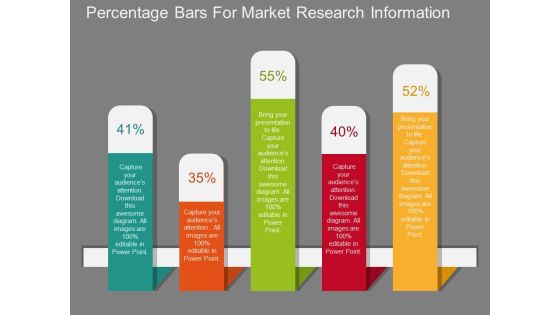
Percentage Bars For Market Research Information Powerpoint Template
This PowerPoint template displays diagram of percentage bars. This slide has been innovatively designed to present market research information. Capture the attention of your audience with this slide.
Profit Percentage Bar Graph Globe Growth PowerPoint Templates Ppt Backgrounds For Slides 0113
We present our Profit Percentage Bar Graph Globe Growth PowerPoint Templates PPT Backgrounds For Slides 0113.Download our Globe PowerPoint Templates because Our PowerPoint Templates and Slides will let your words and thoughts hit bullseye everytime. Download and present our Earth PowerPoint Templates because Our PowerPoint Templates and Slides are effectively colour coded to prioritise your plans They automatically highlight the sequence of events you desire. Present our Pie Charts PowerPoint Templates because Our PowerPoint Templates and Slides will let Your superior ideas hit the target always and everytime. Present our Future PowerPoint Templates because It will mark the footprints of your journey. Illustrate how they will lead you to your desired destination. Use our Success PowerPoint Templates because Our PowerPoint Templates and Slides will let Your superior ideas hit the target always and everytime.Use these PowerPoint slides for presentations relating to
Eight Percentage Bars With Business Icons Ppt PowerPoint Presentation Icon Graphic Tips
Presenting this set of slides with name eight percentage bars with business icons ppt powerpoint presentation icon graphic tips. This is a eight stage process. The stages in this process are eight percentage bars with business icons. This is a completely editable PowerPoint presentation and is available for immediate download. Download now and impress your audience.
Five Percentage Bars With Business Icons Ppt PowerPoint Presentation Styles Objects
Presenting this set of slides with name five percentage bars with business icons ppt powerpoint presentation styles objects. This is a five stage process. The stages in this process are five percentage bars with business icons. This is a completely editable PowerPoint presentation and is available for immediate download. Download now and impress your audience.
Four Percentage Bars With Business Icons Ppt PowerPoint Presentation Ideas Rules
Presenting this set of slides with name four percentage bars with business icons ppt powerpoint presentation ideas rules. This is a four stage process. The stages in this process are four percentage bars with business icons. This is a completely editable PowerPoint presentation and is available for immediate download. Download now and impress your audience.
Seven Percentage Bars With Business Icons Ppt PowerPoint Presentation Infographics Example Topics
Presenting this set of slides with name seven percentage bars with business icons ppt powerpoint presentation infographics example topics. This is a seven stage process. The stages in this process are seven percentage bars with business icons. This is a completely editable PowerPoint presentation and is available for immediate download. Download now and impress your audience.
Six Percentage Bars With Business Icons Ppt PowerPoint Presentation File Example
Presenting this set of slides with name six percentage bars with business icons ppt powerpoint presentation file example. This is a six stage process. The stages in this process are six percentage bars with business icons. This is a completely editable PowerPoint presentation and is available for immediate download. Download now and impress your audience.

Carbon Emission Rate Percentage Stacked Bar Graph Rules PDF
This slide shows emission rate percentage chart comparison of continents to determine lowest emission releasing continents. It includes continents and emission percentage Showcasing this set of slides titled Carbon Emission Rate Percentage Stacked Bar Graph Rules PDF. The topics addressed in these templates are Carbon Emission, Increase In Industrialization, New Manufacturing. All the content presented in this PPT design is completely editable. Download it and make adjustments in color, background, font etc. as per your unique business setting.

Bars Displaying Percentage Growth PowerPoint Templates
Our above PPT slide contains bar graph displaying percentage growth. This diagram of bar graph helps to depict statistical information. Use this diagram to impart more clarity to data and to create more sound impact on viewers.

Bar Chart Percentage Product Ppt PowerPoint Presentation Layouts Designs Download
This is a bar chart percentage product ppt powerpoint presentation layouts designs download. This is a two stage process. The stages in this process are percentage, product, business, management.

Bar Graph Percentage Product Ppt PowerPoint Presentation Layouts Microsoft
This is a bar graph percentage product ppt powerpoint presentation layouts microsoft. This is a three stage process. The stages in this process are business, management, marketing, percentage, product.
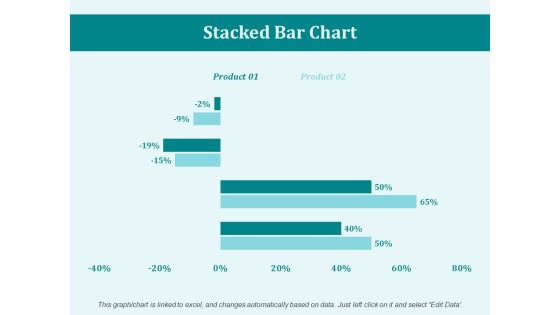
Stacked Bar Chart Percentage Ppt PowerPoint Presentation Portfolio Mockup
This is a stacked bar chart percentage ppt powerpoint presentation portfolio mockup. This is a two stage process. The stages in this process are business, marketing, management, percentage, product.

Bar Diagram Percentage Product Ppt PowerPoint Presentation Show Topics
This is a bar diagram percentage product ppt powerpoint presentation show topics. This is a two stage process. The stages in this process are percentage, product, business, management, marketing.

Bar Graph Percentage Product Ppt PowerPoint Presentation Styles Good
This is a bar graph percentage product ppt powerpoint presentation styles good. This is a three stage process. The stages in this process are area chart, finance, marketing, management, investment.

Bar Graph Percentage Ppt PowerPoint Presentation Model Styles
Presenting this set of slides with name bar graph percentage ppt powerpoint presentation model styles. The topics discussed in these slides are marketing, business, management, planning, strategy. This is a completely editable PowerPoint presentation and is available for immediate download. Download now and impress your audience.
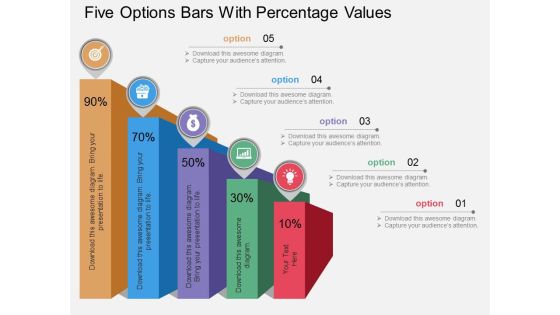
Five Options Bars With Percentage Values Powerpoint Template
Our professionally designed business diagram is as an effective tool for communicating ideas and planning. It contains five options bars with percentage values. Convey your views with this diagram slide. It will amplify the strength of your logic.
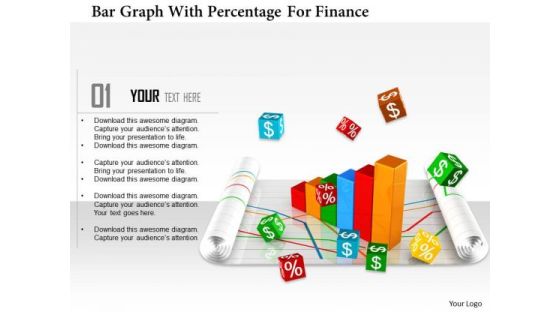
Stock Photo Bar Graph With Percentage For Finance PowerPoint Slide
This Power Point template has been designed with graphic of bar graph and percentage value. This image slide contains the concept of finance and accounting. Use this editable diagram for your business and finance related presentations.

Bar Graph With Increasing Percentage Flow Powerpoint Slides
This PowerPoint slide has been designed with bar graph and increasing percentage values. This diagram slide may be used to display profit growth. Prove the viability of your ideas with this professional slide.

Clustered Bar Chart Percentage Product Ppt PowerPoint Presentation Portfolio Example Introduction
This is a clustered bar chart percentage product ppt powerpoint presentation portfolio example introduction. This is a three stage process. The stages in this process are area chart, finance, marketing, management, investment.

Business Diagram Bars For Profit Percentages Presentation Template
Download this exclusive business diagram to present profit in percentage ratio. This slide contains the graphic of bars. This diagram can be useful for business presentations.

Bar Chart With Percentage Representing Annual Variance Ppt PowerPoint Presentation Gallery Portfolio PDF
Pitch your topic with ease and precision using this bar chart with percentage representing annual variance ppt powerpoint presentation gallery portfolio pdf. This layout presents information on bar chart with percentage representing annual variance. It is also available for immediate download and adjustment. So, changes can be made in the color, design, graphics or any other component to create a unique layout.

Bar Chart With Percentage Representing Inventory Ppt PowerPoint Presentation File Outfit PDF
Pitch your topic with ease and precision using this bar chart with percentage representing inventory ppt powerpoint presentation file outfit pdf. This layout presents information on bar chart with percentage representing inventory. It is also available for immediate download and adjustment. So, changes can be made in the color, design, graphics or any other component to create a unique layout.

Bar Chart With Percentage Showing Total Company Expenditures Ppt PowerPoint Presentation File Background PDF
Pitch your topic with ease and precision using this bar chart with percentage showing total company expenditures ppt powerpoint presentation file background pdf. This layout presents information on bar chart with percentage showing total company expenditures. It is also available for immediate download and adjustment. So, changes can be made in the color, design, graphics or any other component to create a unique layout.

Business Bar Chart With Percentage Analysis Ppt PowerPoint Presentation File Outline PDF
Presenting this set of slides with name business bar chart with percentage analysis ppt powerpoint presentation file outline pdf. The topics discussed in these slide is business bar chart with percentage analysis. This is a completely editable PowerPoint presentation and is available for immediate download. Download now and impress your audience.

Bar Chart With Percentage Representing Gross Revenue By Region Ppt PowerPoint Presentation File Topics PDF
Showcasing this set of slides titled bar chart with percentage representing gross revenue by region ppt powerpoint presentation file topics pdf. The topics addressed in these templates are bar chart with percentage representing gross revenue by region. All the content presented in this PPT design is completely editable. Download it and make adjustments in color, background, font etc. as per your unique business setting.

Bar Chart With Percentage Representing Sales Of Different Products Ppt PowerPoint Presentation Gallery Diagrams PDF
Showcasing this set of slides titled bar chart with percentage representing sales of different products ppt powerpoint presentation gallery diagrams pdf. The topics addressed in these templates are bar chart with percentage representing sales of different products. All the content presented in this PPT design is completely editable. Download it and make adjustments in color, background, font etc. as per your unique business setting.
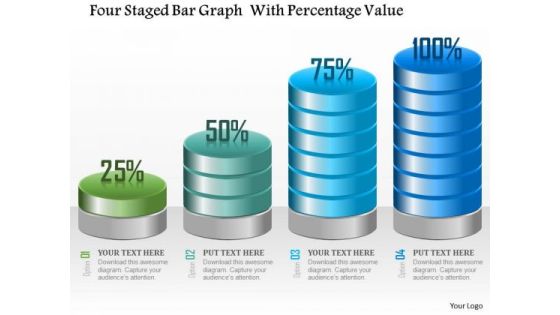
Business Diagram Four Staged Bar Graph With Percentage Value Presentation Template
Four staged bar graph with percentage value has been used to craft this power point template. This PPT contains the concept of making financial timeline and result analysis. This PPT can be used for business and finance related presentations.

3D Bar Chart For Percentage Values Comparison Ppt PowerPoint Presentation Professional Visual Aids
This is a 3d bar chart for percentage values comparison ppt powerpoint presentation professional visual aids. This is a five stage process. The stages in this process are art, colouring, paint brush.

Bar Chart With Percentage Of Healthcare Expenses In Different Countries Ppt PowerPoint Presentation Gallery Tips PDF
Pitch your topic with ease and precision using this bar chart with percentage of healthcare expenses in different countries ppt powerpoint presentation gallery tips pdf. This layout presents information on bar chart with percentage of healthcare expenses in different countries. It is also available for immediate download and adjustment. So, changes can be made in the color, design, graphics or any other component to create a unique layout.

Bar Chart With Percentage Representing Employee Job Satisfaction Ppt PowerPoint Presentation File Slide Download PDF
Pitch your topic with ease and precision using this bar chart with percentage representing employee job satisfaction ppt powerpoint presentation file slide download pdf. This layout presents information on bar chart with percentage representing employee job satisfaction. It is also available for immediate download and adjustment. So, changes can be made in the color, design, graphics or any other component to create a unique layout.

Bar Chart With Percentage For Employed Workers By Gender Ppt PowerPoint Presentation File Graphics Design PDF
Showcasing this set of slides titled bar chart with percentage for employed workers by gender ppt powerpoint presentation file graphics design pdf. The topics addressed in these templates are bar chart with percentage for employed workers by gender. All the content presented in this PPT design is completely editable. Download it and make adjustments in color, background, font etc. as per your unique business setting.

Bar Chart With Percentage Of Weekly Product Sales Ppt PowerPoint Presentation File Clipart Images PDF
Showcasing this set of slides titled bar chart with percentage of weekly product sales ppt powerpoint presentation file clipart images pdf. The topics addressed in these templates are . All the content presented in this PPT design is completely editable. Download it and make adjustments in color, background, font etc. as per your unique business setting.

Bar Chart With Percentage Representing Budget Allocation For Different Products Ppt PowerPoint Presentation File Samples PDF
Showcasing this set of slides titled bar chart with percentage representing budget allocation for different products ppt powerpoint presentation file samples pdf. The topics addressed in these templates arebar chart with percentage representing budget allocation for different products. All the content presented in this PPT design is completely editable. Download it and make adjustments in color, background, font etc. as per your unique business setting.
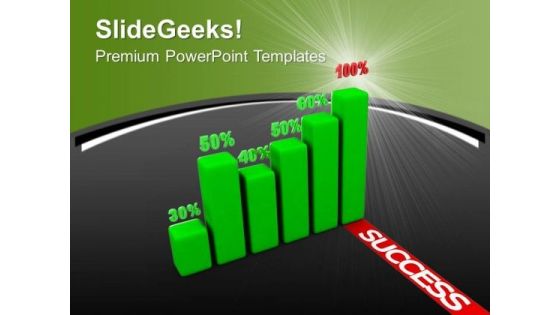
Green Bar Graph With Percentage Marketing PowerPoint Templates Ppt Backgrounds For Slides 0213
We present our Green Bar Graph With Percentage Marketing PowerPoint Templates PPT Backgrounds For Slides 0213.Download our Business PowerPoint Templates because Our PowerPoint Templates and Slides will steer your racing mind. Hit the right buttons and spur on your audience. Download our Finance PowerPoint Templates because Our PowerPoint Templates and Slides are focused like a searchlight beam. They highlight your ideas for your target audience. Download and present our Signs PowerPoint Templates because You can Be the star of the show with our PowerPoint Templates and Slides. Rock the stage with your ideas. Download our Shapes PowerPoint Templates because You can Stir your ideas in the cauldron of our PowerPoint Templates and Slides. Cast a magic spell on your audience. Present our Marketing PowerPoint Templates because You can Be the puppeteer with our PowerPoint Templates and Slides as your strings. Lead your team through the steps of your script.Use these PowerPoint slides for presentations relating to Business graph and percentage symbol, business, finance, signs, shapes, marketing. The prominent colors used in the PowerPoint template are Green, Red, White.

Bar Chart Segmentation Showing Percentage Business Analysis Ppt PowerPoint Presentation Portfolio Sample PDF
Presenting this set of slides with name bar chart segmentation showing percentage business analysis ppt powerpoint presentation portfolio sample pdf. The topics discussed in these slide is bar chart segmentation showing percentage business analysis. This is a completely editable PowerPoint presentation and is available for immediate download. Download now and impress your audience.

Horizontal Bar Graph With Profit Percentage Of Company Ppt PowerPoint Presentation Shapes
This is a horizontal bar graph with profit percentage of company ppt powerpoint presentation shapes. This is a five stage process. The stages in this process are business, strategy, marketing, analysis, slide bar, target.

Bar Chart For Facts Stats Growth And Percentage Analysis Ppt PowerPoint Presentation Styles Infographic Template
Presenting this set of slides with name bar chart for facts stats growth and percentage analysis ppt powerpoint presentation styles infographic template. This is a six stage process. The stages in this process are education, growth, pencil bar graph. This is a completely editable PowerPoint presentation and is available for immediate download. Download now and impress your audience.
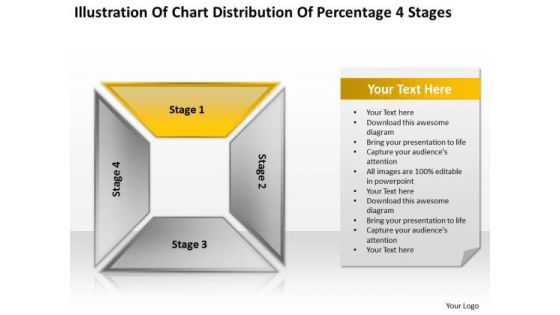
Chart Distribution Percentage 4 Stages Business Plan PowerPoint Templates
We present our chart distribution percentage 4 stages business plan PowerPoint templates.Use our Business PowerPoint Templates because Your audience will believe you are the cats whiskers. Download and present our Process and Flows PowerPoint Templates because Our PowerPoint Templates and Slides are focused like a searchlight beam. They highlight your ideas for your target audience. Use our Shapes PowerPoint Templates because They will bring a lot to the table. Their alluring flavours will make your audience salivate. Use our Success PowerPoint Templates because Our PowerPoint Templates and Slides ensures Effective communication. They help you put across your views with precision and clarity. Use our Marketing PowerPoint Templates because you should Experience excellence with our PowerPoint Templates and Slides. They will take your breath away.Use these PowerPoint slides for presentations relating to Shadow, square, rectangle, perspective, vector, template, shapes, graphic, multicolor, abstract, modern, box, illustration, geometric, backdrop, colors, design, architecture, shelves, backgrounds, banner, art, cabinet, space, wardrobe, structure, block. The prominent colors used in the PowerPoint template are Yellow, Gray, Black.

Success Percentage Graph Business PowerPoint Templates Ppt Backgrounds For Slides 1212
We present our Success Percentage Graph Business PowerPoint Templates PPT Backgrounds For Slides 1212.Download and present our Business PowerPoint Templates because you are ready to flap your wings and launch off. All poised are you to touch the sky with glory. Download our Success PowerPoint Templates because you have the ability to judge Which out of late have been proving to be a hassle. Download and present our Finance PowerPoint Templates because this diagram helps you to develop your marketing strategy and communicate your enthusiasm and motivation to raise the bar. Download and present our Marketing PowerPoint Templates because this template helps you to motivate each and every one of your group to give it his very best. Use our Signs PowerPoint Templates because our PowerPoint templates designed for your ideas to sell.Use these PowerPoint slides for presentations relating to Success bar graph, business, success, finance, marketing, signs. The prominent colors used in the PowerPoint template are Blue , Red, White. Customers tell us our Success Percentage Graph Business PowerPoint Templates PPT Backgrounds For Slides 1212 are Vintage. Presenters tell us our signs PowerPoint templates and PPT Slides are Breathtaking. Use our Success Percentage Graph Business PowerPoint Templates PPT Backgrounds For Slides 1212 are Ritzy. PowerPoint presentation experts tell us our marketing PowerPoint templates and PPT Slides will help them to explain complicated concepts. Customers tell us our Success Percentage Graph Business PowerPoint Templates PPT Backgrounds For Slides 1212 are Zippy. Presenters tell us our PowerPoint templates and PPT Slides are Handsome.

Bar Graph Ppt PowerPoint Presentation Ideas Display
This is a bar graph ppt powerpoint presentation ideas display. This is a two stage process. The stages in this process are product, sales in percentage, bar graph.
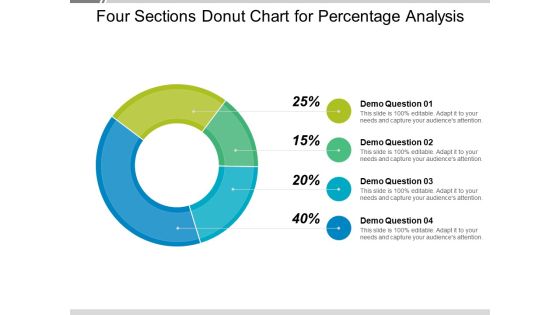
Four Sections Donut Chart For Percentage Analysis Ppt PowerPoint Presentation Styles Portrait PDF
Presenting this set of slides with name four sections donut chart for percentage analysis ppt powerpoint presentation styles portrait pdf. The topics discussed in these slide is four sections donut chart for percentage analysis. This is a completely editable PowerPoint presentation and is available for immediate download. Download now and impress your audience.
Eight Sections Pie Chart For Percentage Data Analysis Ppt PowerPoint Presentation Styles Icons
This is a eight sections pie chart for percentage data analysis ppt powerpoint presentation styles icons. This is a eight stage process. The stages in this process are 6 piece pie chart, 6 segment pie chart, 6 parts pie chart.
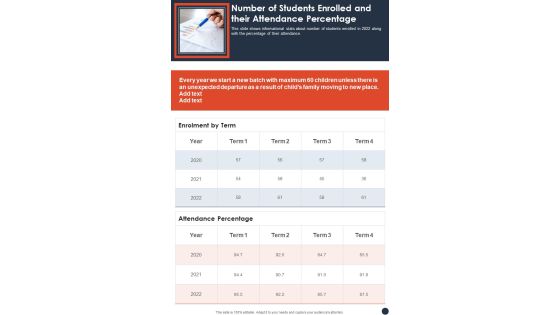
Number Of Students Enrolled And Their Attendance Percentage Template 75 One Pager Documents
This slide shows informational stats about number of students enrolled in 2022 along with the percentage of their attendance. Presenting you a fantastic Number Of Students Enrolled And Their Attendance Percentage Template 75 One Pager Documents. This piece is crafted on hours of research and professional design efforts to ensure you have the best resource. It is completely editable and its design allow you to rehash its elements to suit your needs. Get this Number Of Students Enrolled And Their Attendance Percentage Template 75 One Pager Documents A4 One-pager now.

Number Of Students Enrolled And Their Attendance Percentage One Pager Documents
Presenting you a fantastic Number Of Students Enrolled And Their Attendance Percentage One Pager Documents. This piece is crafted on hours of research and professional design efforts to ensure you have the best resource. It is completely editable and its design allow you to rehash its elements to suit your needs. Get this Number Of Students Enrolled And Their Attendance Percentage One Pager Documents A4 One-pager now.
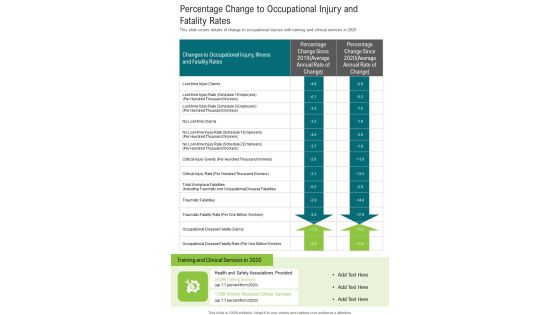
Percentage Change To Occupational Injury And Fatality Rates One Pager Documents
This slide covers details of change to occupational injuries with training and clinical services in 2020. Presenting you an exemplary Percentage Change To Occupational Injury And Fatality Rates One Pager Documents. Our one-pager comprises all the must-have essentials of an inclusive document. You can edit it with ease, as its layout is completely editable. With such freedom, you can tweak its design and other elements to your requirements. Download this Percentage Change To Occupational Injury And Fatality Rates One Pager Documents brilliant piece now.

Percentage Change To Occupational Injury And Fatality Rates Template 244 One Pager Documents
This slide covers details of change to occupational injuries with training and clinical services in 2022. Presenting you an exemplary Percentage Change To Occupational Injury And Fatality Rates Template 244 One Pager Documents. Our one-pager comprises all the must-have essentials of an inclusive document. You can edit it with ease, as its layout is completely editable. With such freedom, you can tweak its design and other elements to your requirements. Download this Percentage Change To Occupational Injury And Fatality Rates Template 244 One Pager Documents brilliant piece now.
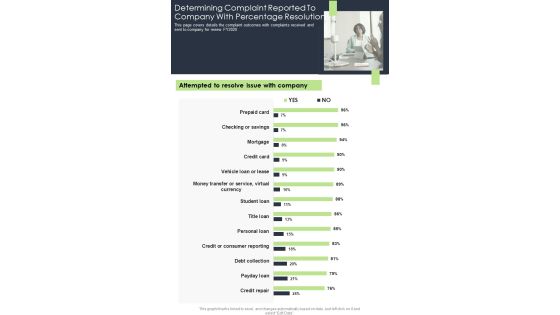
Determining Complaint Reported To Company With Percentage Resolution One Pager Documents
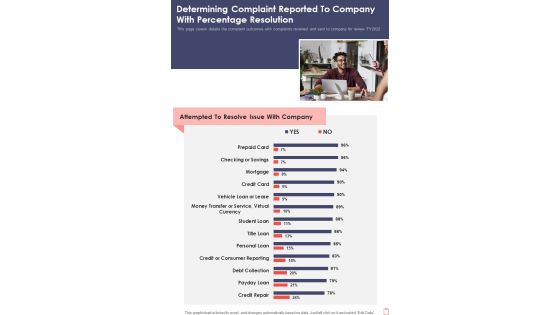
This page covers details the complaint outcomes with complaints received and sent to company for review FY2020. Presenting you a fantastic Determining Complaint Reported To Company With Percentage Resolution One Pager Documents. This piece is crafted on hours of research and professional design efforts to ensure you have the best resource. It is completely editable and its design allow you to rehash its elements to suit your needs. Get this Determining Complaint Reported To Company With Percentage Resolution One Pager Documents A4 One-pager now.
Determining Complaint Reported To Company With Percentage Resolution Template 292 One Pager Documents
This page covers details the complaint outcomes with complaints received and sent to company for review FY2022. Presenting you a fantastic Determining Complaint Reported To Company With Percentage Resolution Template 292 One Pager Documents. This piece is crafted on hours of research and professional design efforts to ensure you have the best resource. It is completely editable and its design allow you to rehash its elements to suit your needs. Get this Determining Complaint Reported To Company With Percentage Resolution Template 292 One Pager Documents A4 One-pager now.

Pie Chart With Percentage 80 20 Growth PowerPoint Templates Ppt Backgrounds For Slides 0213
We present our Pie Chart With Percentage 80 20 Growth PowerPoint Templates PPT Backgrounds For Slides 0213.Use our Business PowerPoint Templates because Our PowerPoint Templates and Slides will embellish your thoughts. See them provide the desired motivation to your team. Present our Marketing PowerPoint Templates because You canTake a leap off the starting blocks with our PowerPoint Templates and Slides. They will put you ahead of the competition in quick time. Download our Finance PowerPoint Templates because Our PowerPoint Templates and Slides will let you meet your Deadlines. Download our Circle Charts PowerPoint Templates because Our PowerPoint Templates and Slides will help you be quick off the draw. Just enter your specific text and see your points hit home. Use our Success PowerPoint Templates because Our PowerPoint Templates and Slides will generate and maintain the level of interest you desire. They will create the impression you want to imprint on your audience.Use these PowerPoint slides for presentations relating to 80-20 Rule Red, business, marketing, finance, circle charts, success. The prominent colors used in the PowerPoint template are Red, White, Black.
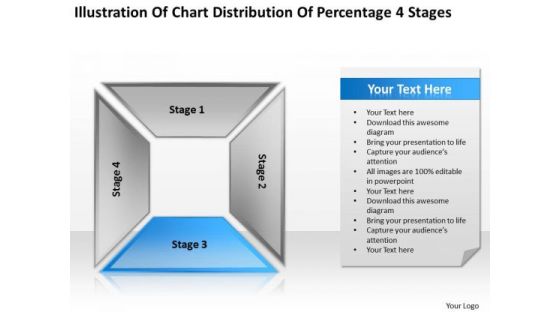
Chart Distribution Percentage 4 Stages How To Complete Business Plan PowerPoint Slides
We present our chart distribution percentage 4 stages how to complete business plan PowerPoint Slides.Use our Business PowerPoint Templates because Our PowerPoint Templates and Slides are topically designed to provide an attractive backdrop to any subject. Download and present our Process and Flows PowerPoint Templates because Our PowerPoint Templates and Slides are aesthetically designed to attract attention. We gaurantee that they will grab all the eyeballs you need. Use our Shapes PowerPoint Templates because Our PowerPoint Templates and Slides are specially created by a professional team with vast experience. They diligently strive to come up with the right vehicle for your brilliant Ideas. Present our Success PowerPoint Templates because Our PowerPoint Templates and Slides are the chords of your song. String them along and provide the lilt to your views. Download and present our Marketing PowerPoint Templates because Our PowerPoint Templates and Slides team portray an attitude of elegance. Personify this quality by using them regularly.Use these PowerPoint slides for presentations relating to Shadow, square, rectangle, perspective, vector, template, shapes, graphic, multicolor, abstract, modern, box, illustration, geometric, backdrop, colors, design, architecture, shelves, backgrounds, banner, art, cabinet, space, wardrobe, structure, block. The prominent colors used in the PowerPoint template are Blue, Black, Gray.
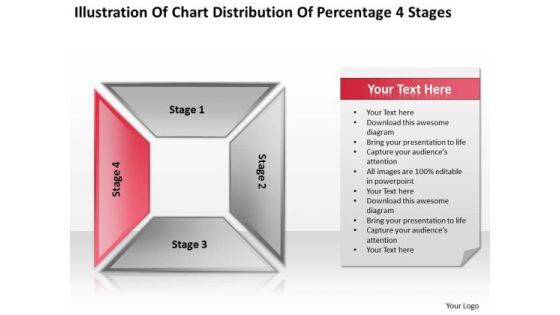
Chart Distribution Percentage 4 Stages Ppt Business Plan For PowerPoint Slides
We present our chart distribution percentage 4 stages ppt business plan for PowerPoint Slides.Download our Business PowerPoint Templates because You are working at that stage with an air of royalty. Let our PowerPoint Templates and Slides be the jewels in your crown. Use our Process and Flows PowerPoint Templates because Our PowerPoint Templates and Slides will give you great value for your money. Be assured of finding the best projection to highlight your words. Use our Shapes PowerPoint Templates because Our PowerPoint Templates and Slides will let you Clearly mark the path for others to follow. Present our Success PowerPoint Templates because Our PowerPoint Templates and Slides come in all colours, shades and hues. They help highlight every nuance of your views. Present our Marketing PowerPoint Templates because Our PowerPoint Templates and Slides will help you be quick off the draw. Just enter your specific text and see your points hit home.Use these PowerPoint slides for presentations relating to Shadow, square, rectangle, perspective, vector, template, shapes, graphic, multicolor, abstract, modern, box, illustration, geometric, backdrop, colors, design, architecture, shelves, backgrounds, banner, art, cabinet, space, wardrobe, structure, block. The prominent colors used in the PowerPoint template are Red, Black, Gray.
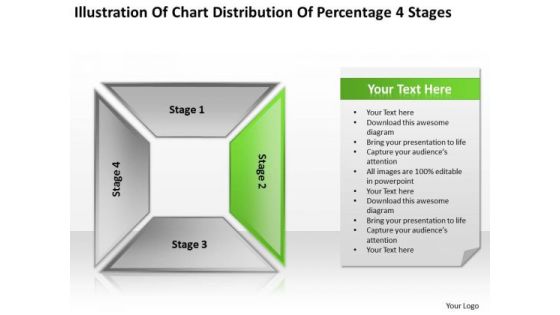
Chart Distribution Percentage 4 Stages Ppt Small Business Plan Sample PowerPoint Templates
We present our chart distribution percentage 4 stages ppt small business plan sample PowerPoint templates.Present our Business PowerPoint Templates because You should Kick up a storm with our PowerPoint Templates and Slides. The heads of your listeners will swirl with your ideas. Use our Process and Flows PowerPoint Templates because It can Leverage your style with our PowerPoint Templates and Slides. Charm your audience with your ability. Download and present our Shapes PowerPoint Templates because Our PowerPoint Templates and Slides will help you be quick off the draw. Just enter your specific text and see your points hit home. Present our Success PowerPoint Templates because Our PowerPoint Templates and Slides are Clear and concise. Use them and dispel any doubts your team may have. Download and present our Marketing PowerPoint Templates because These PowerPoint Templates and Slides will give the updraft to your ideas. See them soar to great heights with ease.Use these PowerPoint slides for presentations relating to Shadow, square, rectangle, perspective, vector, template, shapes, graphic, multicolor, abstract, modern, box, illustration, geometric, backdrop, colors, design, architecture, shelves, backgrounds, banner, art, cabinet, space, wardrobe, structure, block. The prominent colors used in the PowerPoint template are Green, Gray, Black.

Bar Graph Ppt PowerPoint Presentation File Vector
This is a bar graph ppt powerpoint presentation file vector. This is a four stage process. The stages in this process are in percentage, bar graph, growth, business, process.

Bar Diagram Ppt PowerPoint Presentation Gallery Structure
This is a bar diagram ppt powerpoint presentation gallery structure. This is a three stage process. The stages in this process are financial in years, sales in percentage, bar graph, growth, success.

Bar Graph Ppt PowerPoint Presentation File Slides
This is a bar graph ppt powerpoint presentation file slides. This is a three stage process. The stages in this process are product, sales in percentage, bar graph, growth, success.

Bar Graph Ppt PowerPoint Presentation Gallery Skills
This is a bar graph ppt powerpoint presentation gallery skills. This is a four stage process. The stages in this process are in percentage, bar graph, business, marketing, product.

Bar Chart Ppt PowerPoint Presentation Inspiration Outfit
This is a bar chart ppt powerpoint presentation inspiration outfit. This is a three stage process. The stages in this process are percentage, product, bar chart, marketing.

Bar Graph Ppt PowerPoint Presentation Model Clipart
This is a bar graph ppt powerpoint presentation model clipart. This is a six stage process. The stages in this process are sales in percentage, product, bar graph, business, marketing.

Bar Graph Ppt PowerPoint Presentation Outline Layout
This is a bar graph ppt powerpoint presentation outline layout. This is a four stage process. The stages in this process are sales in percentage, product, bar graph, business, marketing.

Bar Graph Ppt PowerPoint Presentation Information
This is a bar graph ppt powerpoint presentation information. This is a five stage process. The stages in this process are finance, percentage, success, growth, bar graph.
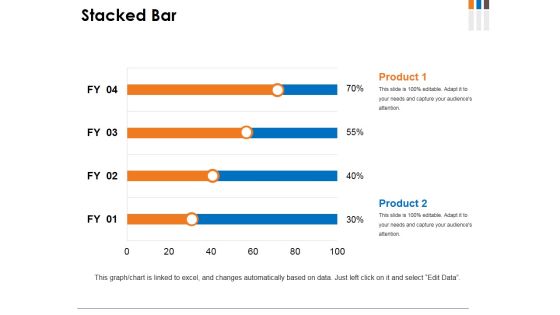
Stacked Bar Ppt PowerPoint Presentation Infographics Styles
This is a stacked bar ppt powerpoint presentation infographics styles. This is a two stage process. The stages in this process are product, staked bar, percentage, finance, step.

Stacked Bar Ppt PowerPoint Presentation Inspiration Model
This is a stacked bar ppt powerpoint presentation inspiration model. This is a two stage process. The stages in this process are product, stacked bar, percentage, finance, business.

Stacked Bar Ppt PowerPoint Presentation Layouts Good
This is a stacked bar ppt powerpoint presentation layouts good. This is a two stage process. The stages in this process are product, finance, percentage, step, stacked bar.

Bar Chart Ppt PowerPoint Presentation Portfolio Slides
This is a bar chart ppt powerpoint presentation portfolio slides. This is a one stage process. The stages in this process are product, percentage, marketing, business, bar chart.

Bar Chart Ppt PowerPoint Presentation Icon Design Templates
This is a bar chart ppt powerpoint presentation icon design templates. This is a nine stage process. The stages in this process are sales in percentage, bar graph, business, marketing, growth.

Bar Chart Ppt PowerPoint Presentation Ideas Graphic Tips
This is a bar chart ppt powerpoint presentation ideas graphic tips. This is a seven stage process. The stages in this process are sales in percentage, bar chart, growth, business, marketing.

Bar Diagram Ppt PowerPoint Presentation Pictures Background Image
This is a bar diagram ppt powerpoint presentation pictures background image. This is a three stage process. The stages in this process are financial in years, sales in percentage, bar graph, growth, success.

Bar Graph Ppt PowerPoint Presentation Portfolio Slide Portrait
This is a bar graph ppt powerpoint presentation portfolio slide portrait. This is a three stage process. The stages in this process are product, sales in percentage, bar graph, growth, success.

Bar Graph Ppt PowerPoint Presentation Slides Visual Aids
This is a bar graph ppt powerpoint presentation slides visual aids. This is a three stage process. The stages in this process are sales in percentage, bar graph, business, marketing, success.

Stacked Bar Ppt PowerPoint Presentation Slides Templates
This is a stacked bar ppt powerpoint presentation slides templates. This is a two stage process. The stages in this process are stacked bar, product, percentage, finance, business.

Stacked Bar Ppt PowerPoint Presentation Styles Ideas
This is a stacked bar ppt powerpoint presentation styles ideas. This is a two stage process. The stages in this process are stacked bar, product, percentage, year, business.

Bar Chart Ppt PowerPoint Presentation Icon Information
This is a bar chart ppt powerpoint presentation icon information. This is a one stage process. The stages in this process are product, sales in percentage, financial years, bar graph, growth.

Bar Chart Ppt PowerPoint Presentation Icon Layout
This is a bar chart ppt powerpoint presentation icon layout. This is a one stage process. The stages in this process are sales in percentage, financial years, bar chart, finance, marketing.

Bar Chart Ppt PowerPoint Presentation Model Picture
This is a bar chart ppt powerpoint presentation model picture. This is a two stage process. The stages in this process are product, sales in percentage, financial years, bar chart.

Bar Graph For Statistical Analysis Powerpoint Slides
This PowerPoint template has been designed with bar chart and percentage values. You may download this PPT slide to depict statistical analysis. Add this slide to your presentation and impress your superiors.

Clustered Bar Ppt PowerPoint Presentation Layouts Professional
This is a clustered bar ppt powerpoint presentation layouts professional. This is a two stage process. The stages in this process are clustered bar, product, profit, percentage.

Bar Chart Ppt PowerPoint Presentation Outline Backgrounds
This is a bar chart ppt powerpoint presentation outline backgrounds. This is a one stage process. The stages in this process are sales in percentage, financial years, product, bar graph, finance.

Clustered Bar Ppt PowerPoint Presentation Inspiration
This is a clustered bar ppt powerpoint presentation inspiration. This is a five stage process. The stages in this process are bar graph, business, marketing, finance, percentage.
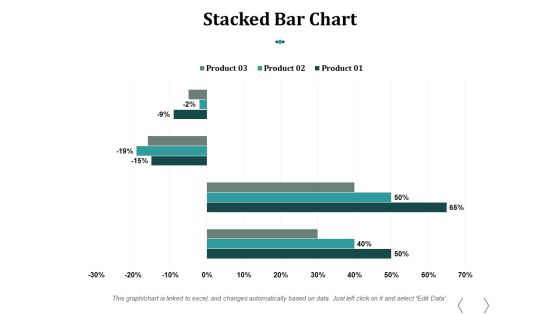
Stacked Bar Chart Ppt PowerPoint Presentation Influencers
This is a stacked bar chart ppt powerpoint presentation influencers. This is a three stage process. The stages in this process are stacked bar chart, product, percentage, finance, business.

Bar Graph Ppt PowerPoint Presentation Good
This is a bar graph ppt powerpoint presentation good. This is a four stage process. The stages in this process are bar graph, growth, business, marketing, management, percentage.

Bar Graph Ppt PowerPoint Presentation Layouts Influencers
This is a bar graph ppt powerpoint presentation layouts influencers. This is a two stage process. The stages in this process are business, marketing, in bar graph, sales in percentage, finance.

Bar Chart Ppt PowerPoint Presentation Professional Files
This is a bar chart ppt powerpoint presentation professional files. This is a seven stage process. The stages in this process are bar chart, product, sales in percentage, financial years.

Bar Chart Ppt PowerPoint Presentation Layouts Pictures
This is a bar chart ppt powerpoint presentation layouts pictures. This is a three stage process. The stages in this process are bar graph, product, sales in percentage, business, marketing.

Bar Graph Ppt PowerPoint Presentation Summary Format
This is a bar graph ppt powerpoint presentation summary format. This is a three stage process. The stages in this process are bar graph, business, marketing, years, percentage, finance.

Bar Chart Ppt PowerPoint Presentation Inspiration Demonstration
This is a bar chart ppt powerpoint presentation inspiration demonstration. This is a two stage process. The stages in this process are bar chart, financial years, sales in percentage, product, finance.

Bar Graph Ppt PowerPoint Presentation Styles Skills
This is a bar graph ppt powerpoint presentation styles skills. This is a two stage process. The stages in this process are bar graph, product, in year, in percentage, business.

Bar Graph Ppt PowerPoint Presentation Ideas Graphic Tips
This is a bar graph ppt powerpoint presentation ideas graphic tips. This is a three stage process. The stages in this process are financial year, sales in percentage, product, bar graph, growth.
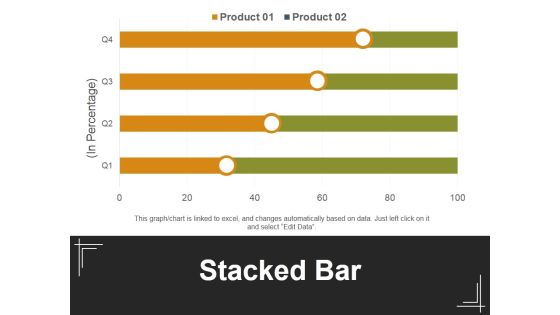
Stacked Bar Template 1 Ppt PowerPoint Presentation Inspiration Background Designs
This is a stacked bar template 1 ppt powerpoint presentation inspiration background designs. This is a four stage process. The stages in this process are in percentage, stacked bar, product, business, marketing.
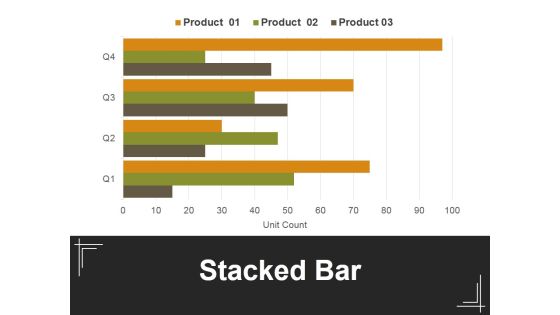
Stacked Bar Template 2 Ppt PowerPoint Presentation Professional Example
This is a stacked bar template 2 ppt powerpoint presentation professional example. This is a four stage process. The stages in this process are in percentage, stacked bar, product, business, marketing.
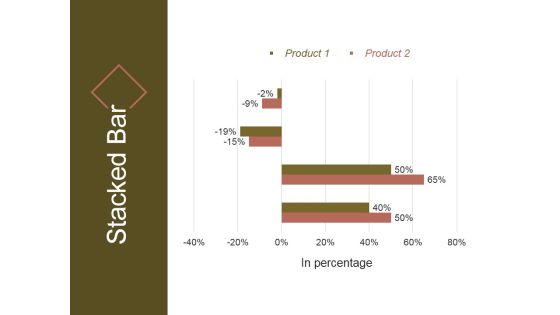
Stacked Bar Template 2 Ppt PowerPoint Presentation Pictures
This is a stacked bar template 2 ppt powerpoint presentation pictures. This is a four stage process. The stages in this process are in percentage, product, stacked bar.
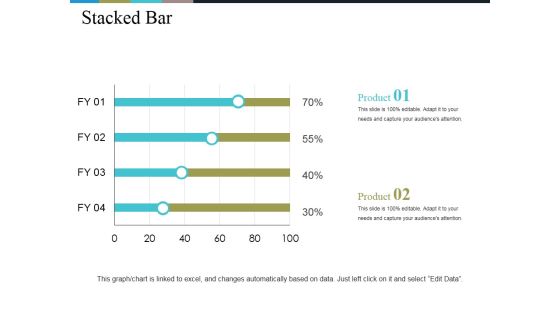
Stacked Bar Ppt PowerPoint Presentation Gallery Example Introduction
This is a stacked bar ppt powerpoint presentation gallery example introduction. This is a two stage process. The stages in this process are bar, percentage, business, marketing, finance.
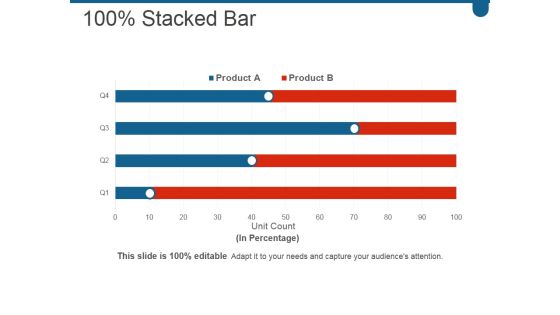
Stacked Bar Ppt PowerPoint Presentation File Graphics Example
This is a stacked bar ppt powerpoint presentation file graphics example. This is a four stage process. The stages in this process are business, marketing, bar, graph, percentage.

Bar Chart Ppt PowerPoint Presentation Infographic Template Picture
This is a bar chart ppt powerpoint presentation infographic template picture. This is a two stage process. The stages in this process are financial, in percentage, business, marketing, bar chart.
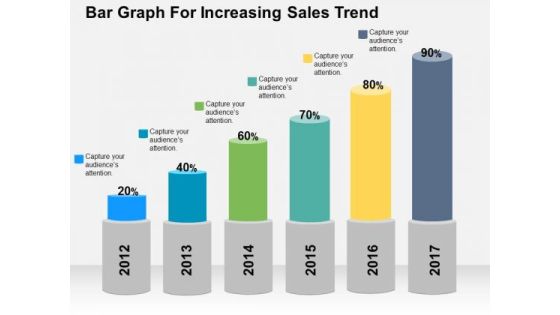
Bar Graph For Increasing Sales Trend PowerPoint Template
Deliver amazing presentations with our above template showing bar graph with percentage values. You may download this slide to depict increase in sales trends. Capture the attention of your audience using this diagram.

Bar Graph For Profit Growth Analysis Powerpoint Slides
This PowerPoint template has been designed with bar graph with percentage values. This diagram is useful to exhibit profit growth analysis. This diagram slide can be used to make impressive presentations.

Bar Graph With Yearly Statistical Analysis Powerpoint Slides
This PowerPoint template contains diagram of bar graph with yearly percentage ratios. You may download this slide to display statistical analysis. You can easily customize this template to make it more unique as per your need.
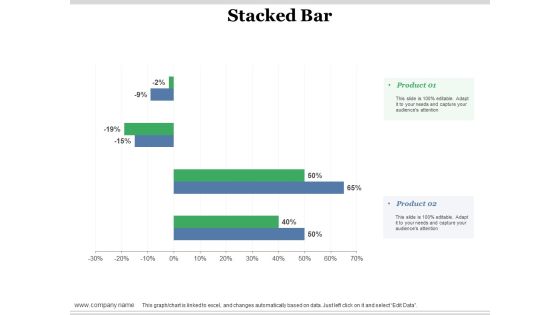
Stacked Bar Ppt PowerPoint Presentation Slides Layout Ideas
This is a stacked bar ppt powerpoint presentation slides layout ideas. This is a two stage process. The stages in this process are stacked bar, product, percentage, finance, business.

Bar Chart Ppt PowerPoint Presentation File Slide
This is a bar chart ppt powerpoint presentation file slide. This is a one stage process. The stages in this process are sales in percentage financial years, business, marketing, strategy, graph.

Clustered Bar Finance Ppt Powerpoint Presentation Ideas Themes
This is a clustered bar finance ppt powerpoint presentation ideas themes. This is a three stage process. The stages in this process are clustered bar, product, in percentage, years, profit.

Bar Chart Ppt PowerPoint Presentation Slides Design Ideas
This is a bar chart ppt powerpoint presentation slides design ideas. This is a six stage process. The stages in this process are product, bar chart, sales in percentage.

Bar Graph Ppt PowerPoint Presentation Infographic Template Template
This is a bar graph ppt powerpoint presentation infographic template template. This is a three stage process. The stages in this process are bar graph, sales in percentage, product, planning, business.

Bar Graph Ppt PowerPoint Presentation Infographic Template Demonstration
This is a bar graph ppt powerpoint presentation infographic template demonstration. This is a two stage process. The stages in this process are bar graph, product, sales, percentage, financial.
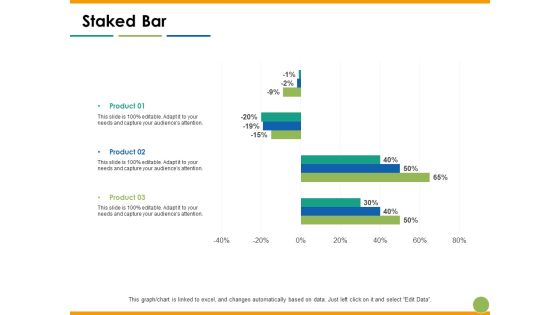
Staked Bar Capability Maturity Matrix Ppt PowerPoint Presentation Slides Outfit
This is a staked bar capability maturity matrix ppt powerpoint presentation slides outfit. This is a three stage process. The stages in this process are staked bar, product, year, finance, percentage.

Bar Chart Ppt PowerPoint Presentation Model Sample
This is a bar chart ppt powerpoint presentation model sample. This is a two stage process. The stages in this process are sales in percentage, business, marketing, graph, percentage, year.

Bar Graph Ppt PowerPoint Presentation Deck
This is a bar graph ppt powerpoint presentation deck. This is a five stage process. The stages in this process are percentage, process, strategy, success, marketing.

Bar Graph Ppt PowerPoint Presentation Pictures Display
This is a bar graph ppt powerpoint presentation pictures display. This is a one stage process. The stages in this process are sales in percentage, financial year.

Bar Chart Ppt PowerPoint Presentation Ideas
This is a bar chart ppt powerpoint presentation ideas. This is a nine stage process. The stages in this process are graph, in percentage, growth, business, marketing.

Bar Chart Ppt PowerPoint Presentation Styles
This is a bar chart ppt powerpoint presentation styles. This is a nine stage process. The stages in this process are business, management, sales in percentage, growth.

Bar Graph Ppt PowerPoint Presentation Layouts Gridlines
This is a bar graph ppt powerpoint presentation layouts gridlines. this is a three stage process. The stages in this process are product, percentage, business, marketing, management.

Bar Chart Ppt PowerPoint Presentation Microsoft
This is a bar chart ppt powerpoint presentation microsoft. This is a eleven stage process. The stages in this process are sales in percentage, fy, graph, success, business.

Bar Graph Ppt PowerPoint Presentation Layouts Pictures
This is a bar graph ppt powerpoint presentation layouts pictures. This is a four stage process. The stages in this process are fire, earthquake, axis title, in percentage.

Bar Graph Ppt PowerPoint Presentation Gallery Inspiration
This is a bar graph ppt powerpoint presentation gallery inspiration. This is a three stage process. The stages in this process are product, sales in percentage, finance, success.

Clustered Bar Ppt PowerPoint Presentation Professional Objects
This is a clustered bar ppt powerpoint presentation professional objects. This is a three stage process. The stages in this process are product, in percentage, finance, business, marketing.
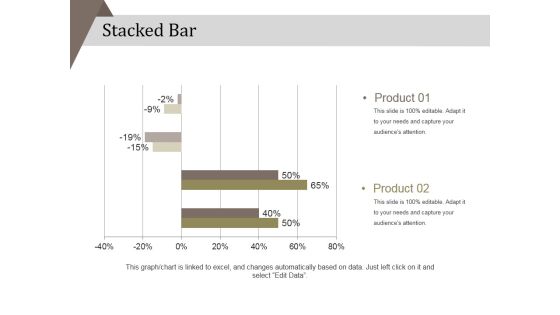
Stacked Bar Ppt PowerPoint Presentation Infographics Inspiration
This is a stacked bar ppt powerpoint presentation infographics inspiration. This is a two stage process. The stages in this process are product, percentage, finance, business, marketing.

Bar Graph Ppt PowerPoint Presentation Outline Structure
This is a bar graph ppt powerpoint presentation outline structure. This is a three stage process. The stages in this process are product, percentage, finance, business.

Clustered Bar Ppt PowerPoint Presentation Model Slides
This is a clustered bar ppt powerpoint presentation model slides. This is a two stage process. The stages in this process are product, profit, business, finance, percentage.
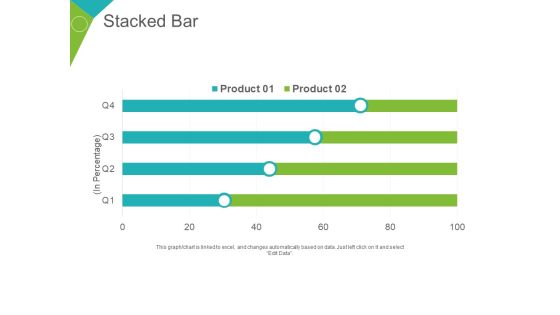
Stacked Bar Ppt PowerPoint Presentation Summary Portfolio
This is a stacked bar ppt powerpoint presentation summary portfolio. This is a two stage process. The stages in this process are product, business, planning, marketing, in percentage.
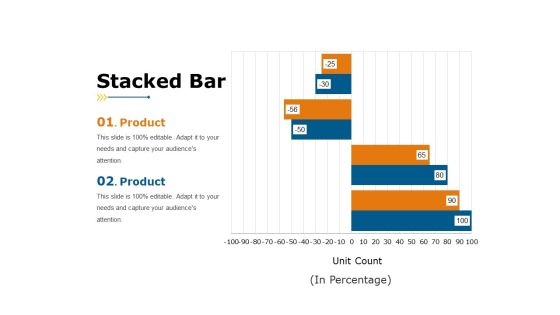
Stacked Bar Ppt PowerPoint Presentation File Sample
This is a stacked bar ppt powerpoint presentation file sample. This is a two stage process. The stages in this process are in percentage, finance, business, marketing, graph.

Stacked Bar Ppt PowerPoint Presentation Pictures Graphics
This is a stacked bar ppt powerpoint presentation pictures graphics. This is a three stage process. The stages in this process are product, percentage, business, marketing, finance.

Bar Chart Ppt PowerPoint Presentation Pictures Inspiration
This is a bar chart ppt powerpoint presentation pictures inspiration. This is a seven stage process. The stages in this process are in percentage, business, marketing, finance, graph.

Bar Chart Ppt PowerPoint Presentation Summary Pictures
This is a bar chart ppt powerpoint presentation summary pictures. This is a four stage process. The stages in this process are product, unit count, finance, percentage, business.

Bar Graph Ppt PowerPoint Presentation Ideas Show
This is a bar graph ppt powerpoint presentation ideas show. This is a three stage process. The stages in this process are product, percentage, business, year, graph.

Stacked Bar Ppt PowerPoint Presentation Layouts Inspiration
This is a stacked bar ppt powerpoint presentation layouts inspiration. This is a four stage process. The stages in this process are finance, business, marketing, percentage, graph.
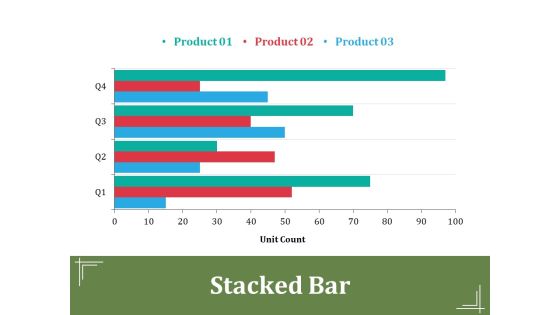
Stacked Bar Ppt PowerPoint Presentation Outline Layout
This is a stacked bar ppt powerpoint presentation outline layout. This is a two stage process. The stages in this process are in percentage, business, marketing, strategy, finance.
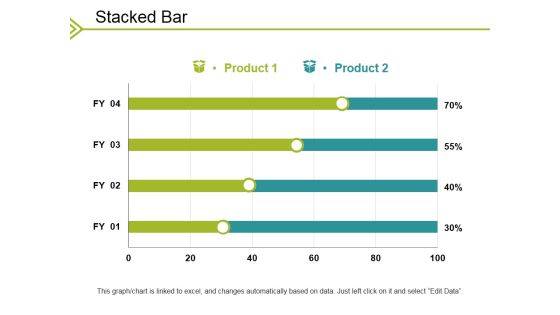
Stacked Bar Ppt PowerPoint Presentation File Outfit
This is a stacked bar ppt powerpoint presentation file outfit. This is a two stage process. The stages in this process are business, in percentage, marketing, strategy, graph.

Bar Chart Ppt PowerPoint Presentation Portfolio Inspiration
This is a bar chart ppt powerpoint presentation portfolio inspiration. This is a two stage process. The stages in this process are product, in percentage, in years.

Bar Graph Ppt PowerPoint Presentation Inspiration Slides
This is a bar graph ppt powerpoint presentation inspiration slides. This is a six stage process. The stages in this process are sales in percentage, financial year, product.

Bar Graph Ppt PowerPoint Presentation Infographics Templates
This is a bar graph ppt powerpoint presentation infographics templates. This is a two stage process. The stages in this process are product, financial years, sales in percentage.

Clustered Bar Ppt PowerPoint Presentation Inspiration Backgrounds
This is a clustered bar ppt powerpoint presentation inspiration backgrounds. This is a three stage process. The stages in this process are product, percentage, marketing, business.
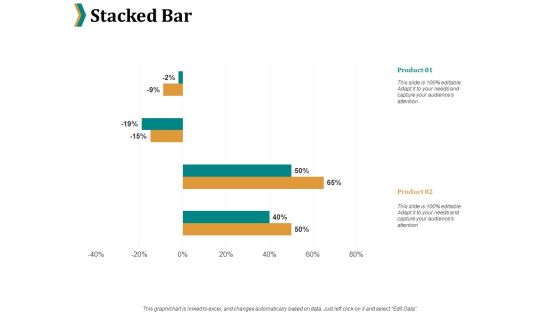
Stacked Bar Ppt PowerPoint Presentation Ideas
This is a stacked bar ppt powerpoint presentation ideas. This is a two stage process. The stages in this process are product, percentage, marketing, business.
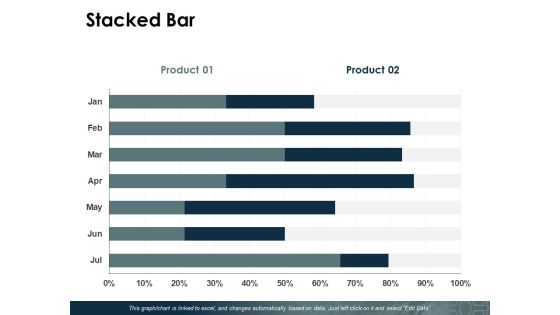
Stacked Bar Ppt PowerPoint Presentation Ideas Themes
This is a stacked bar ppt powerpoint presentation ideas themes. This is a two stage process. The stages in this process are product, percentage, management, marketing.

Stacked Bar Ppt PowerPoint Presentation Ideas Maker
This is a stacked bar ppt powerpoint presentation ideas maker. This is a two stage process. The stages in this process are percentage, product, business, management.

Bar Chart Ppt PowerPoint Presentation Professional Examples
This is a bar chart ppt powerpoint presentation professional examples. This is a four stage process. The stages in this process are percentage, marketing, management, product.

Bar Chart Ppt PowerPoint Presentation Show Deck
This is a bar chart ppt powerpoint presentation show deck. This is a two stage process. The stages in this process are percentage, product, business, marketing.

Clustered Bar Ppt PowerPoint Presentation Summary Elements
This is a clustered bar ppt powerpoint presentation summary elements. This is a two stage process. The stages in this process are percentage, product, business, marketing.

Stacked Bar Ppt PowerPoint Presentation Ideas Portfolio
This is a stacked bar ppt powerpoint presentation ideas portfolio. This is a three stage process. The stages in this process are percentage, product, management, marketing.

Clustered Bar Ppt PowerPoint Presentation Professional Guide
This is a clustered bar ppt powerpoint presentation professional guide. This is a three stage process. The stages in this process are percentage, product, business, management, marketing.

Bar Graph Ppt PowerPoint Presentation Introduction
This is a bar graph ppt powerpoint presentation introduction. This is a eleven stage process. The stages in this process are management, marketing, business, fy, graph, sales in percentage.

Bar Graph Ppt PowerPoint Presentation Slides Deck
This is a bar graph ppt powerpoint presentation slides deck. This is a three stage process. The stages in this process are financial in years, product, sales in percentage.
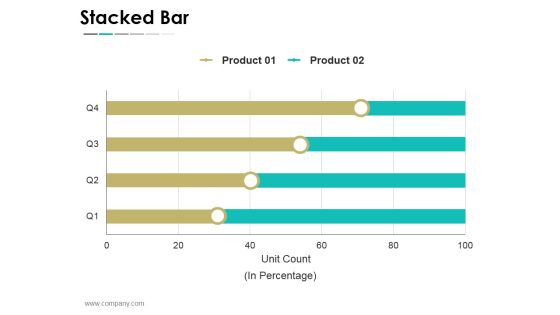
Stacked Bar Ppt PowerPoint Presentation Infographics Graphics
This is a stacked bar ppt powerpoint presentation infographics graphics. This is a four stage process. The stages in this process are business, strategy, marketing, success, unit count, in percentage.

Bar Chart Ppt PowerPoint Presentation Portfolio Icons
This is a bar chart ppt powerpoint presentation portfolio icons. This is a seven stage process. The stages in this process are in years, in percentage, finance, business marketing.

Bar Graph Ppt PowerPoint Presentation Portfolio Example
This is a bar graph ppt powerpoint presentation portfolio example. This is a three stage process. The stages in this process are sales in percentage, year, business, product, business, graph.

Bar Chart Ppt PowerPoint Presentation Outline Introduction
This is a bar chart ppt powerpoint presentation outline introduction. This is a one stage process. The stages in this process are sales in percentage, product, business, financial years, graph.

Bar Graph Ppt PowerPoint Presentation Gallery Grid
This is a bar graph ppt powerpoint presentation gallery grid. This is a three stage process. The stages in this process are sales in percentage, product, finance, business, marketing.

Bar Chart Ppt PowerPoint Presentation Styles Outfit
This is a bar chart ppt powerpoint presentation styles outfit. This is a Seven stage process. The stages in this process are sales in percentage, financial years, graph, business.

Bar Chart Ppt PowerPoint Presentation Icon Demonstration
This is a bar chart ppt powerpoint presentation icon demonstration. This is a seven stage process. The stages in this process are product, sales in percentage, financial year, graph.

Bar Chart Ppt PowerPoint Presentation Portfolio Diagrams
This is a bar chart ppt powerpoint presentation portfolio diagrams. This is a three stage process. The stages in this process are sales in percentage, business, marketing, graph, finance.

Bar Chart Ppt PowerPoint Presentation Icon Introduction
This is a bar chart ppt powerpoint presentation icon introduction. This is a seven stage process. The stages in this process are in years, in percentage, business, marketing, graph.

Bar Chart Ppt PowerPoint Presentation Diagram Lists
This is a bar chart ppt powerpoint presentation diagram lists. This is a two stage process. The stages in this process are business, marketing, financial years, sales in percentage, graph.

Bar Chart Ppt PowerPoint Presentation Ideas Deck
This is a bar chart ppt powerpoint presentation ideas deck. This is a two stage process. The stages in this process are product, in percentage, in years, financial, business.

Bar Chart Ppt PowerPoint Presentation Summary Themes
This is a bar chart ppt powerpoint presentation summary themes. This is a three stage process. The stages in this process are financial years, sales in percentage, business, marketing, graph.

Bar Chart Ppt PowerPoint Presentation Layouts Template
This is a bar chart ppt powerpoint presentation layouts template. This is a two stage process. The stages in this process are financial year, sales in percentage, business, marketing, finance.

Bar Graph Ppt PowerPoint Presentation Infographics Icon
This is a bar graph ppt powerpoint presentation infographics icon. This is a two stage process. The stages in this process are business, marketing, financial year, in percentage, graph.
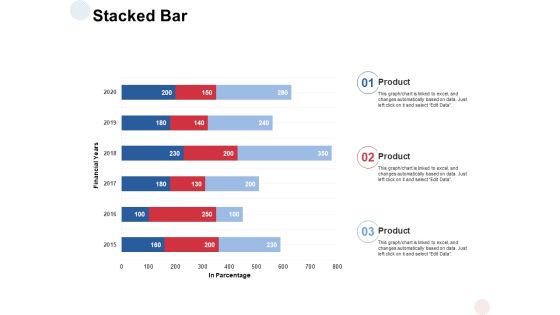
Stacked Bar Analysis Ppt PowerPoint Presentation Styles Graphics Template
Presenting this set of slides with name stacked bar analysis ppt powerpoint presentation styles graphics template. The topics discussed in these slides are stacked bar, financial years, percentage. This is a completely editable PowerPoint presentation and is available for immediate download. Download now and impress your audience.

Bar Chart Ppt PowerPoint Presentation Infographics Format Ideas
This is a bar chart ppt powerpoint presentation infographics format ideas. This is a two stage process. The stages in this process are bar graph, product, financial year, sales in percentage.
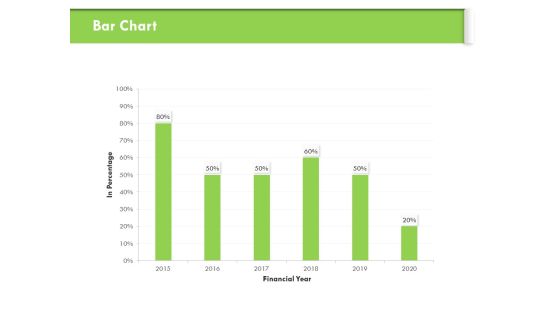
Understanding Organizational Structures Bar Chart Ppt Professional Visuals PDF
Presenting this set of slides with name understanding organizational structures bar chart ppt professional visuals pdf. The topics discussed in these slides are bar chart, financial year, percentage. This is a completely editable PowerPoint presentation and is available for immediate download. Download now and impress your audience.
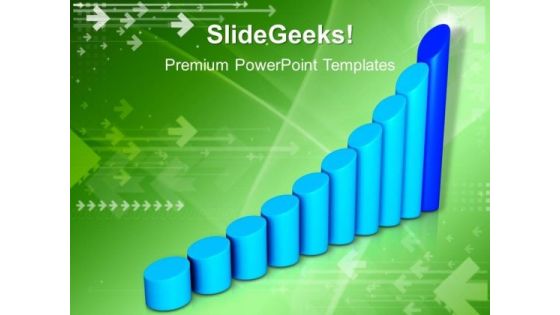
Bar Graph Business PowerPoint Templates And PowerPoint Themes 1012
Bar Graph Business PowerPoint Templates And PowerPoint Themes 1012-This PowerPoint Template shows the Bar Graph with increasing percentage which signifies the Financial Growth. The Template signifies the concept of business growth. The structure of our templates allows you to effectively highlight the key issues concerning the growth of your business. Our PPT images are so ideally designed that it reveals the very basis of our PPT template are an effective tool to make your clients understand.-Bar Graph Business PowerPoint Templates And PowerPoint Themes 1012-This PowerPoint template can be used for presentations relating to-Financial bar graph chart, technology, money, business, finance, marketing

Stacked Bar Analysis Ppt PowerPoint Presentation Gallery Outline
Presenting this set of slides with name stacked bar analysis ppt powerpoint presentation gallery outline. The topics discussed in these slides are stacked bar, financial year, sales in percentage. This is a completely editable PowerPoint presentation and is available for immediate download. Download now and impress your audience.
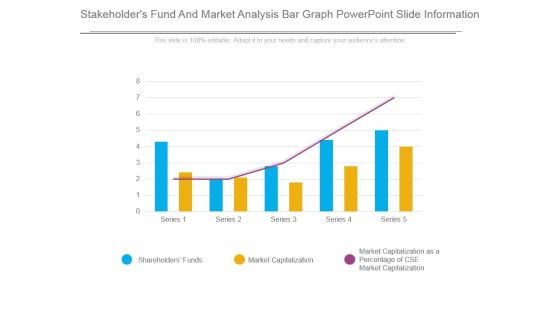
Stakeholders Fund And Market Analysis Bar Graph Powerpoint Slide Information
This is a stakeholders fund and market analysis bar graph powerpoint slide information. This is a five stage process. The stages in this process are shareholders funds, market capitalization, market capitalization as a percentage of cse market capitalization.

Business Diagram Business Bar Graph For Data Analysis Presentation Template
This business slide displays pie charts with percentage ratios. This diagram is a data visualization tool that gives you a simple way to present statistical information. This slide helps your audience examines and interprets the data you present.

Bar Graph To Compare Business Data PowerPoint Slides
This is the slide which can solve many purposes of yours. Be it growth in your company, need to show your company?s status in the market as compared to others, or how your business has improved so far. An ideal PowerPoint template to display all of these. You can easily use this graph to show the growth of your company using the percentage icons. You can use this visual to show the status of your company in the market in comparison with others. You can edit the icons and replace them with the logo of your company and the others. You can also show it to your colleagues how your company has built its image in the market or how it has improved over the time. A perfect bar graph image which needs to be included in your business PPT presentations.

Overall Revenue Analysis Bar Chart Powerpoint Slide Information
This is a overall revenue analysis bar chart powerpoint slide information. This is a nine stage process. The stages in this process are finance, success, business, marketing, percentage.
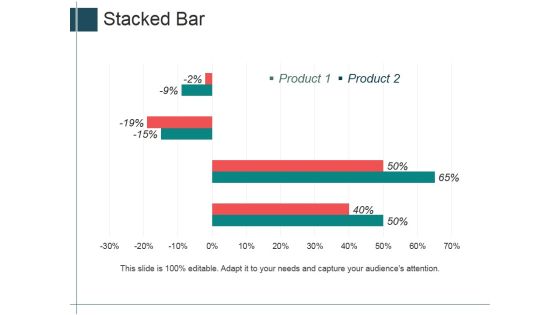
Stacked Bar Ppt PowerPoint Presentation Styles Designs Download
This is a stacked bar ppt powerpoint presentation styles designs download. This is a four stage process. The stages in this process are product, finance, percentage, business.

Bar Chart Ppt PowerPoint Presentation Infographic Template Example
This is a bar chart ppt powerpoint presentation infographic template example. This is a seven stage process. The stages in this process are business, finance, marketing, percentage.
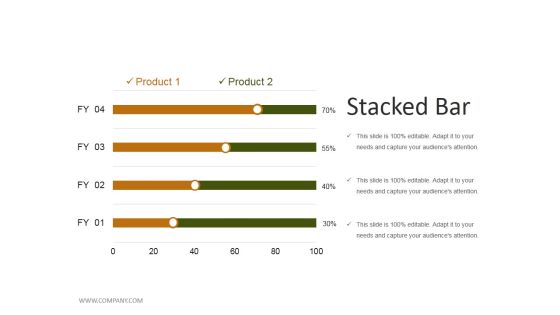
Stacked Bar Ppt PowerPoint Presentation Gallery File Formats
This is a stacked bar ppt powerpoint presentation gallery file formats. This is a four stage process. The stages in this process are finance, product, percentage, business, marketing.

Bar Graph Ppt PowerPoint Presentation Styles File Formats
This is a bar graph ppt powerpoint presentation styles file formats. This is a four stage process. The stages in this process are percentage, business, marketing, finance, strategy.

Bar Chart Ppt PowerPoint Presentation Show Example File
This is a bar chart ppt powerpoint presentation show example file. This is a two stage process. The stages in this process are product, business, marketing, graph, percentage.
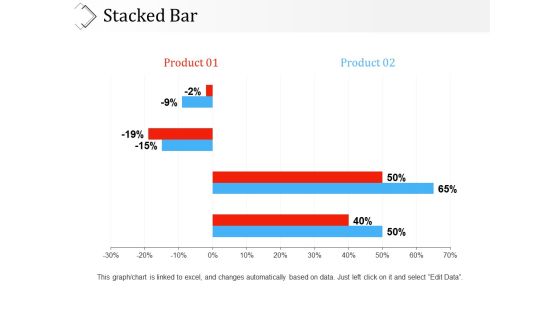
Stacked Bar Ppt PowerPoint Presentation Infographic Template Clipart
This is a stacked bar ppt powerpoint presentation infographic template clipart. This is a two stage process. The stages in this process are product, percentage, business, marketing, graph.
Stacked Bar Ppt PowerPoint Presentation Icon Background Image
This is a stacked bar ppt powerpoint presentation icon background image. This is a four stage process. The stages in this process are product, percentage, finance, business, marketing.

Stacked Bar Ppt PowerPoint Presentation Visual Aids Pictures
This is a stacked bar ppt powerpoint presentation visual aids pictures. This is a two stage process. The stages in this process are product, percentage, finance, business, marketing.

Bar Chart Slide Ppt PowerPoint Presentation Summary Example File
This is a bar chart slide ppt powerpoint presentation summary example file. This is a three stage process. The stages in this process are percentage, marketing, management, product.
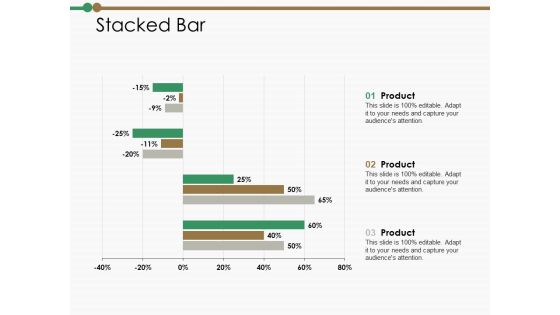
Stacked Bar Ppt PowerPoint Presentation Summary Clipart Images
This is a stacked bar ppt powerpoint presentation summary clipart images. This is a three stage process. The stages in this process are financial, percentage, product, management, marketing.

Clustered Bar Ppt PowerPoint Presentation Icon Background Image
This is a clustered bar ppt powerpoint presentation icon background image. This is a three stage process. The stages in this process are percentage, product, business, marketing.

Bar Graph Product Ppt PowerPoint Presentation Layouts Ideas
This is a bar graph product ppt powerpoint presentation layouts ideas. This is a three stage process. The stages in this process are business, management, marketing, product, percentage.

Bar Chart Product Ppt PowerPoint Presentation Summary Diagrams
This is a bar chart product ppt powerpoint presentation summary diagrams. This is a three stage process. The stages in this process are business, management, marketing, percentage, product.

Bar Chart Product Ppt PowerPoint Presentation Portfolio Visuals
This is a bar chart product ppt powerpoint presentation portfolio visuals. This is a three stage process. The stages in this process are business, management, marketing, percentage, product.

Clustered Bar Product Ppt PowerPoint Presentation Inspiration Elements
This is a clustered bar product ppt powerpoint presentation inspiration elements. This is a three stage process. The stages in this process are percentage, product, business, management, marketing.

Clustered Bar Financial Ppt PowerPoint Presentation Model Format
This is a clustered bar financial ppt powerpoint presentation model format. This is a three stage process. The stages in this process are business, management, marketing, percentage, product.
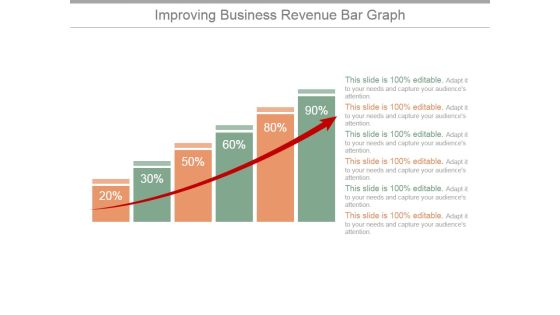
Improving Business Revenue Bar Graph Ppt PowerPoint Presentation Infographic Template
This is a improving business revenue bar graph ppt powerpoint presentation infographic template. This is a six stage process. The stages in this process are graph, arrow, finance, percentage, success.
 Home
Home