Percentage Bar

Bar Chart Ppt PowerPoint Presentation Pictures Inspiration
This is a bar chart ppt powerpoint presentation pictures inspiration. This is a seven stage process. The stages in this process are in percentage, business, marketing, finance, graph.

Bar Chart Ppt PowerPoint Presentation Summary Pictures
This is a bar chart ppt powerpoint presentation summary pictures. This is a four stage process. The stages in this process are product, unit count, finance, percentage, business.

Bar Graph Ppt PowerPoint Presentation Ideas Show
This is a bar graph ppt powerpoint presentation ideas show. This is a three stage process. The stages in this process are product, percentage, business, year, graph.

Stacked Bar Ppt PowerPoint Presentation Layouts Inspiration
This is a stacked bar ppt powerpoint presentation layouts inspiration. This is a four stage process. The stages in this process are finance, business, marketing, percentage, graph.
Stacked Bar Ppt PowerPoint Presentation Outline Layout
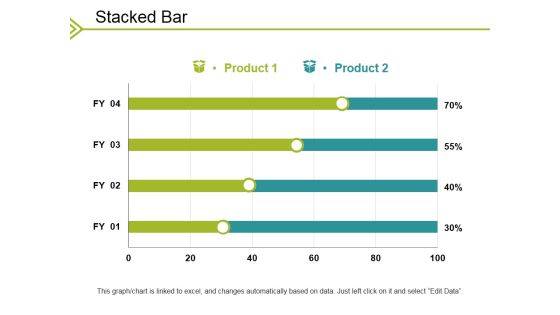
This is a stacked bar ppt powerpoint presentation outline layout. This is a two stage process. The stages in this process are in percentage, business, marketing, strategy, finance.
Stacked Bar Ppt PowerPoint Presentation File Outfit
This is a stacked bar ppt powerpoint presentation file outfit. This is a two stage process. The stages in this process are business, in percentage, marketing, strategy, graph.

Bar Chart Ppt PowerPoint Presentation Portfolio Inspiration
This is a bar chart ppt powerpoint presentation portfolio inspiration. This is a two stage process. The stages in this process are product, in percentage, in years.

Bar Graph Ppt PowerPoint Presentation Inspiration Slides
This is a bar graph ppt powerpoint presentation inspiration slides. This is a six stage process. The stages in this process are sales in percentage, financial year, product.

Bar Graph Ppt PowerPoint Presentation Infographics Templates
This is a bar graph ppt powerpoint presentation infographics templates. This is a two stage process. The stages in this process are product, financial years, sales in percentage.

Clustered Bar Ppt PowerPoint Presentation Inspiration Backgrounds
This is a clustered bar ppt powerpoint presentation inspiration backgrounds. This is a three stage process. The stages in this process are product, percentage, marketing, business.
Stacked Bar Ppt PowerPoint Presentation Ideas
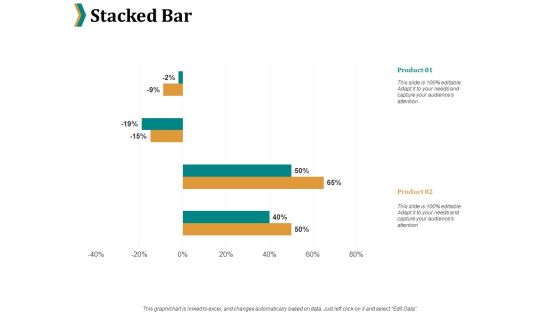
This is a stacked bar ppt powerpoint presentation ideas. This is a two stage process. The stages in this process are product, percentage, marketing, business.
Stacked Bar Ppt PowerPoint Presentation Ideas Themes
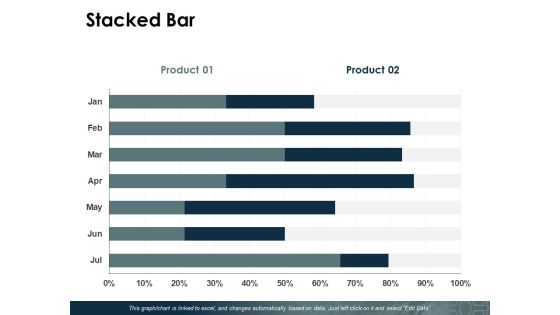
This is a stacked bar ppt powerpoint presentation ideas themes. This is a two stage process. The stages in this process are product, percentage, management, marketing.

Stacked Bar Ppt PowerPoint Presentation Ideas Maker
This is a stacked bar ppt powerpoint presentation ideas maker. This is a two stage process. The stages in this process are percentage, product, business, management.

Bar Chart Ppt PowerPoint Presentation Professional Examples
This is a bar chart ppt powerpoint presentation professional examples. This is a four stage process. The stages in this process are percentage, marketing, management, product.

Bar Chart Ppt PowerPoint Presentation Show Deck
This is a bar chart ppt powerpoint presentation show deck. This is a two stage process. The stages in this process are percentage, product, business, marketing.

Clustered Bar Ppt PowerPoint Presentation Summary Elements
This is a clustered bar ppt powerpoint presentation summary elements. This is a two stage process. The stages in this process are percentage, product, business, marketing.

Stacked Bar Ppt PowerPoint Presentation Ideas Portfolio
This is a stacked bar ppt powerpoint presentation ideas portfolio. This is a three stage process. The stages in this process are percentage, product, management, marketing.

Clustered Bar Ppt PowerPoint Presentation Professional Guide
This is a clustered bar ppt powerpoint presentation professional guide. This is a three stage process. The stages in this process are percentage, product, business, management, marketing.

Bar Graph Ppt PowerPoint Presentation Introduction
This is a bar graph ppt powerpoint presentation introduction. This is a eleven stage process. The stages in this process are management, marketing, business, fy, graph, sales in percentage.

Bar Graph Ppt PowerPoint Presentation Slides Deck
This is a bar graph ppt powerpoint presentation slides deck. This is a three stage process. The stages in this process are financial in years, product, sales in percentage.
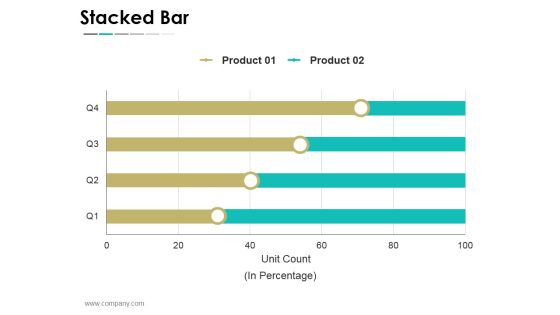
Stacked Bar Ppt PowerPoint Presentation Infographics Graphics
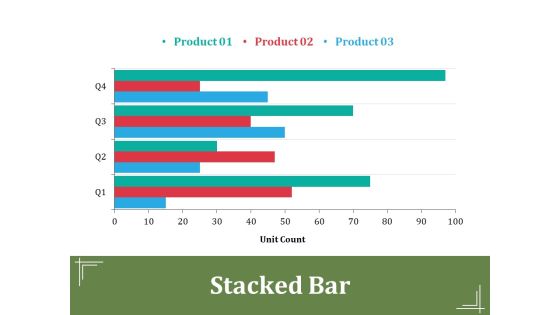
This is a stacked bar ppt powerpoint presentation infographics graphics. This is a four stage process. The stages in this process are business, strategy, marketing, success, unit count, in percentage.

Bar Chart Ppt PowerPoint Presentation Portfolio Icons
This is a bar chart ppt powerpoint presentation portfolio icons. This is a seven stage process. The stages in this process are in years, in percentage, finance, business marketing.

Bar Graph Ppt PowerPoint Presentation Portfolio Example
This is a bar graph ppt powerpoint presentation portfolio example. This is a three stage process. The stages in this process are sales in percentage, year, business, product, business, graph.

Bar Chart Ppt PowerPoint Presentation Outline Introduction
This is a bar chart ppt powerpoint presentation outline introduction. This is a one stage process. The stages in this process are sales in percentage, product, business, financial years, graph.

Bar Graph Ppt PowerPoint Presentation Gallery Grid
This is a bar graph ppt powerpoint presentation gallery grid. This is a three stage process. The stages in this process are sales in percentage, product, finance, business, marketing.

Bar Chart Ppt PowerPoint Presentation Styles Outfit
This is a bar chart ppt powerpoint presentation styles outfit. This is a Seven stage process. The stages in this process are sales in percentage, financial years, graph, business.

Bar Chart Ppt PowerPoint Presentation Icon Demonstration
This is a bar chart ppt powerpoint presentation icon demonstration. This is a seven stage process. The stages in this process are product, sales in percentage, financial year, graph.

Bar Chart Ppt PowerPoint Presentation Portfolio Diagrams
This is a bar chart ppt powerpoint presentation portfolio diagrams. This is a three stage process. The stages in this process are sales in percentage, business, marketing, graph, finance.

Bar Chart Ppt PowerPoint Presentation Icon Introduction
This is a bar chart ppt powerpoint presentation icon introduction. This is a seven stage process. The stages in this process are in years, in percentage, business, marketing, graph.

Bar Chart Ppt PowerPoint Presentation Diagram Lists
This is a bar chart ppt powerpoint presentation diagram lists. This is a two stage process. The stages in this process are business, marketing, financial years, sales in percentage, graph.

Bar Chart Ppt PowerPoint Presentation Ideas Deck
This is a bar chart ppt powerpoint presentation ideas deck. This is a two stage process. The stages in this process are product, in percentage, in years, financial, business.

Bar Chart Ppt PowerPoint Presentation Summary Themes
This is a bar chart ppt powerpoint presentation summary themes. This is a three stage process. The stages in this process are financial years, sales in percentage, business, marketing, graph.

Bar Chart Ppt PowerPoint Presentation Layouts Template
This is a bar chart ppt powerpoint presentation layouts template. This is a two stage process. The stages in this process are financial year, sales in percentage, business, marketing, finance.

Bar Graph Ppt PowerPoint Presentation Infographics Icon
This is a bar graph ppt powerpoint presentation infographics icon. This is a two stage process. The stages in this process are business, marketing, financial year, in percentage, graph.
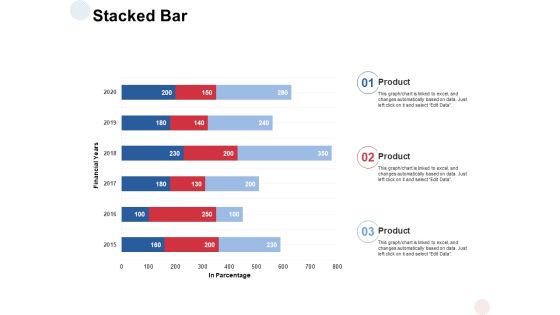
Stacked Bar Analysis Ppt PowerPoint Presentation Styles Graphics Template
Presenting this set of slides with name stacked bar analysis ppt powerpoint presentation styles graphics template. The topics discussed in these slides are stacked bar, financial years, percentage. This is a completely editable PowerPoint presentation and is available for immediate download. Download now and impress your audience.

Bar Chart Ppt PowerPoint Presentation Infographics Format Ideas
This is a bar chart ppt powerpoint presentation infographics format ideas. This is a two stage process. The stages in this process are bar graph, product, financial year, sales in percentage.
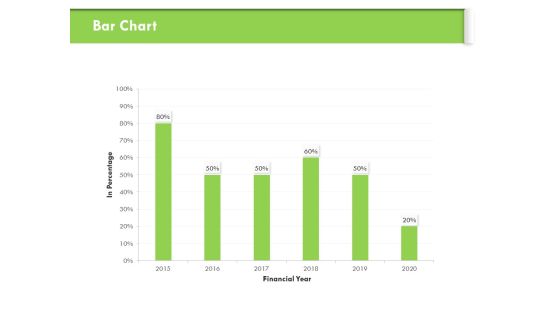
Understanding Organizational Structures Bar Chart Ppt Professional Visuals PDF
Presenting this set of slides with name understanding organizational structures bar chart ppt professional visuals pdf. The topics discussed in these slides are bar chart, financial year, percentage. This is a completely editable PowerPoint presentation and is available for immediate download. Download now and impress your audience.

Bar Graph Business PowerPoint Templates And PowerPoint Themes 1012
Bar Graph Business PowerPoint Templates And PowerPoint Themes 1012-This PowerPoint Template shows the Bar Graph with increasing percentage which signifies the Financial Growth. The Template signifies the concept of business growth. The structure of our templates allows you to effectively highlight the key issues concerning the growth of your business. Our PPT images are so ideally designed that it reveals the very basis of our PPT template are an effective tool to make your clients understand.-Bar Graph Business PowerPoint Templates And PowerPoint Themes 1012-This PowerPoint template can be used for presentations relating to-Financial bar graph chart, technology, money, business, finance, marketing

Stacked Bar Analysis Ppt PowerPoint Presentation Gallery Outline
Presenting this set of slides with name stacked bar analysis ppt powerpoint presentation gallery outline. The topics discussed in these slides are stacked bar, financial year, sales in percentage. This is a completely editable PowerPoint presentation and is available for immediate download. Download now and impress your audience.
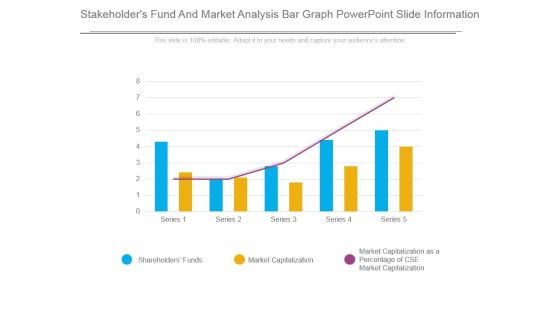
Stakeholders Fund And Market Analysis Bar Graph Powerpoint Slide Information
This is a stakeholders fund and market analysis bar graph powerpoint slide information. This is a five stage process. The stages in this process are shareholders funds, market capitalization, market capitalization as a percentage of cse market capitalization.

Business Diagram Business Bar Graph For Data Analysis Presentation Template
This business slide displays pie charts with percentage ratios. This diagram is a data visualization tool that gives you a simple way to present statistical information. This slide helps your audience examines and interprets the data you present.

Bar Graph To Compare Business Data PowerPoint Slides
This is the slide which can solve many purposes of yours. Be it growth in your company, need to show your company?s status in the market as compared to others, or how your business has improved so far. An ideal PowerPoint template to display all of these. You can easily use this graph to show the growth of your company using the percentage icons. You can use this visual to show the status of your company in the market in comparison with others. You can edit the icons and replace them with the logo of your company and the others. You can also show it to your colleagues how your company has built its image in the market or how it has improved over the time. A perfect bar graph image which needs to be included in your business PPT presentations.

Overall Revenue Analysis Bar Chart Powerpoint Slide Information
This is a overall revenue analysis bar chart powerpoint slide information. This is a nine stage process. The stages in this process are finance, success, business, marketing, percentage.
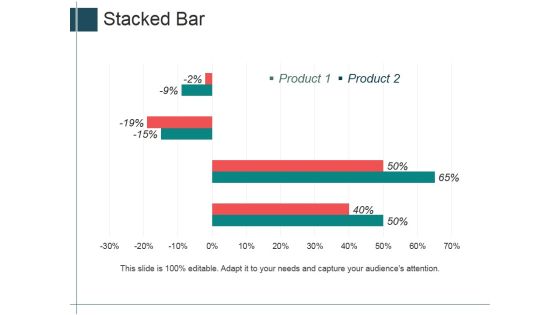
Stacked Bar Ppt PowerPoint Presentation Styles Designs Download
This is a stacked bar ppt powerpoint presentation styles designs download. This is a four stage process. The stages in this process are product, finance, percentage, business.

Bar Chart Ppt PowerPoint Presentation Infographic Template Example
This is a bar chart ppt powerpoint presentation infographic template example. This is a seven stage process. The stages in this process are business, finance, marketing, percentage.
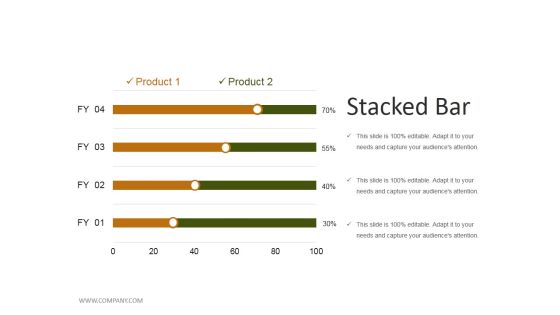
Stacked Bar Ppt PowerPoint Presentation Gallery File Formats
This is a stacked bar ppt powerpoint presentation gallery file formats. This is a four stage process. The stages in this process are finance, product, percentage, business, marketing.

Bar Graph Ppt PowerPoint Presentation Styles File Formats
This is a bar graph ppt powerpoint presentation styles file formats. This is a four stage process. The stages in this process are percentage, business, marketing, finance, strategy.

Bar Chart Ppt PowerPoint Presentation Show Example File
This is a bar chart ppt powerpoint presentation show example file. This is a two stage process. The stages in this process are product, business, marketing, graph, percentage.
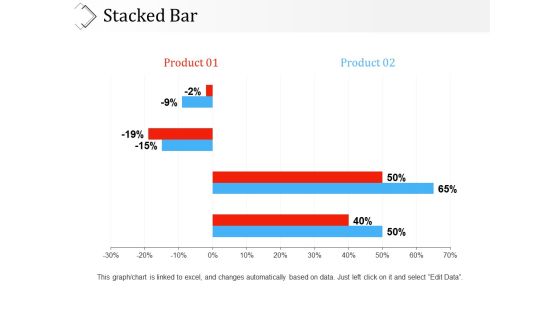
Stacked Bar Ppt PowerPoint Presentation Infographic Template Clipart
This is a stacked bar ppt powerpoint presentation infographic template clipart. This is a two stage process. The stages in this process are product, percentage, business, marketing, graph.
Stacked Bar Ppt PowerPoint Presentation Icon Background Image
This is a stacked bar ppt powerpoint presentation icon background image. This is a four stage process. The stages in this process are product, percentage, finance, business, marketing.

Stacked Bar Ppt PowerPoint Presentation Visual Aids Pictures
This is a stacked bar ppt powerpoint presentation visual aids pictures. This is a two stage process. The stages in this process are product, percentage, finance, business, marketing.

Bar Chart Slide Ppt PowerPoint Presentation Summary Example File
This is a bar chart slide ppt powerpoint presentation summary example file. This is a three stage process. The stages in this process are percentage, marketing, management, product.
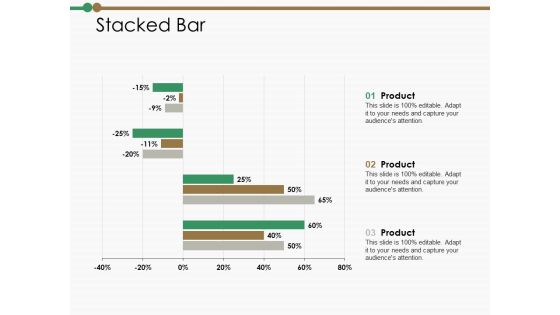
Stacked Bar Ppt PowerPoint Presentation Summary Clipart Images
This is a stacked bar ppt powerpoint presentation summary clipart images. This is a three stage process. The stages in this process are financial, percentage, product, management, marketing.

Clustered Bar Ppt PowerPoint Presentation Icon Background Image
This is a clustered bar ppt powerpoint presentation icon background image. This is a three stage process. The stages in this process are percentage, product, business, marketing.

Bar Graph Product Ppt PowerPoint Presentation Layouts Ideas
This is a bar graph product ppt powerpoint presentation layouts ideas. This is a three stage process. The stages in this process are business, management, marketing, product, percentage.

Bar Chart Product Ppt PowerPoint Presentation Summary Diagrams
This is a bar chart product ppt powerpoint presentation summary diagrams. This is a three stage process. The stages in this process are business, management, marketing, percentage, product.

Bar Chart Product Ppt PowerPoint Presentation Portfolio Visuals
This is a bar chart product ppt powerpoint presentation portfolio visuals. This is a three stage process. The stages in this process are business, management, marketing, percentage, product.

Clustered Bar Product Ppt PowerPoint Presentation Inspiration Elements
This is a clustered bar product ppt powerpoint presentation inspiration elements. This is a three stage process. The stages in this process are percentage, product, business, management, marketing.

Clustered Bar Financial Ppt PowerPoint Presentation Model Format
This is a clustered bar financial ppt powerpoint presentation model format. This is a three stage process. The stages in this process are business, management, marketing, percentage, product.
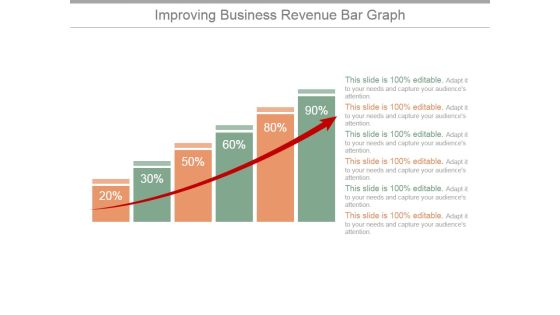
Improving Business Revenue Bar Graph Ppt PowerPoint Presentation Infographic Template
This is a improving business revenue bar graph ppt powerpoint presentation infographic template. This is a six stage process. The stages in this process are graph, arrow, finance, percentage, success.

 Home
Home