Financial Dashboard
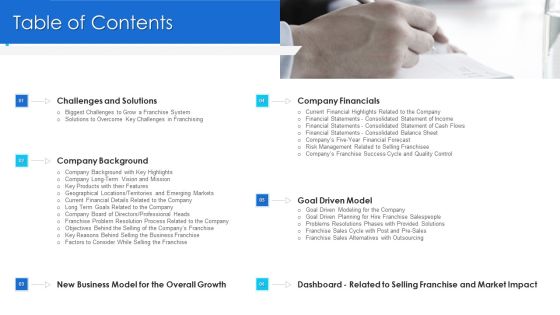
Promoting Selling Franchise Company Development Table Of Contents Guidelines PDF
This is a promoting selling franchise company development table of contents guidelines pdf template with various stages. Focus and dispense information on six stages using this creative set, that comes with editable features. It contains large content boxes to add your information on topics like business model, dashboard, goal driven model, company financials, overall growth. You can also showcase facts, figures, and other relevant content using this PPT layout. Grab it now.
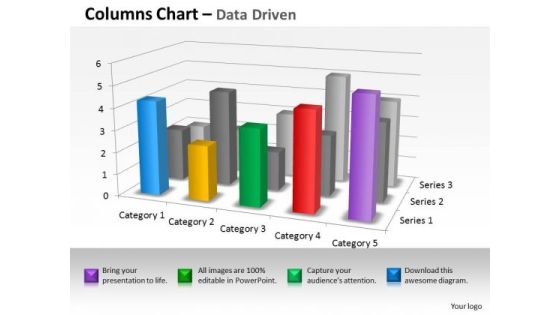
Quantitative Data Analysis 3d Interpretation Of Statistical Quality Control PowerPoint Templates
Land The Idea With Our quantitative data analysis 3d interpretation of statistical quality control Powerpoint Templates . Help It Grow With Your Thoughts.
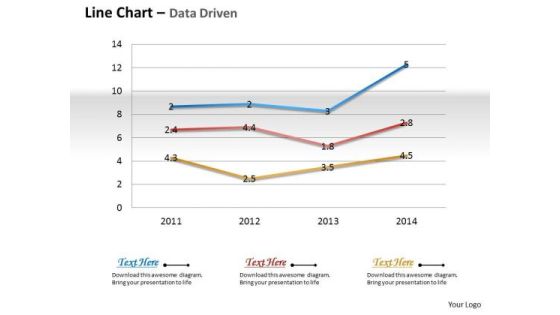
Business Data Analysis Chart Shows Changes Over The Time PowerPoint Templates
Document The Process On Our business data analysis chart shows changes over the time Powerpoint Templates. Make A Record Of Every Detail.

Data Analysis Excel Driven Multiple Series Scatter Chart PowerPoint Slides Templates
Your Listeners Will Never Doodle. Our data analysis excel driven multiple series scatter chart powerpoint slides Templates Will Hold Their Concentration.

Business Diagram Four Colored Pie Charts For Result Analysis Data Driven PowerPoint Slide
This business diagram displays graphic of pie charts. This business slide is suitable to present and compare business data. Use this diagram to build professional presentations for your viewers.
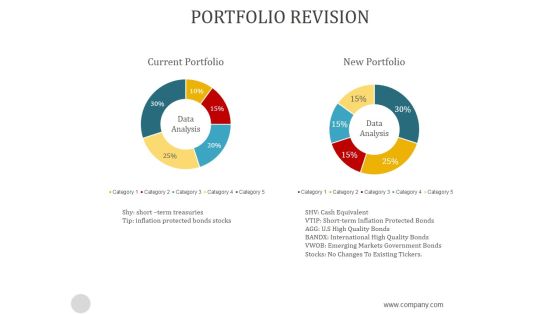
Portfolio Revision Ppt PowerPoint Presentation Template
This is a portfolio revision ppt powerpoint presentation template. This is a two stage process. The stages in this process are data analysis, current portfolio, new portfolio.

Innovative Technologies For Improving Economic Functions Ppt PowerPoint Presentation File Graphics Example PDF
This slide showcase key digital technologies for improving financials functions. It includes major steps such as-Make user friendly dashboards for internal customer demands, Develop predictive models for every warning etc. Persuade your audience using this innovative technologies for improving economic functions ppt powerpoint presentation file graphics example pdf. This PPT design covers four stages, thus making it a great tool to use. It also caters to a variety of topics including automation and robotics, data visualization, advanced analytics for finance. Download this PPT design now to present a convincing pitch that not only emphasizes the topic but also showcases your presentation skills.

Data Statistics Charts And Key Performance Indicators Ppt Powerpoint Presentation Layouts Guide
This is a data statistics charts and key performance indicators ppt powerpoint presentation layouts guide. This is a four stage process. The stages in this process are business metrics, business kpi, business dashboard.
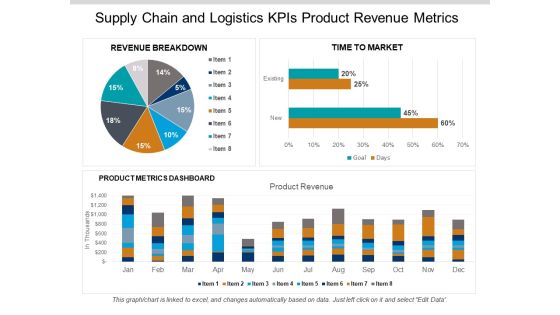
Supply Chain And Logistics Kpis Product Revenue Metrics Ppt PowerPoint Presentation Gallery Aids
This is a supply chain and logistics kpis product revenue metrics ppt powerpoint presentation gallery aids. This is a three stage process. The stages in this process are logistics performance, logistics dashboard, logistics kpis.

Essentials Of Statistics For Business And Economics Ppt Powerpoint Presentation Pictures Styles
This is a essentials of statistics for business and economics ppt powerpoint presentation pictures styles. This is a three stage process. The stages in this process are business metrics, business kpi, business dashboard.
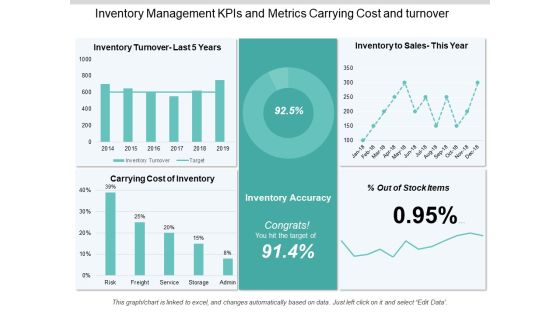
Inventory Management Kpis And Metrics Carrying Cost And Turnover Ppt PowerPoint Presentation Information
This is a inventory management kpis and metrics carrying cost and turnover ppt powerpoint presentation information. This is a five stage process. The stages in this process are logistics performance, logistics dashboard, logistics kpis.

Kpis In Shipping Perfect Order Rate And On Time Shipment Ppt PowerPoint Presentation Show Guide
This is a kpis in shipping perfect order rate and on time shipment ppt powerpoint presentation show guide. This is a six stage process. The stages in this process are logistics performance, logistics dashboard, logistics kpis.
Logistics Kpis And Metrics Percentage Of Orders Delivered Ppt PowerPoint Presentation Icon
This is a logistics kpis and metrics percentage of orders delivered ppt powerpoint presentation icon. This is a five stage process. The stages in this process are logistics performance, logistics dashboard, logistics kpis.

Calculator With Business Reports For Operational Efficiency Ppt Powerpoint Presentation Ideas Infographic Template
This is a calculator with business reports for operational efficiency ppt powerpoint presentation ideas infographic template. This is a four stage process. The stages in this process are business metrics, business kpi, business dashboard.

Metrics For Project Success Benefits And Return Of Investment Ppt PowerPoint Presentation Pictures Structure
This is a metrics for project success benefits and return of investment ppt powerpoint presentation pictures structure. This is a four stage process. The stages in this process are project dashboard, project kpis, project metrics.

Metrics In Project Management Planning Design Development Ppt PowerPoint Presentation Outline Show
This is a metrics in project management planning design development ppt powerpoint presentation outline show. This is a two stage process. The stages in this process are project dashboard, project kpis, project metrics.
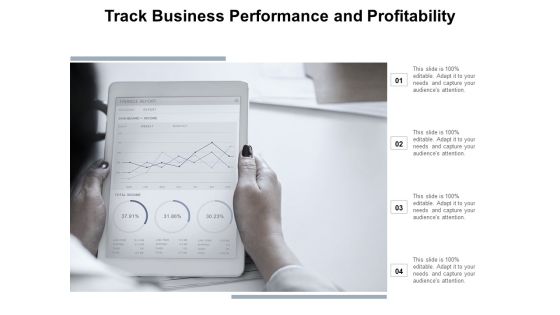
Track Business Performance And Profitability Ppt Powerpoint Presentation File Master Slide
This is a track business performance and profitability ppt powerpoint presentation file master slide. This is a four stage process. The stages in this process are business metrics, business kpi, business dashboard.
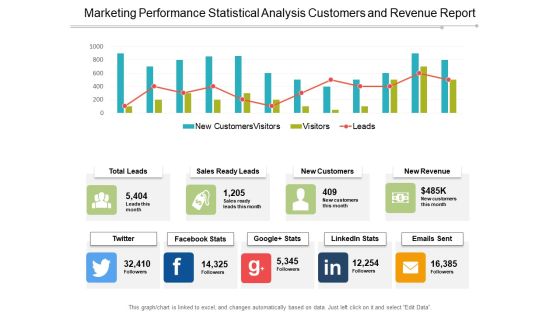
Marketing Performance Statistical Analysis Customers And Revenue Report Ppt PowerPoint Presentation Outline Shapes
This is a marketing performance statistical analysis customers and revenue report ppt powerpoint presentation outline shapes. This is a four stage process. The stages in this process are marketing analytics, marketing performance, marketing discovery.
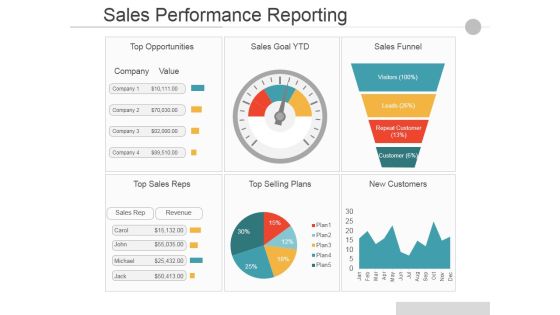
Sales Performance Reporting Ppt PowerPoint Presentation Infographics Portrait
This is a Sales Performance Reporting Ppt PowerPoint Presentation Infographics Portrait. This is a six stage process. The stages in this process are Top Opportunities, Sales Goal Ytd, Sales Funnel, Top Sales Reps, Top Selling Plans, New Customers.
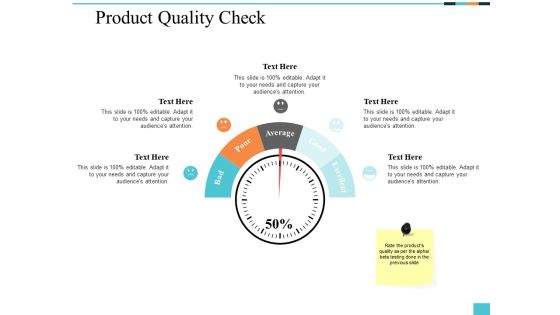
Product Quality Check Ppt PowerPoint Presentation Model Microsoft
This is a product quality check ppt powerpoint presentation model microsoft. This is a five stage process. The stages in this process are finance, marketing, management, investment, analysis.

News Report Business PowerPoint Templates And PowerPoint Backgrounds 0511
Microsoft PowerPoint Template and Background with financial news report

News Report Business PowerPoint Themes And PowerPoint Slides 0511
Microsoft PowerPoint Theme and Slide with financial news report
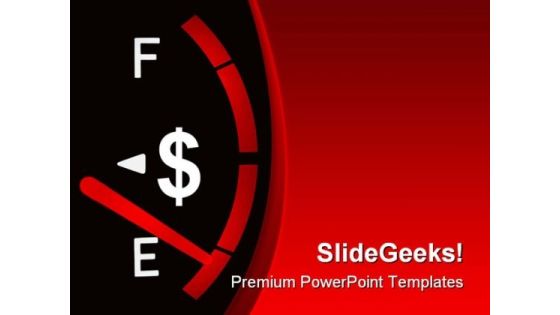
Empty Funds Finance PowerPoint Template 0610
Cash gauge on the dashboard approaching empty value

Key Evaluation Metrics Ppt Slides
This is a key evaluation metrics ppt slides. This is a five stage process. The stages in this process are business, finance, marketing, symbol.
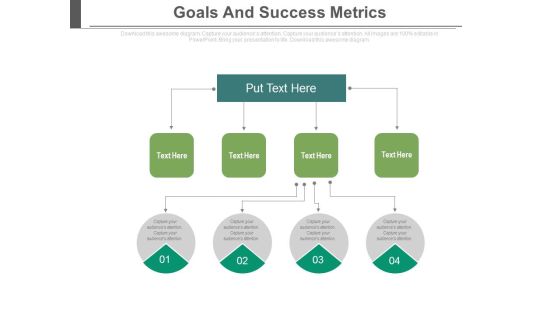
Goals And Success Metrics Ppt Slides
This is a goals and success metrics ppt slides. This is a four stage process. The stages in this process are process and flows, success, business.
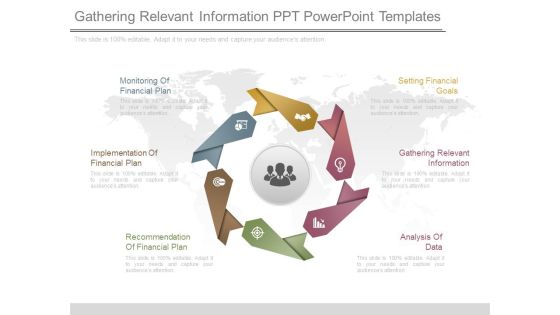
Gathering Relevant Information Ppt Powerpoint Templates
This is a gathering relevant information ppt powerpoint templates. This is a six stage process. The stages in this process are setting financial goals, gathering relevant information, analysis of data, recommendation of financial plan, implementation of financial plan, monitoring of financial plan.
E Business PowerPoint Icon C
abstract background with barcode binary data leaks and money sphere - financial and e-commerce concept
E Business PowerPoint Icon S
abstract background with barcode binary data leaks and money sphere - financial and e-commerce concept

Stock Photo Golden Dollar Symbol With Pie Graph PowerPoint Slide
This Power Point template has been crafted with graphic of golden dollar symbol and pie chart on a tablet. Display the concept of financial data analysis with this image. Use this image to present financial reports in business presentations.

Performance Measures Ppt PowerPoint Presentation Inspiration Skills
This is a performance measures ppt powerpoint presentation inspiration skills. This is a two stage process. The stages in this process are non financial measures, financial measures, growth, business, marketing.
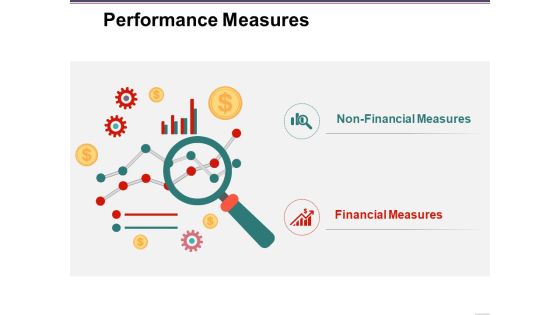
Performance Measures Ppt PowerPoint Presentation Layouts Clipart Images
This is a performance measures ppt powerpoint presentation layouts clipart images. This is a two stage process. The stages in this process are non financial measures, financial measures, business, icons, marketing.

Clock With Money Bag Vector Icon Ppt PowerPoint Presentation File Outline PDF
Presenting this set of slides with name clock with money bag vector icon ppt powerpoint presentation file outline pdf. This is a three stage process. The stages in this process are clock with money bag vector icon. This is a completely editable PowerPoint presentation and is available for immediate download. Download now and impress your audience.
Time Is Money Vector Icon Ppt PowerPoint Presentation Icon Backgrounds PDF
Presenting this set of slides with name time is money vector icon ppt powerpoint presentation icon backgrounds pdf. This is a three stage process. The stages in this process are time is money vector icon. This is a completely editable PowerPoint presentation and is available for immediate download. Download now and impress your audience.

Organization Transformation Strategies For Successful Business Elements PDF
This slide shows how transformation has taken place in an organization over a long period of time with the economic impact. It includes digital products and infrastructure, digital distribution and web strategy and business models. Presenting Organization Transformation Strategies For Successful Business Elements PDF to dispense important information. This template comprises three stages. It also presents valuable insights into the topics including Workplace Tools, Digital Workflows, Digitalizing The Business. This is a completely customizable PowerPoint theme that can be put to use immediately. So, download it and address the topic impactfully.
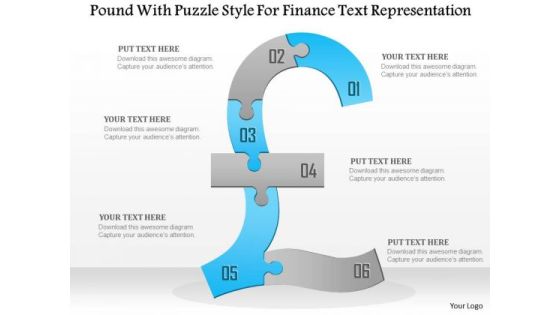
Business Diagram Pound With Puzzle Style For Finance Text Representation Presentation Template
This Power Point template slide has been used to display the concept of financial data representation. This PPT slide contains the graphic of pound in puzzle style. Use this PPT slide and make an exclusive presentation for financial topics.

Product Development Powerpoint Slide Background Image
This is a product development powerpoint slide background image. This is a five stage process. The stages in this process are product development, product marketing, financial analysis, financial reporting, product sale and delivery.

Attract More Investments Plan Template Ppt Slide Templates
This is a attract more investments plan template ppt slide templates. This is a five stage process. The stages in this process are financial planning objectives, asset allocation policy, financial planning investment styles, rebalance your portfolio, report the results.

Tools Of Strategic Management Ppt Powerpoint Show
This is a tools of strategic management ppt powerpoint show. This is a five stage process. The stages in this process are business strategy, financial strategy, management reporting, exit strategy, financial controls.

Two Weeks Schedule Showing Highlighting Business Tasks Ppt PowerPoint Presentation Pictures Background Designs PDF
Presenting this set of slides with name two weeks schedule showing highlighting business tasks ppt powerpoint presentation pictures background designs pdf. This is a two stage process. The stages in this process are announcement of financial statements, payment of dividends, financial performance review, monthly financial reporting, expense audit, ledger review, financial planning, budget optimization. This is a completely editable PowerPoint presentation and is available for immediate download. Download now and impress your audience.
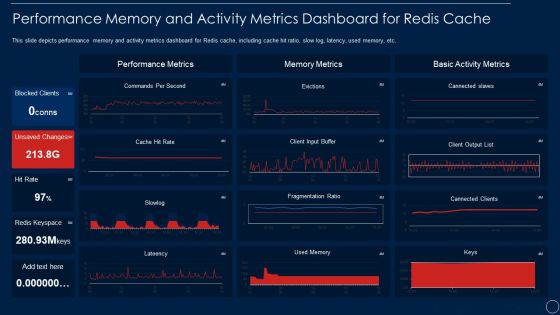
Redis Cache Data Structure IT Performance Memory And Activity Metrics Introduction PDF
This slide depicts performance memory and activity metrics dashboard for Redis cache, including cache hit ratio, slow log, latency, used memory, etc. This is a redis cache data structure it performance memory and activity metrics introduction pdf template with various stages. Focus and dispense information on one stages using this creative set, that comes with editable features. It contains large content boxes to add your information on topics like performance memory and activity metrics dashboard for redis cache. You can also showcase facts, figures, and other relevant content using this PPT layout. Grab it now.
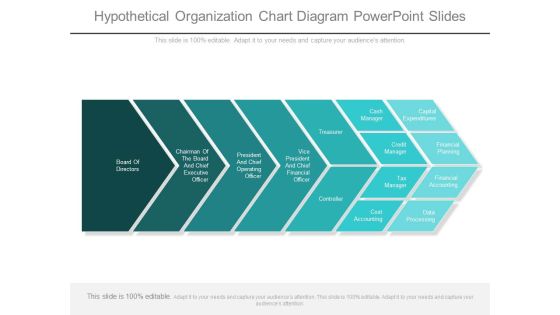
Hypothetical Organization Chart Diagram Powerpoint Slides
This is a hypothetical organization chart diagram powerpoint slides. This is a seven stage process. The stages in this process are board of directors, chairman of the board and chief executive officer, president and chief operating officer, vice president and chief financial officer, treasurer, controller, cash manager, capital expenditures, credit manager, financial planning, tax manager, financial accounting, cost accounting, data processing.

Agile QA Procedure Forfeiture Of Poor Quality Projects Topics PDF
This slide highlights the companys year over year financial statistics covering details about the loss incur, revenue generated, and expenses made. Deliver an awe inspiring pitch with this creative agile qa procedure forfeiture of poor quality projects topics pdf bundle. Topics like dashboard for tracking the agile quality assurance process effectiveness can be discussed with this completely editable template. It is available for immediate download depending on the needs and requirements of the user.
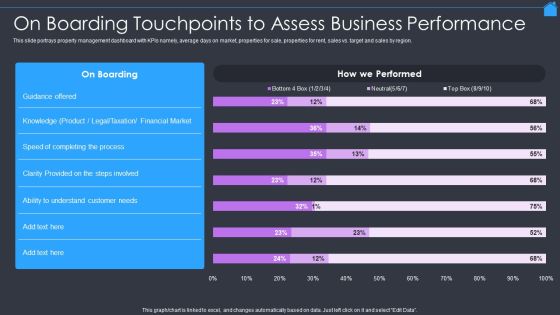
Marketing Strategy To Enhance Real Estate Sales On Boarding Touchpoints To Assess Business Performance Guidelines PDF
This slide portrays property management dashboard with KPIs namely, average days on market, properties for sale, properties for rent, sales vs. target and sales by region. Deliver an awe inspiring pitch with this creative Marketing Strategy To Enhance Real Estate Sales On Boarding Touchpoints To Assess Business Performance Guidelines PDF bundle. Topics like Financial Market, Taxation, Product can be discussed with this completely editable template. It is available for immediate download depending on the needs and requirements of the user.

Company Overview Contd Operating Manual Ppt Infographic Template Layouts PDF
The purpose of this slide is to provide glimpse about the key promoters and the financial highlights of the firm as an financial overview of firms performance. Deliver and pitch your topic in the best possible manner with this company overview contd operating manual ppt infographic template layouts pdf. Use them to share invaluable insights on revenue, net income, financial and impress your audience. This template can be altered and modified as per your expectations. So, grab it now

Business Plan And Report Example Presentation Images
This is a business plan and report example presentation images. This is a three stage process. The stages in this process are business plan, time management, financial report.
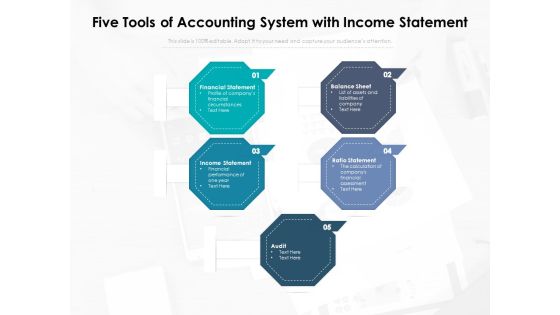
Five Tools Of Accounting System With Income Statement Ppt PowerPoint Presentation Infographic Template Rules PDF
Presenting this set of slides with name five tools of accounting system with income statement ppt powerpoint presentation infographic template rules pdf. This is a five stage process. The stages in this process are financial statement, profile of companys financial, circumstances, balance sheet, list of assets and liabilities of company, income statement, financial performance of one year, ratio statement, the calculation of companys financial assessment, audit. This is a completely editable PowerPoint presentation and is available for immediate download. Download now and impress your audience.
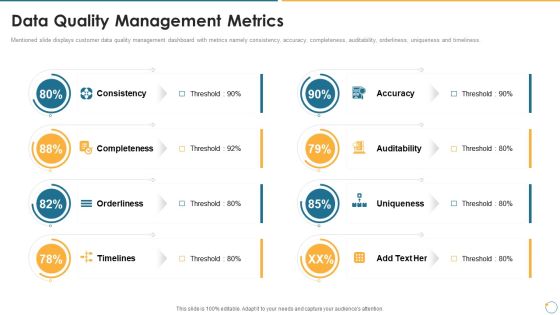
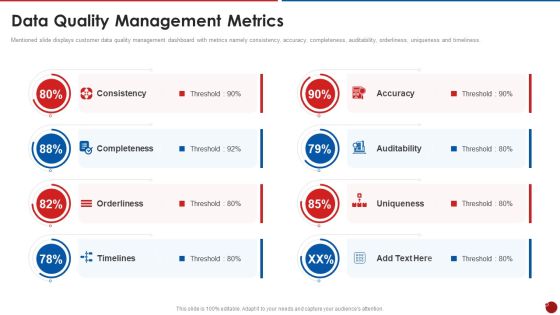
Collection Of Quality Assurance PPT Data Quality Management Metrics Information PDF
Mentioned slide displays customer data quality management dashboard with metrics namely consistency, accuracy, completeness, auditability, orderliness, uniqueness and timeliness. This is a collection of quality assurance ppt data quality management metrics information pdf template with various stages. Focus and dispense information on eight stages using this creative set, that comes with editable features. It contains large content boxes to add your information on topics like accuracy, auditability, consistency, completeness, uniqueness. You can also showcase facts, figures, and other relevant content using this PPT layout. Grab it now.
Quality Assurance Templates Set 2 Data Quality Management Metrics Pictures PDF
Mentioned slide displays customer data quality management dashboard with metrics namely consistency, accuracy, completeness, auditability, orderliness, uniqueness and timeliness. Presenting quality assurance templates set 2 data quality management metrics pictures pdf to provide visual cues and insights. Share and navigate important information on eight stages that need your due attention. This template can be used to pitch topics like consistency, completeness, orderliness, timelines, accuracy. In addtion, this PPT design contains high resolution images, graphics, etc, that are easily editable and available for immediate download.

QA Plan Set 2 Data Quality Management Metrics Ppt PowerPoint Presentation Gallery Background Image PDF
Mentioned slide displays customer data quality management dashboard with metrics namely consistency, accuracy, completeness, auditability, orderliness, uniqueness and timeliness. Presenting QA Plan Set 2 Data Quality Management Metrics Ppt PowerPoint Presentation Gallery Background Image PDF to provide visual cues and insights. Share and navigate important information on eight stages that need your due attention. This template can be used to pitch topics like Accuracy Completeness, Orderliness Timelines. In addtion, this PPT design contains high resolution images, graphics, etc, that are easily editable and available for immediate download.

Quarterly Workstream Planning Timeline Report Ppt PowerPoint Presentation Infographic Template Microsoft PDF
Presenting this set of slides with name quarterly workstream planning timeline report ppt powerpoint presentation infographic template microsoft pdf. The topics discussed in these slides are financial year 2019, financial year 2020, workstream, quarter. This is a completely editable PowerPoint presentation and is available for immediate download. Download now and impress your audience.

Cyber Security Implementation Framework Present Concerns Impeding Cybersecurity Clipart PDF
Presenting this set of slides with name cyber security implementation framework present concerns impeding cybersecurity clipart pdf. The topics discussed in these slides are data breaches and records exposed, reported financial losses due to increase cybercrimes, financial losses, cybercrimes incidents. This is a completely editable PowerPoint presentation and is available for immediate download. Download now and impress your audience.

Money Management Pile Of Coins Image Ppt PowerPoint Presentation Ideas
Presenting this set of slides with name money management pile of coins image ppt powerpoint presentation ideas. This is a one stage process. The stages in this process are financial strategy, business financial trend, business strategy. This is a completely editable PowerPoint presentation and is available for immediate download. Download now and impress your audience.

Methods Of Raising Equity Capital Ppt PowerPoint Presentation Infographics Images
Presenting this set of slides with name methods of raising equity capital ppt powerpoint presentation infographics images. This is a seven stage process. The stages in this process are financial strategy, business financial trend, business strategy. This is a completely editable PowerPoint presentation and is available for immediate download. Download now and impress your audience.

Business Strategy Of Financing Sources Ppt PowerPoint Presentation Summary Background Images
Presenting this set of slides with name business strategy of financing sources ppt powerpoint presentation summary background images. This is a four stage process. The stages in this process are financial strategy, business financial trend, business strategy. This is a completely editable PowerPoint presentation and is available for immediate download. Download now and impress your audience.
Finance Growth Plan Vector Icon Ppt PowerPoint Presentation Model Layouts
Presenting this set of slides with name finance growth plan vector icon ppt powerpoint presentation model layouts. This is a one stage process. The stages in this process are financial strategy, business financial trend, business strategy. This is a completely editable PowerPoint presentation and is available for immediate download. Download now and impress your audience.

Picture Of Chess Game For Strategic Planning Ppt PowerPoint Presentation Summary Deck
Presenting this set of slides with name picture of chess game for strategic planning ppt powerpoint presentation summary deck. This is a seven stage process. The stages in this process are financial strategy, business financial trend, business strategy. This is a completely editable PowerPoint presentation and is available for immediate download. Download now and impress your audience.
Objectives Of Accounting Flow Chart Example Of Ppt Presentation
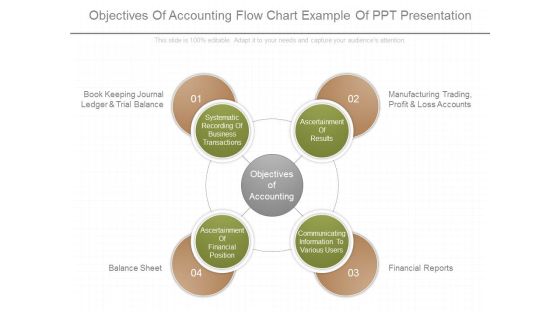
This is a objectives of accounting flow chart example of ppt presentation. This is a four stage process. The stages in this process are book keeping journal ledger and trial balance, manufacturing trading profit and loss accounts, balance sheet, financial reports, systematic recording of business transactions, ascertainment of results, ascertainment of financial position, communicating information to various users, objectives of accounting.

Business Case Development Tools Presentation Images
This is a business case development tools presentation images. This is a nine stage process. The stages in this process are user guide, business profile, it spending tco, initiative costs, initiative benefits, financial analysis, non financial kpls optional, business case reports, initiative descriptions reference only.

Bar Graph For Marketing Research Data Powerpoint Slides
This PowerPoint template has been designed with diagram of bar graph. This PPT slide can be used to prepare presentations for profit growth report and also for financial data analysis. You can download finance PowerPoint template to prepare awesome presentations.

Bar Graph For Marketing Research Process Powerpoint Slides
This PowerPoint template has been designed with diagram of bar graph. This PPT slide can be used to prepare presentations for profit growth report and also for financial data analysis. You can download finance PowerPoint template to prepare awesome presentations.

 Home
Home