Financial Dashboard
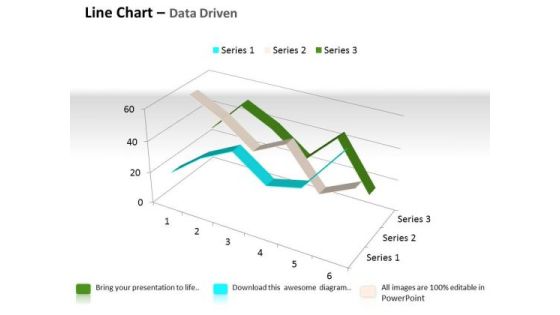
Quantitative Data Analysis 3d Line Chart For Comparison Of PowerPoint Templates
Touch Base With Our quantitative data analysis 3d line chart for comparison of Powerpoint Templates . Review Your Growth With Your Audience.

Quantitative Data Analysis 3d Pie Chart For Business Process PowerPoint Templates
Put Them On The Same Page With Our quantitative data analysis 3d pie chart for business process Powerpoint Templates . Your Team Will Sing From The Same Sheet.
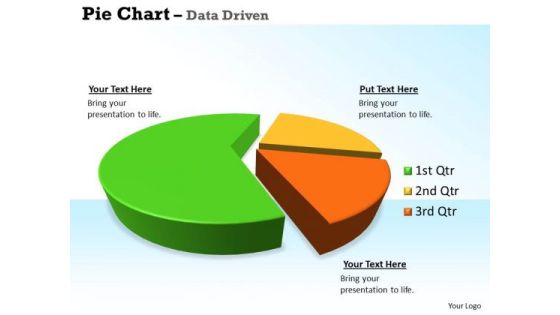
Quantitative Data Analysis 3d Pie Chart For Business Statistics PowerPoint Templates
Our quantitative data analysis 3d pie chart for business statistics Powerpoint Templates Allow You To Do It With Ease. Just Like Picking The Low Hanging Fruit.

Data Analysis On Excel 3d Chart Shows Interrelated Sets Of PowerPoint Templates
Put Them On The Same Page With Our data analysis on excel 3d chart shows interrelated sets of Powerpoint Templates . Your Team Will Sing From The Same Sheet.
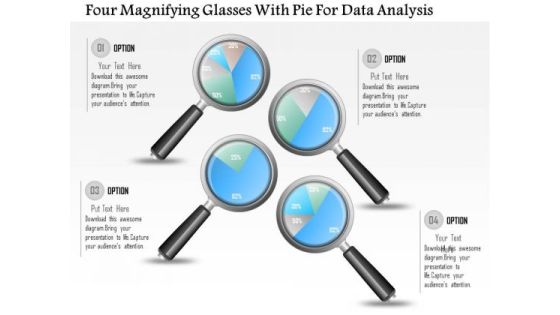
Business Diagram Four Magnifying Glasses With Pie For Data Analysis PowerPoint Slide
This business diagram displays graphic of pie charts in shape of magnifying glasses This business slide is suitable to present and compare business data. Use this diagram to build professional presentations for your viewers.
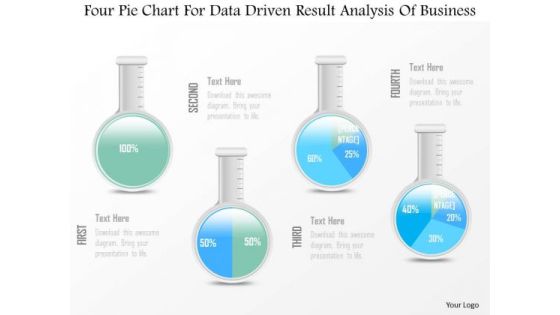
Business Diagram Four Pie Chart For Data Driven Result Analysis Of Business PowerPoint Slide
This business diagram displays graphic of pie charts in shape of flasks. This business slide is suitable to present and compare business data. Use this diagram to build professional presentations for your viewers.
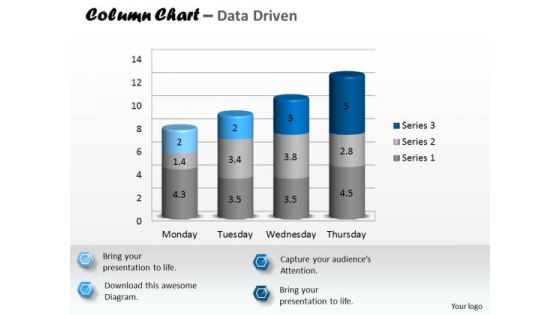
Data Analysis In Excel 3d Column Chart To Represent Information PowerPoint Templates
Rake In The Dough With
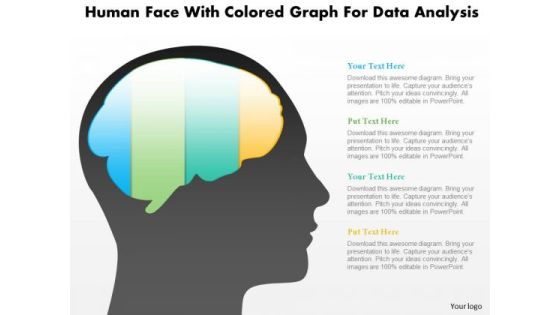
Business Diagram Human Face With Colored Graph For Data Analysis PowerPoint Slide
This diagram displays human face graphic with colored graph. This diagram can be used to represent strategy, planning, thinking of business plan. Display business options in your presentations by using this creative diagram.

Business Diagram Alarm Clock With Pie Chart For Result Analysis PowerPoint Slide
This business slide displays alarm clock with pie chart. This diagram is a data visualization tool that gives you a simple way to present statistical information. This slide helps your audience examine and interpret the data you present.

Business Diagram Flask With Data Driven Chart PowerPoint Slide
This data driven diagram has been designed with flask graphics. Download this diagram to give your presentations more effective look. It helps in clearly conveying your message to clients and audience.

Business Diagram Laptop With Data Driven Area Chart PowerPoint Slide
This diagram has been designed with laptop and data driven area chart. Download this diagram to give your presentations more effective look. It helps in clearly conveying your message to clients and audience.
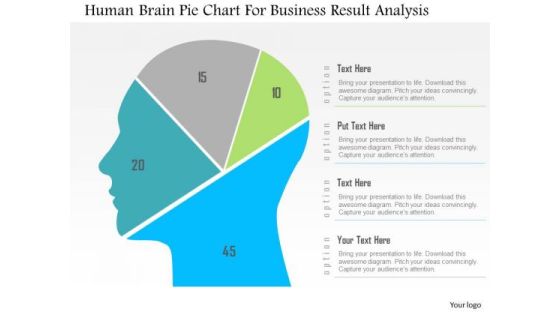
Business Diagram Human Brain Pie Chart For Business Result Analysis PowerPoint Slide
This diagram displays human face graphic divided into sections. This section can be used for data display. Use this diagram to build professional presentations for your viewers.

Business Diagram 3d Colorful Pie Graph With Magnifier Data Search PowerPoint Slide
This business slide displays 3d colorful pie graph with magnifier. This diagram is a data visualization tool that gives you a simple way to present statistical information. This slide helps your audience examine and interpret the data you present.

Business Diagram Data Driven Pie Chart Inside The Magnifier PowerPoint Slide
This business slide displays 3d colorful pie graph with magnifier. This diagram is a data visualization tool that gives you a simple way to present statistical information. This slide helps your audience examine and interpret the data you present.
Business Diagram 3d Capsule With Multiple Icons For Business Data Flow PowerPoint Slide
This diagram has been designed with 3d graphic of capsule with multiple icons. This data driven PowerPoint slide can be used to give your presentations more effective look. It helps in clearly conveying your message to clients and audience.
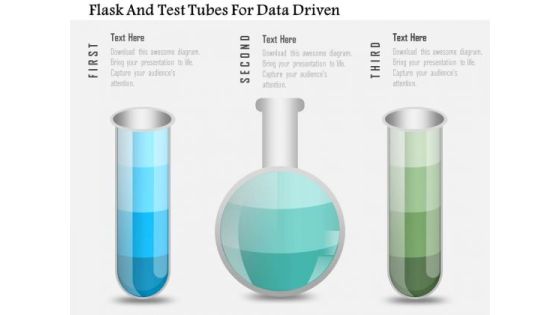
Business Diagram Flask And Test Tubes For Data Driven PowerPoint Slide
This data driven diagram has been designed with flask and test tubes. Download this diagram to give your presentations more effective look. It helps in clearly conveying your message to clients and audience.
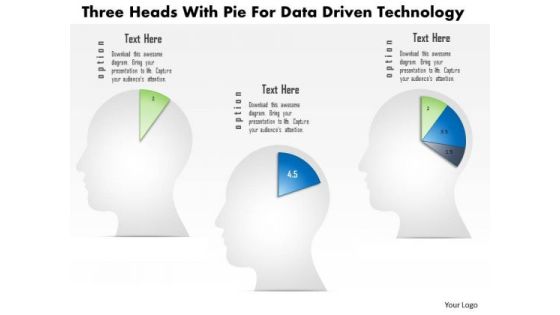
Business Diagram Three Heads With Pie For Data Driven Technology PowerPoint Slide
This business diagram displays three human faces with pie charts. This Power Point template has been designed to compare and present business data. You may use this diagram to impart professional appearance to your presentations.
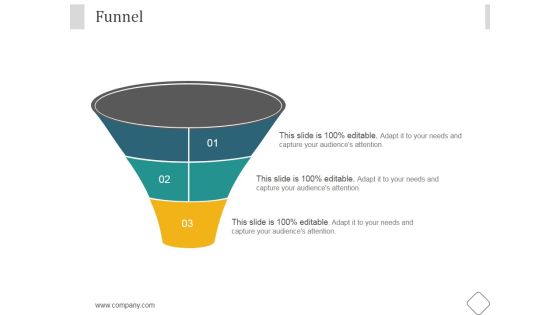
Funnel Ppt PowerPoint Presentation Backgrounds
This is a funnel ppt powerpoint presentation backgrounds. This is a three stage process. The stages in this process are business, marketing, management, funnel, planning.
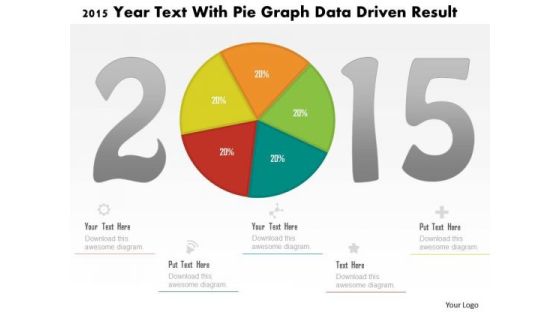
Business Diagram 2015 Year Text With Pie Graph Data Driven Result PowerPoint Slide
This business diagram displays 2015 year numbers with pie chart. This diagram is suitable to display business strategy for year 2015. Download this professional slide to present information in an attractive manner
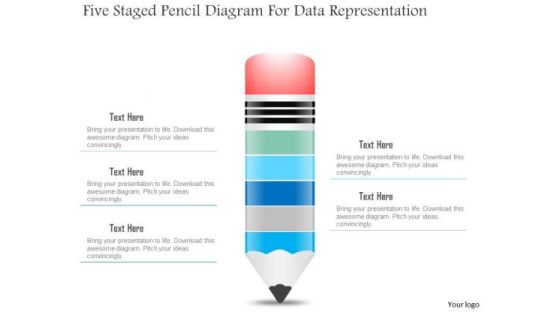
Business Diagram Five Staged Pencil Diagram For Data Representation PowerPoint Slide
This business slide displays five staged pencil diagram. It contains pencil graphic divided into five parts. This diagram slide depicts processes, stages, steps, points, options and education information display. Use this diagram, in your presentations to express your views innovatively.
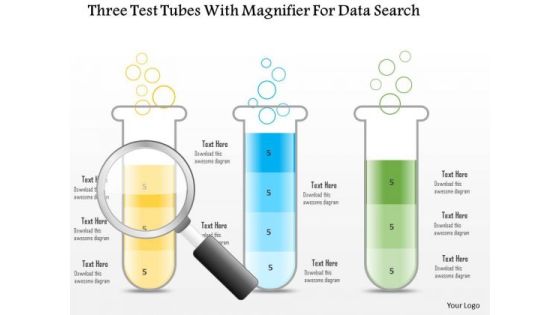
Business Diagram Three Test Tubes With Magnifier For Data Search PowerPoint Slide
This business diagram displays three test tubes with magnifying glass. This diagram is suitable to depict flow of business activities or steps. Download this professional slide to present information in an attractive manner.

Business Diagram Three Trucks For Data Representation For Business PowerPoint Slide
This business diagram displays three trucks graphic. This diagram contains trucks for percentage value growth. Use this diagram to display business growth over a period of time.
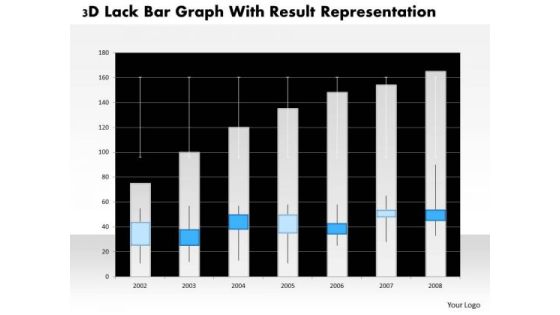
Business Diagram 3d Lack Bar Graph With Result Representation PowerPoint Slide
This business diagram has graphic of 3d lack bar graph. This diagram is a data visualization tool that gives you a simple way to present statistical information. This slide helps your audience examine and interpret the data you present.

Business Diagram Battery Connected With Bulb For Idea Generation PowerPoint Slide
This business slide displays battery icon connected with bulb. This diagram is a data visualization tool that gives you a simple way to present statistical information. This slide helps your audience examine and interpret the data you present.

Business Diagram Human Mind Diagram With Pie Graph For Representation PowerPoint Slide
This diagram displays human face graphic divided into sections. This section can be used for data display. Use this diagram to build professional presentations for your viewers.

Business Diagram Six Staged Pie Charts For Text Representation PowerPoint Slide
This slide displays graphic six staged pie charts. Download this diagram to present and compare business data. Use this diagram to display business process workflows in any presentation.
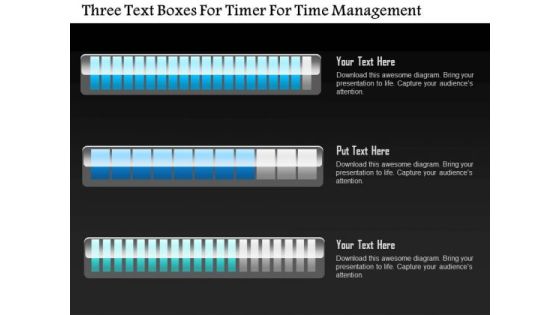
Business Diagram Three Text Boxes For Timer For Time Management PowerPoint Slide
This business diagram displays three text boxes. This diagram contains text boxes for data representation. Use this diagram to display business process workflows in any presentations.
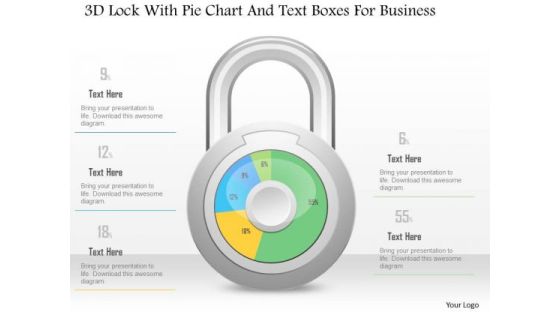
Business Diagram 3d Lock With Pie Chart And Text Boxes For Business PowerPoint Slide
This Power Point diagram has been crafted with pie chart in shape of lock. It contains diagram of lock pie chart to compare and present data in an effective manner. Use this diagram to build professional presentations for your viewers.

Business Diagram 3d Lock With Pie Graph For Result Representation PowerPoint Slide
This Power Point diagram has been crafted with pie chart in shape of lock. It contains diagram of lock pie chart to compare and present data in an effective manner. Use this diagram to build professional presentations for your viewers.

Business Diagram 3d Pencil With Text Boxes For Representation PowerPoint Slide
This Power Point diagram displays graphic of pencil with icons and text spaces. It contains diagram of colorful pencil for data display. Use this diagram to build professional presentations for your viewers.
Business Diagram Human Icons With Bubbles And Different Icons Inside PowerPoint Slide
This diagram displays graph with percentage value growth. This business slide is suitable to present and compare business data. Use this diagram to build professional presentations for your viewers.

Business Diagram Three Staged Pencil Diagram For Graph Formation PowerPoint Slide
This business diagram displays set of pencils. This Power Point template has been designed to compare and present business data. Download this diagram to represent stages of business growth.
Business Diagram Battery Icon With Power Icons Energy Technology PowerPoint Slide
This business diagram displays battery icon with power charging. Use this diagram, in your presentations to display energy saving, battery and technology. Create professional presentations using this diagram slide.
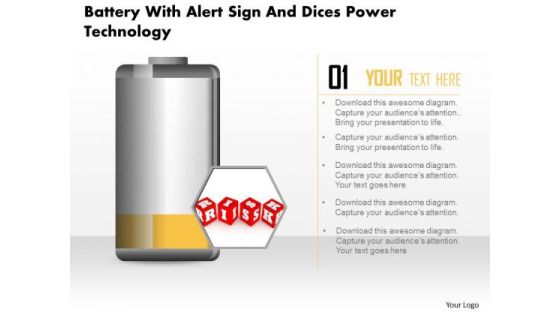
Business Diagram Battery With Alert Sign And Dices Power Technology PowerPoint Slide
This business diagram displays risk alert on battery icon. Use this diagram, in your presentations to display energy saving, battery and technology. Create professional presentations using this diagram slide.
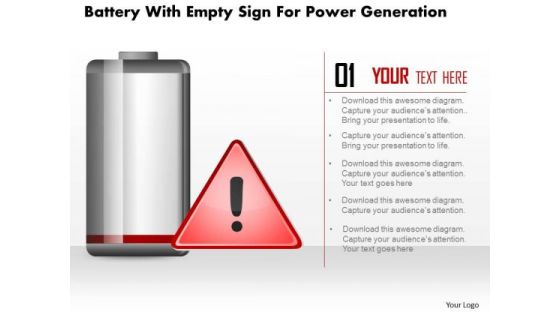
Business Diagram Battery With Empty Sign For Power Generation PowerPoint Slide
This business diagram displays empty sign alert on battery icon. Use this diagram, in your presentations to display energy saving, battery and technology. Create professional presentations using this diagram slide.

Business Diagram Five Staged Timeline Diagram For Business PowerPoint Slide
This PowerPoint template displays five points timeline diagram. This business diagram has been designed with graphic of timeline with five points, text space and start, end points. Use this diagram, in your presentations to display process steps, stages, timelines and business management. Make wonderful presentations using this business slide.
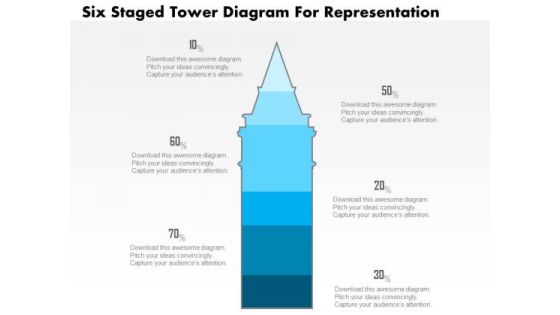
Business Diagram Five Staged Tower Diagram For Representation PowerPoint Slide
This business slide displays five staged tower diagram. It contains blue tower graphic divided into five parts. This diagram slide depicts processes, stages, steps, points, options information display. Use this diagram, in your presentations to express your views innovatively.
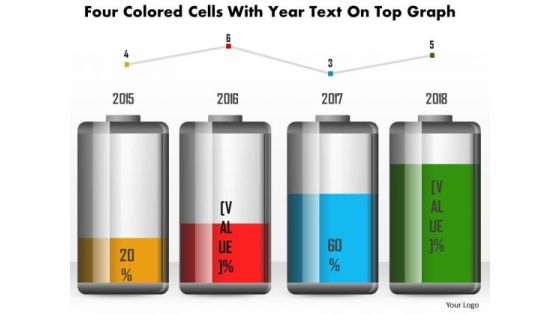
Business Diagram Four Colored Cells With Year Text On Top Graph PowerPoint Slide
This business diagram has been designed with battery cell graphic for business timeline. This slide can be used for business planning and management. Use this diagram for your business and success milestones related presentations.
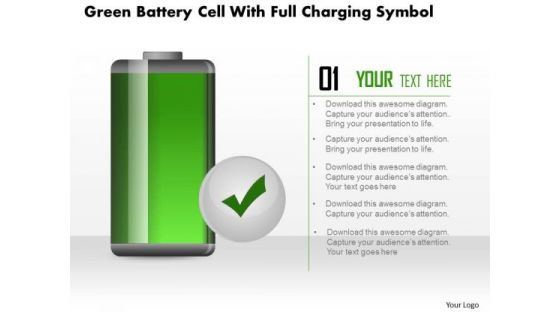
Business Diagram Green Battery Cell With Full Charging Symbol PowerPoint Slide
This business diagram displays full battery charge icon. Use this diagram, in your presentations to display energy saving, battery and technology. Create professional presentations using this diagram slide.

Business Diagram Four Steps With 3d Business Person Standing Over It PowerPoint Slide
This business diagram displays bar graph with business person standing on it. This Power Point template has been designed to display personal growth. You may use this diagram to impart professional appearance to your presentations.

Benefits Of Big Data Ppt PowerPoint Presentation Example 2015
This is a benefits of big data ppt powerpoint presentation example 2015. This is a four stage process. The stages in this process are business, marketing, success, finance, analysis.

Market Trends Percentage Spending By Region Ppt PowerPoint Presentation Picture
This is a market trends percentage spending by region ppt powerpoint presentation picture. This is a seven stage process. The stages in this process are business, marketing, growth, planning, management.
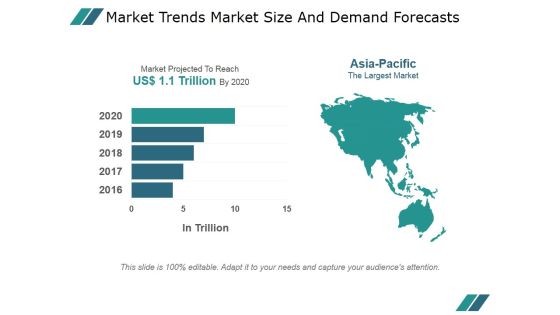
Market Trends Market Size And Demand Forecasts Ppt PowerPoint Presentation Layouts
This is a market trends market size and demand forecasts ppt powerpoint presentation layouts. This is a one stage process. The stages in this process are business, marketing, location, finance, strategy.

Market Trends Markets With Potential For Growth Ppt PowerPoint Presentation Deck
This is a market trends markets with potential for growth ppt powerpoint presentation deck. This is a three stage process. The stages in this process are middle east and africa, asia pacific, the united states.
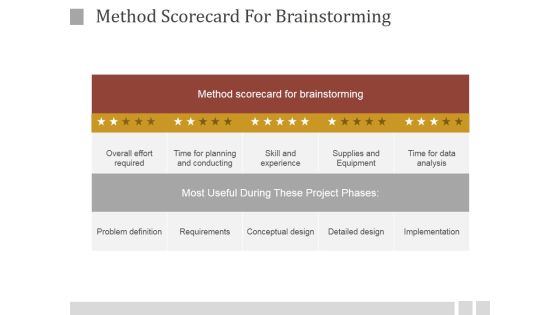
Method Scorecard For Brainstorming Ppt PowerPoint Presentation Visuals
This is a method scorecard for brainstorming ppt powerpoint presentation visuals. This is a five stage process. The stages in this process are method scorecard for brainstorming, overall effort required, time for planning and conducting, skill and experience, supplies and equipment, time for data analysis.
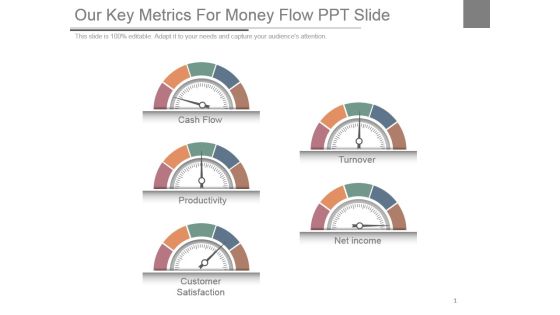
Our Key Metrics For Money Flow Ppt Slide
This is a our key metrics for money flow ppt slide. This is a five stage process. The stages in this process are cash flow, productivity, customer satisfaction, turnover, net income.

Concept Of Revenue Management Ppt Powerpoint Images
This is a concept of revenue management ppt powerpoint images. This is a five stage process. The stages in this process are revenue by division, chart title, total revenue completed target, product, consulting, trading.
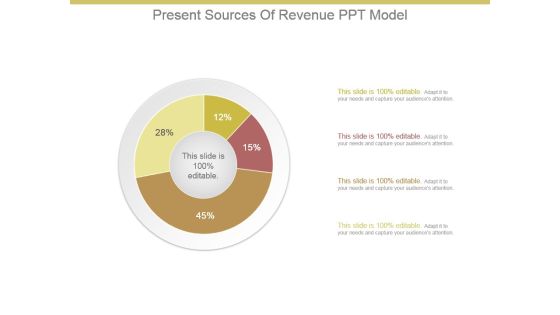
Present Sources Of Revenue Ppt Model
This is a present sources of revenue ppt model. This is a four stage process. The stages in this process are business, marketing, donut, percentage, management.

Revenue Performance Reporting Speedometer Ppt PowerPoint Presentation Visuals
This is a revenue performance reporting speedometer ppt powerpoint presentation visuals. This is a four stage process. The stages in this process are speedometer, measurement, business, marketing, finance.

Customer Service Key Performance Indicators Ppt Example
This is a customer service key performance indicators ppt example. This is a three stage process. The stages in this process are overall satisfaction with service, satisfaction with value for money, overall satisfaction with relationship.
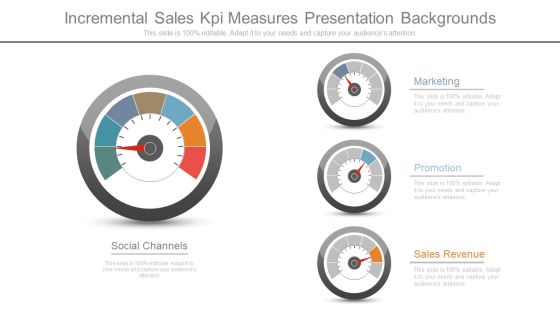
Incremental Sales Kpi Measures Presentation Backgrounds
This is a incremental sales kpi measures presentation backgrounds. This is a four stage process. The stages in this process are marketing, promotion, sales revenue, social channels.
Kpi Tracking Software Services Ppt Powerpoint Graphics
This is a kpi tracking software services ppt powerpoint graphics. This is a three stage process. The stages in this process are operations, revenue, manufacturing.

Benefits Of Big Data Ppt PowerPoint Presentation Inspiration
This is a benefits of big data ppt powerpoint presentation inspiration. This is a four stage process. The stages in this process are increased efficiency, better business decision making, improved customer experience and engagement, achieved financial savings.
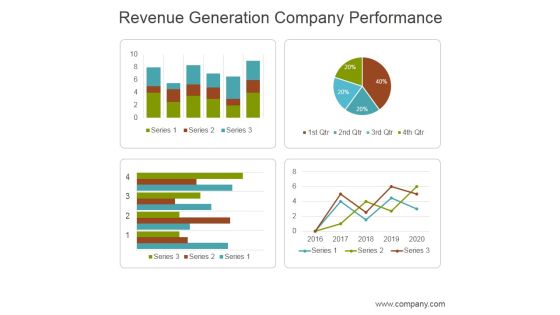
Revenue Generation Company Performance Ppt PowerPoint Presentation Layouts
This is a revenue generation company performance ppt powerpoint presentation layouts. This is a four stage process. The stages in this process are business, marketing, management, revenue, performance.

Portfolio Revision Ppt PowerPoint Presentation Slide
This is a portfolio revision ppt powerpoint presentation slide. This is a two stage process. The stages in this process are current portfolio, new portfolio, data analysis.

Analyze Results Ppt PowerPoint Presentation Slide
This is a analyze results ppt powerpoint presentation slide. This is a two stage process. The stages in this process are analysis, business, marketing, finance, pie chart.
Email Marketing Report Ppt PowerPoint Presentation Icon Graphics Tutorials
This is a email marketing report ppt powerpoint presentation icon graphics tutorials. This is a two stage process. The stages in this process are opens, bounces, unopened, click rate.

Print Media Publication Report Ppt PowerPoint Presentation Slides Files
This is a print media publication report ppt powerpoint presentation slides files. This is a four stage process. The stages in this process are the new york times, the washington post, the wall street journal.
KPI Metrics Vector Icon Ppt PowerPoint Presentation Layouts Slide
This is a kpi metrics vector icon ppt powerpoint presentation layouts slide. This is a three stage process. The stages in this process are kpi proposal, kpi plan, kpi scheme.

 Home
Home