Financial Dashboard
Four Circles With Percentage Values And Icons Powerpoint Slides
This PowerPoint template displays info graphic diagram of linear circles. This diagram may be used to exhibit financial growth and analysis. Grab center stage with this slide and capture the attention of your audience.

Balanced Scorecard Success Layout Ppt Slide Show
This is a balanced scorecard success layout ppt slide show. This is a four stage process. The stages in this process are clinical quality, customer loyalty, financial viability, operational effectiveness.
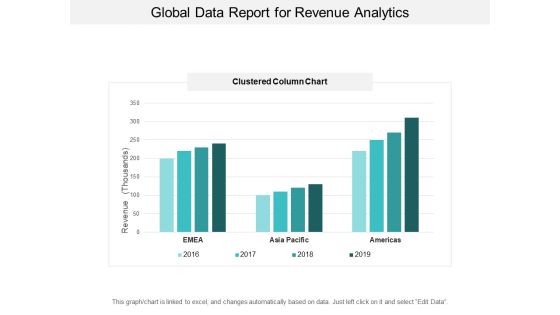
Global Data Report For Revenue Analytics Ppt PowerPoint Presentation Inspiration Visuals
This is a global data report for revenue analytics ppt powerpoint presentation inspiration visuals. This is a four stage process. The stages in this process are financial analysis, quantitative, statistical modelling.

Data Analysis Chart For Funds Management Ppt PowerPoint Presentation Infographic Template Files
This is a data analysis chart for funds management ppt powerpoint presentation infographic template files. This is a five stage process. The stages in this process are financial analysis, quantitative, statistical modelling.

Data Chart For Individual Income Analysis Ppt PowerPoint Presentation Layouts Visual Aids
This is a data chart for individual income analysis ppt powerpoint presentation layouts visual aids. This is a five stage process. The stages in this process are financial analysis, quantitative, statistical modelling.

Quantitative Bar Chart For Data Analysis Ppt PowerPoint Presentation Model Graphic Tips
This is a quantitative bar chart for data analysis ppt powerpoint presentation model graphic tips. This is a two stage process. The stages in this process are financial analysis, quantitative, statistical modelling.

Data Chart For Distribution Of Vehicles By Origin And Type Ppt PowerPoint Presentation Infographics Topics
This is a data chart for distribution of vehicles by origin and type ppt powerpoint presentation infographics topics. This is a four stage process. The stages in this process are financial analysis, quantitative, statistical modelling.
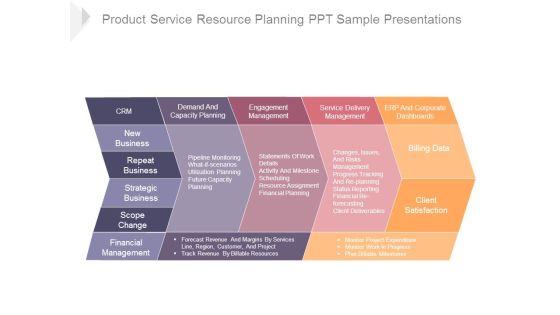
Product Service Resource Planning Ppt Sample Presentations
This is a product service resource planning ppt sample presentations. This is a five stage process. The stages in this process are scope change, strategic business, repeat business, new business, crm, demand and capacity planning, engagement management, service delivery management, erp and corporate dashboards, billing data, client satisfaction, financial management.

Business Model For Opening A Restaurant Table Of Contents Roles Ppt Model Brochure PDF
Deliver an awe inspiring pitch with this creative business model for opening a restaurant table of contents roles ppt model brochure pdf bundle. Topics like business dashboard, operations plan, management team, financial plan, customer segmentation can be discussed with this completely editable template. It is available for immediate download depending on the needs and requirements of the user.

Milestones For The Next Reporting Period Template Ppt PowerPoint Presentation Background Images
This is a milestones for the next reporting period template ppt powerpoint presentation background images. This is a six stage process. The stages in this process are jan, feb, mar, apr, may, jun.
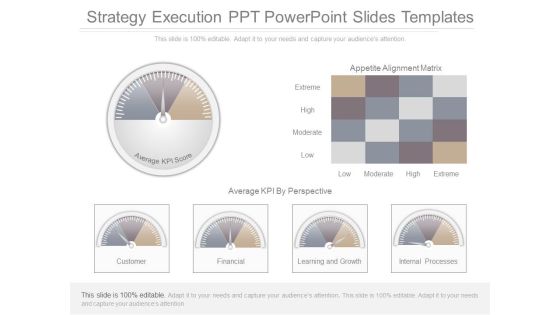
Strategy Execution Ppt Powerpoint Slides Templates
This is a strategy execution ppt powerpoint slides templates. This is a six stage process. The stages in this process are appetite alignment matrix, extreme, high, moderate, low, average kpi by prospective, customer, financial, learning and growth, internal processes, average kpi score.

Addressable Market In Sector 1 Ppt PowerPoint Presentation Outline Shapes
This is a addressable market in sector 1 ppt powerpoint presentation outline shapes. This is a two stage process. The stages in this process are fossil fuels, nuclear, bioenergy, biofuels.
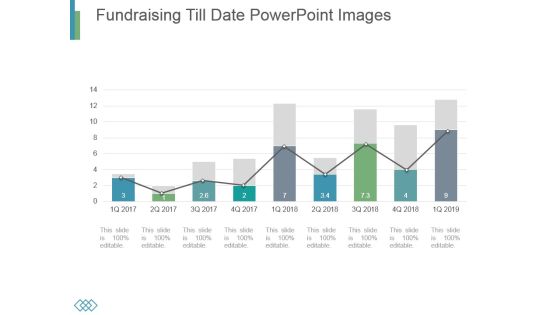
Fundraising Till Date Powerpoint Images
This is a fundraising till date powerpoint images. This is a nine stage process. The stages in this process are business, marketing, growth, timeline, management.

Data Collection And Analysis Control Chart Ppt PowerPoint Presentation Visuals
This is a data collection and analysis control chart ppt powerpoint presentation visuals. This is a ten stage process. The stages in this process are upper limit, centerline, lower limit, plotted points.

Key Performance Indicators Template 2 Ppt PowerPoint Presentation Model Example
This is a key performance indicators template 2 ppt powerpoint presentation model example. This is a four stage process. The stages in this process are objective, measures, targets, invites, indicators.

Last 90 Days Results Ppt PowerPoint Presentation Graphics
This is a last 90 days results ppt powerpoint presentation graphics. This is a five stage process. The stages in this process are new customer ytd, average weekly sales revenue, above sales target i ytd, customer acquisition cost, global performance.
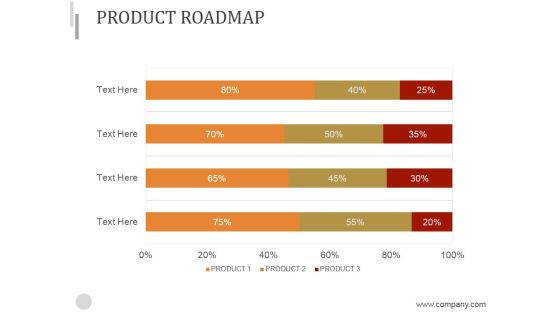
Product Roadmap Ppt PowerPoint Presentation Inspiration
This is a product roadmap ppt powerpoint presentation inspiration. This is a four stage process. The stages in this process are roadmap, finance, strategy, success, management.

Data Collection Histograms Ppt PowerPoint Presentation Design Templates
This is a data collection histograms ppt powerpoint presentation design templates. This is a five stage process. The stages in this process are histogram, business, marketing, analysis, chart.

Data Collection And Analysis Control Chart Ppt PowerPoint Presentation Model Backgrounds
This is a data collection and analysis control chart ppt powerpoint presentation model backgrounds. This is a two stage process. The stages in this process are business, marketing, strategy, finance, analysis.

data collection scatter diagram ppt powerpoint presentation inspiration
This is a data collection scatter diagram ppt powerpoint presentation inspiration. This is a three stage process. The stages in this process are business, planning, marketing, scatter diagram, finance.

Adoption Curve Ppt PowerPoint Presentation Designs
This is a adoption curve ppt powerpoint presentation designs. This is a five stage process. The stages in this process are innovators, early adopters, early majority, late majority, laggards.

data collection and analysis control chart ppt powerpoint presentation styles
This is a data collection and analysis control chart ppt powerpoint presentation styles. This is a one stage process. The stages in this process are upper limit, centerline, plotted points, lower limit, point labels.

Agency Performance Template 2 Ppt PowerPoint Presentation Background Images
This is a agency performance template 2 ppt powerpoint presentation background images. This is a four stage process. The stages in this process are brand safety, viewability, industry snapshot.
Project Health Card Ppt PowerPoint Presentation Icon Grid
This is a project health card ppt powerpoint presentation icon grid. This is a six stage process. The stages in this process are cost, planning, table, project report, data management.

Balance Sheet Kpis Template 3 Ppt PowerPoint Presentation Slides Brochure
This is a balance sheet kpis template 3 ppt powerpoint presentation slides brochure. This is a four stage process. The stages in this process are current assets, current liabilities, total liabilities, total assets.

Cash Flow Statement Kpis Template Ppt PowerPoint Presentation Pictures Diagrams
This is a cash flow statement kpis template ppt powerpoint presentation pictures diagrams. This is a four stage process. The stages in this process are operations, financing activities, investing activities, net increase in cash.

P And L Kpis Template 2 Ppt PowerPoint Presentation Styles Objects
This is a p and l kpis template 2 ppt powerpoint presentation styles objects. This is a four stage process. The stages in this process are revenue, cogs, operating profit, net profit.

P And L Kpis Template 1 Ppt PowerPoint Presentation Model Inspiration
This is a p and l kpis template 1 ppt powerpoint presentation model inspiration. This is a four stage process. The stages in this process are revenue, cogs, operating profit, net profit.
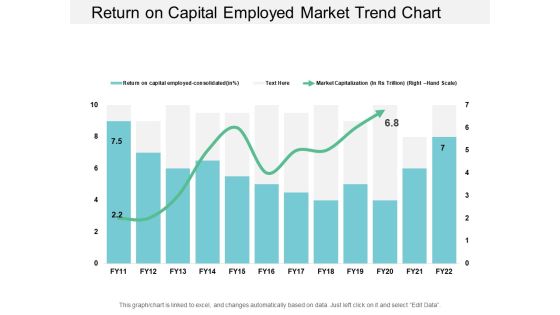
Return On Capital Employed Market Trend Chart Ppt PowerPoint Presentation Styles Examples
This is a return on capital employed market trend chart ppt powerpoint presentation styles examples. This is a two stage process. The stages in this process are accounting ratio, roce, return on capital employed.

Competitive Analysis Report Ppt PowerPoint Presentation Tips
This is a competitive analysis report ppt powerpoint presentation tips. This is a eight stage process. The stages in this process are number of competitors, number of companies that exited, replacement rate industrial cameras, replacement rate frame grabbers, average product development time industrial cameras, average product development time frame grabbers, r and d spend as a per cent of market revenue, marketing spend as a per cent of market revenue.

Weekly Operations Status Report Of Marketing Department Microsoft PDF
Following slide outlines operations status report which can be used by the marketing manager to review the weekly progress. It covers information about the marketing operations activities, accomplishments, potential issues, action steps, etc. Presenting Weekly Operations Status Report Of Marketing Department Microsoft PDF to dispense important information. This template comprises one stages. It also presents valuable insights into the topics including Potential, Accomplishments, Marketing Operations Activities. This is a completely customizable PowerPoint theme that can be put to use immediately. So, download it and address the topic impactfully.

Balance Sheet Kpis Tabular Form Ppt PowerPoint Presentation Show Example Introduction
This is a balance sheet kpis tabular form ppt powerpoint presentation show example introduction. This is a four stage process. The stages in this process are current assets, current liabilities, total assets, total liabilities.

Cash Flow Statement Kpis Tabular Form Ppt PowerPoint Presentation Infographics Professional
This is a cash flow statement kpis tabular form ppt powerpoint presentation infographics professional. This is a four stage process. The stages in this process are operations, financing activities, investing activities, net increase in cash.

Balance Sheet Kpis Template 1 Ppt PowerPoint Presentation Professional Graphics Download
This is a balance sheet kpis template 1 ppt powerpoint presentation professional graphics download. This is a four stage process. The stages in this process are current assets, current liabilities, total assets, total liabilities.

Website Performance Review Template 2 Ppt PowerPoint Presentation Infographics Vector
This is a website performance review template 2 ppt powerpoint presentation infographics vector. This is a three stage process. The stages in this process are conversion rate, return on investment, visits, average visit value, total visits.

Email Marketing Performance Ppt PowerPoint Presentation Infographics Layout Ideas
This is a email marketing performance ppt powerpoint presentation infographics layout ideas. This is a four stage process. The stages in this process are delivery rate, open rate, click rate, conversion rate.
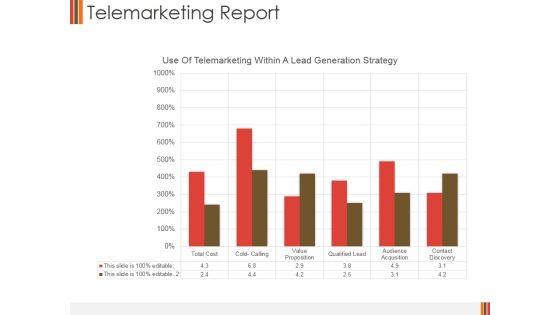
Telemarketing Report Template 2 Ppt PowerPoint Presentation Summary Templates
This is a telemarketing report template 2 ppt powerpoint presentation summary templates. This is a six stage process. The stages in this process are use of telemarketing within a lead generation strategy, fiance, success, management, marketing, strategy.

Telemarketing Report Template 1 Ppt PowerPoint Presentation Professional Skills
This is a telemarketing report template 1 ppt powerpoint presentation professional skills. This is a two stage process. The stages in this process are daily connected calls, inbound calls connected, appointment requested appointment results.
Quality Audit Report Vector Icon Ppt PowerPoint Presentation Slides Graphics PDF
Presenting this set of slides with name quality audit report vector icon ppt powerpoint presentation slides graphics pdf. This is a three stage process. The stages in this process are quality audit report vector icon. This is a completely editable PowerPoint presentation and is available for immediate download. Download now and impress your audience.
Website Performance Review Template 2 Ppt PowerPoint Presentation Icon Design Ideas
This is a website performance review template 2 ppt powerpoint presentation icon design ideas. This is a four stage process. The stages in this process are column two, revenue trends, traffic sources.

Process Optimization Through Product Life Process Management Techniques Company Brochure PDF
This slide highlights KPI dashboard exhibiting overall improvement in the financial performance of company as the consequences of program implementation. Deliver and pitch your topic in the best possible manner with this process optimization through product life process management techniques company brochure pdf Use them to share invaluable insights on showing increase, average purchase value, quarterly scorecard and impress your audience. This template can be altered and modified as per your expectations. So, grab it now.
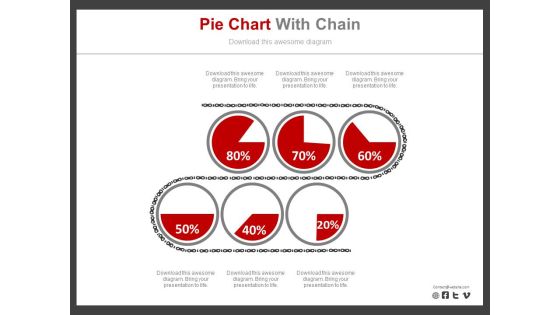
Six Pie Charts For Revenue Analysis Report Powerpoint Slides
Six pie charts have been displayed in this business slide. This business diagram helps to exhibit revenue analysis report. Download this PowerPoint template to build an exclusive presentation.

Marketing Performance Measures Diagram Ppt Example
This is a marketing performance measures diagram ppt example. This is a four stage process. The stages in this process are low, moderate, good, maximum.

Supply Chain Metrics And Kpi Examples Presentation Visuals
This is a supply chain metrics and kpi examples presentation visuals. This is a four stage process. The stages in this process are carrying cost of inventory, inventory turnover, order tracking, rate of return.
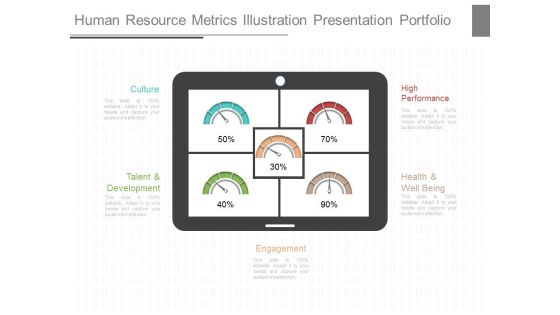
Human Resource Metrics Illustration Presentation Portfolio
This is a human resource metrics illustration presentation portfolio. This is a five stage process. The stages in this process are culture, high performance, talent and development, health and well being, engagement.

Company Cash Flow Statement Over Years Ppt PowerPoint Presentation Gallery
This is a company cash flow statement over years ppt powerpoint presentation gallery. This is ten stage process. The stages in this process are financial result, financial position, share capital, equity share data.

Bar Graph Icon For Data Analysis Ppt PowerPoint Presentation Pictures Ideas
This is a bar graph icon for data analysis ppt powerpoint presentation pictures ideas. This is a four stage process. The stages in this process are financial analysis, quantitative, statistical modelling.

Cash Flow Management Order Control Ppt PowerPoint Presentation Design Ideas
This is a cash flow management order control ppt powerpoint presentation design ideas. This is a five stage process. The stages in this process are management, cash flow management, budget, financial analysis.

Table Of Contents Cyber Safety Incident Management Formats PDF
Presenting table of contents cyber safety incident management formats pdf to provide visual cues and insights. Share and navigate important information on five stages that need your due attention. This template can be used to pitch topics like ensuring financial assets security, leveraging workforce, budget assessment, impact assessment, dashboard . In addtion, this PPT design contains high resolution images, graphics, etc, that are easily editable and available for immediate download.
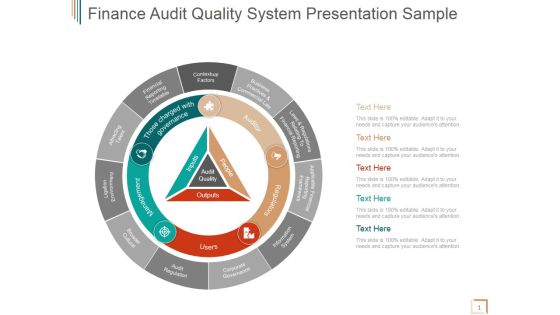
Finance Audit Quality System Ppt PowerPoint Presentation Slides
This is a finance audit quality system ppt powerpoint presentation slides. This is a six stage process. The stages in this process are contextual factors, financial reporting timetable, attracting talent, ligation environment, broader cultural, audit regulation.
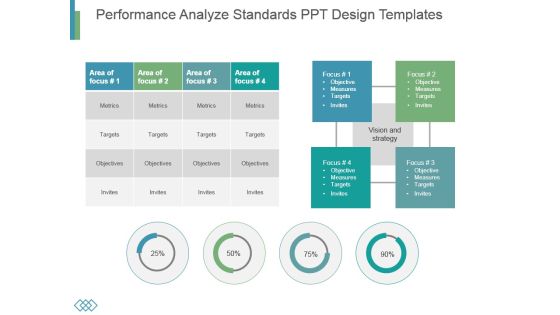
Performance Analyze Standards Ppt Design Templates
This is a performance analyze standards ppt design templates. This is a four stage process. The stages in this process are metrics, targets, objectives, invites.

Organization Key Metrics Summary By Human Resource Team Information PDF
This slide represents the dashboard showing the organizations financial health report prepared by the human resource department of the organization. It includes information related to sales, gross, operating and net profit, income statement, actual vs target sales, net operating cash etc. of the organization.Showcasing this set of slides titled Organization Key Metrics Summary By Human Resource Team Information PDF. The topics addressed in these templates are Organization Key Metrics Summary, Human Resource Team. All the content presented in this PPT design is completely editable. Download it and make adjustments in color, background, font etc. as per your unique business setting.
Magnifying Glass Ppt PowerPoint Presentation Designs Download
This is a magnifying glass ppt powerpoint presentation designs download. This is a two stage process. The stages in this process are magnifying glass, business, marketing, finance, management.

Magnifier Glass Ppt PowerPoint Presentation Inspiration Example
This is a magnifier glass ppt powerpoint presentation inspiration example. This is a four stage process. The stages in this process are magnifying glass, business, marketing, management, planning.
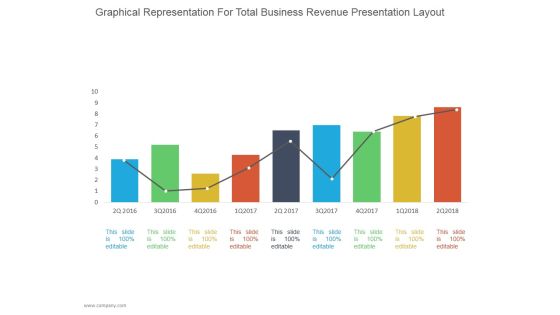
Graphical Representation For Total Business Revenue Ppt PowerPoint Presentation Diagrams
This is a graphical representation for total business revenue ppt powerpoint presentation diagrams. This is a nine stage process. The stages in this process are business, strategy, line chart, bar graph, marketing, management.
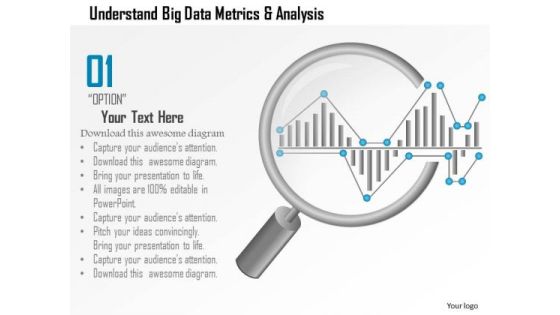
Business Diagram Understand Big Data Metrics And Analysis Showing By Magnifying Glass Ppt Slide
This PPT slide has been designed with big data metrics and magnifying glass. This diagram helps to portray concept of data analysis and data search. Download this diagram to make professional presentations.
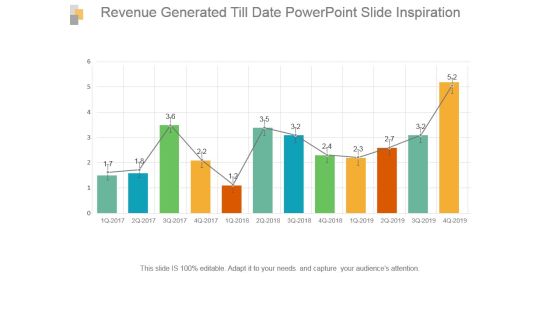
Revenue Generated Till Date Powerpoint Slide Inspiration
This is a revenue generated till date powerpoint slide inspiration. This is a twelve stage process. The stages in this process are bar graph, growth, success, data, analysis.

Donut Ppt PowerPoint Presentation Portfolio Examples
This is a donut ppt powerpoint presentation portfolio examples. This is a four stage process. The stages in this process are business, strategy, analysis, planning, donut, product.
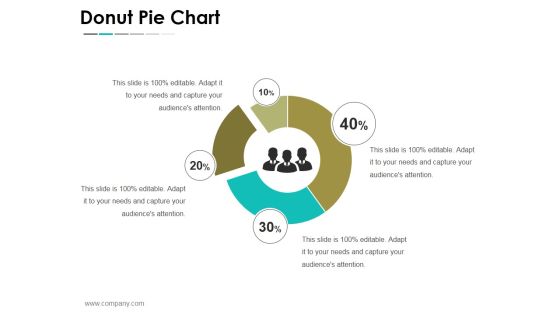
Donut Pie Chart Ppt PowerPoint Presentation File Slideshow
This is a donut pie chart ppt powerpoint presentation file slideshow. This is a four stage process. The stages in this process are business, strategy, analysis, planning, donut pie chart.
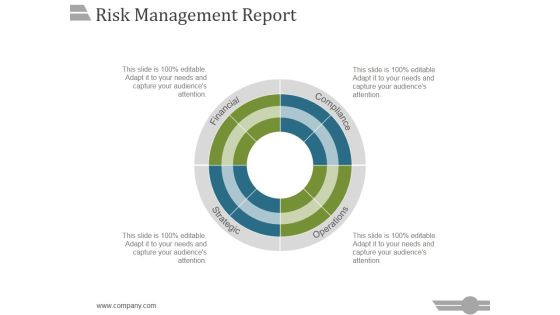
Risk Management Report Template 1 Ppt PowerPoint Presentation Inspiration
This is a risk management report template 1 ppt powerpoint presentation inspiration. This is a four stage process. The stages in this process are financial, compliance, strategic, operations.

 Home
Home