Financial Dashboard

data collection and analysis flow chart ppt powerpoint presentation microsoft
This is a data collection and analysis flow chart ppt powerpoint presentation microsoft. This is a nine stage process. The stages in this process are business, planning, marketing, strategy, management.

Monthly Traffic Source Overview Ppt PowerPoint Presentation Layouts Show
This is a monthly traffic source overview ppt powerpoint presentation layouts show. This is a three stage process. The stages in this process are google, vine press net, yahoo, bing, sources.

Big Data Opportunities And Challenges In Construction Ppt PowerPoint Presentation Outline
This is a big data opportunities and challenges in construction ppt powerpoint presentation outline. This is a three stage process. The stages in this process are finance, management, growth, percentage, business.
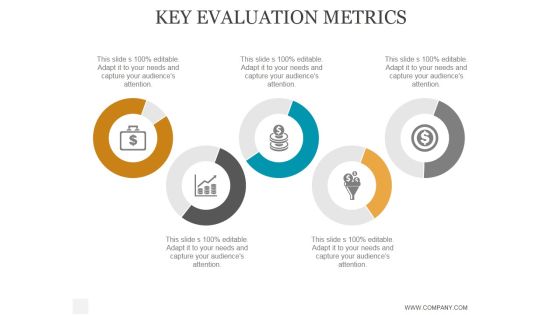
Key Evaluation Metrics Ppt PowerPoint Presentation Portfolio
This is a key evaluation metrics ppt powerpoint presentation portfolio. This is a five stage process. The stages in this process are business, strategy, marketing, analysis, success, icons.

Key Metrics Ppt PowerPoint Presentation Rules
This is a key metrics ppt powerpoint presentation rules. This is a four stage process. The stages in this process are business, strategy, marketing, success, analysis, finance.

Key Evaluation Metrics Ppt PowerPoint Presentation Example File
This is a key evaluation metrics ppt powerpoint presentation example file. This is a five stage process. The stages in this process are business, strategy, marketing, analysis, finance.
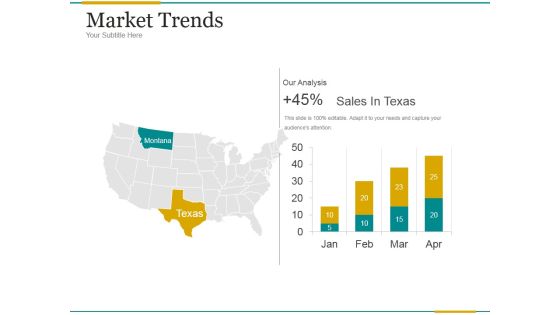
Market Trends Ppt PowerPoint Presentation Samples
This is a market trends ppt powerpoint presentation samples. This is a two stage process. The stages in this process are montana, our analysis, sales in texas.

Pandl Kpis Tabular Form Ppt PowerPoint Presentation Visual Aids
This is a pandl kpis tabular form ppt powerpoint presentation visual aids. This is a four stage process. The stages in this process are revenue, cogs, operating profit, net profit.

Cash Flow Statement Kpis Ppt PowerPoint Presentation Deck
This is a cash flow statement kpis ppt powerpoint presentation deck. This is a four stage process. The stages in this process are operations, financing activities, investing activities, net increase in cash.

Balance Sheet Kpis Tabular Form Ppt PowerPoint Presentation Professional Display
This is a balance sheet kpis tabular form ppt powerpoint presentation professional display. This is a four stage process. The stages in this process are current assets, current liabilities, total assets, total liabilities.

Budget Report Ppt PowerPoint Presentation Outline Examples
This is a budget report ppt powerpoint presentation outline examples. This is a five stage process. The stages in this process are project, amount, expenses, future scheduled, remaining.

Cash Flow Statement Kpis Tabular Form Ppt PowerPoint Presentation Infographics File Formats
This is a cash flow statement kpis tabular form ppt powerpoint presentation infographics file formats. This is a four stage process. The stages in this process are operations, investing activities, financing activities, net increase in cash.

P And L Kpis Template 1 Ppt PowerPoint Presentation Slides Show
This is a p and l kpis template 1 ppt powerpoint presentation slides show. This is a four stage process. The stages in this process are other income, total income, expenses, other expenses, depreciation expense.
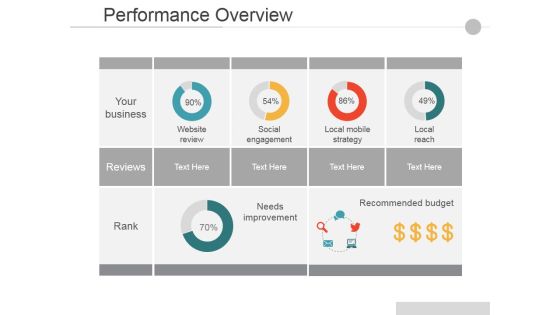
Performance Overview Ppt PowerPoint Presentation Infographic Template Design Ideas
This is a Performance Overview Ppt PowerPoint Presentation Infographic Template Design Ideas. This is a four stage process. The stages in this process are Your Business, Website Review, Social Engagement, Local Mobile Strategy, Local Reach.

Milestones For The Next Reporting Period Ppt PowerPoint Presentation Files
This is a milestones for the next reporting period ppt powerpoint presentation files. This is a seven stage process. The stages in this process are jan, feb, mar, apr, may, jun.

Sales Performance Reporting Ppt PowerPoint Presentation Model Summary
This is a sales performance reporting ppt powerpoint presentation model summary. This is a six stage process. The stages in this process are top selling plans, new customers, top sales reps, sales funnel, sales goal ytd, top opportunities.
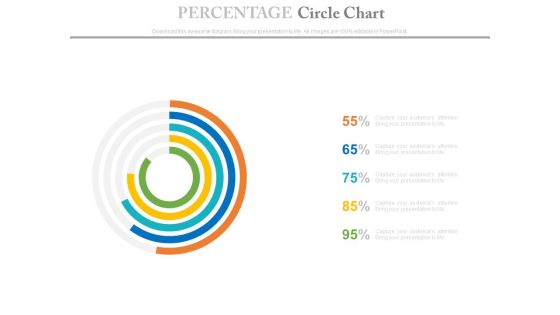
Percentage Data Circle Chart Powerpoint Slides
This PowerPoint template has been designed with circle chart. Download this PPT chart to depict financial ratio analysis. This PowerPoint slide is of great help in the business sector to make realistic presentations and provides effective way of presenting your newer thoughts.

Corporate Security And Risk Management Table Of Contents Corporate Security Summary PDF
This is a corporate security and risk management table of contents corporate security summary pdf template with various stages. Focus and dispense information on five stages using this creative set, that comes with editable features. It contains large content boxes to add your information on topics like ensuring financial assets security, leveraging workforce, budget assessment, dashboard, impact assessment . You can also showcase facts, figures, and other relevant content using this PPT layout. Grab it now.

Data Analytics Ppt PowerPoint Presentation Graphics
This is a data analytics ppt powerpoint presentation graphics. This is a five stage process. The stages in this process are data analysis, business, marketing, success, graph.

Data Analytics Ppt PowerPoint Presentation Themes
This is a data analytics ppt powerpoint presentation themes. This is a five stage process. The stages in this process are business, marketing, presentation, data analyst, management.
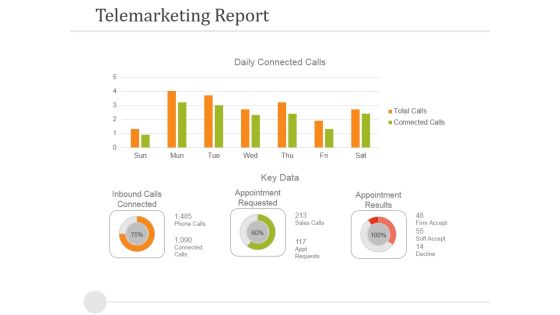
Telemarketing Report Template 1 Ppt PowerPoint Presentation Model Model
This is a telemarketing report template 1 ppt powerpoint presentation model model. This is a two stage process. The stages in this process are inbound calls connected, appointment requested, appointment results, key data.
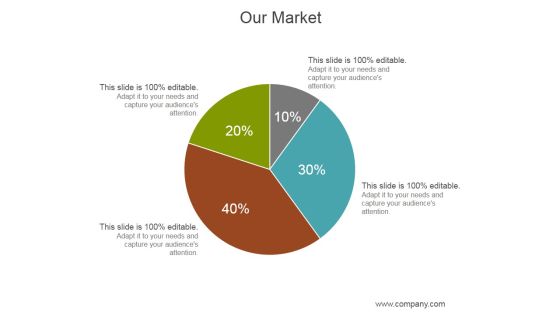
Our Market Ppt PowerPoint Presentation Deck
This is a our market ppt powerpoint presentation deck. This is a four stage process. The stages in this process are business, marketing, management, finance, analysis.

Bar Graph Ppt PowerPoint Presentation Model
This is a bar graph ppt powerpoint presentation model. This is a five stage process. The stages in this process are business, marketing, bar slides, management, finance.

Balance Sheet Kpis Template 1 Ppt PowerPoint Presentation Layouts Design Ideas
This is a balance sheet kpis template 1 ppt powerpoint presentation layouts design ideas. This is a four stage process. The stages in this process are current assets, current liabilities, total assets, total liabilities.

How Much Money We Need Ppt PowerPoint Presentation Outline
This is a how much money we need ppt powerpoint presentation outline. This is a three stage process. The stages in this process are business, marketing, management, production, sales.
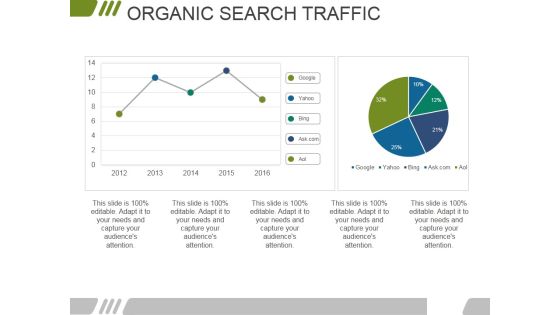
Organic Search Traffic Ppt PowerPoint Presentation Model Slideshow
This is a organic search traffic ppt powerpoint presentation model slideshow. This is a two stage process. The stages in this process are business, marketing, finance, management, organic.

Creating Successful Advertising Campaign Customer Satisfaction Score Graphics PDF
Following slide illustrates customer satisfaction score achieved by the firm in financial year 2019. It includes the statistics of customer satisfaction based on the survey done by the firm. Deliver an awe inspiring pitch with this creative creating successful advertising campaign customer satisfaction score graphics pdf bundle. Topics like customer satisfaction score can be discussed with this completely editable template. It is available for immediate download depending on the needs and requirements of the user.
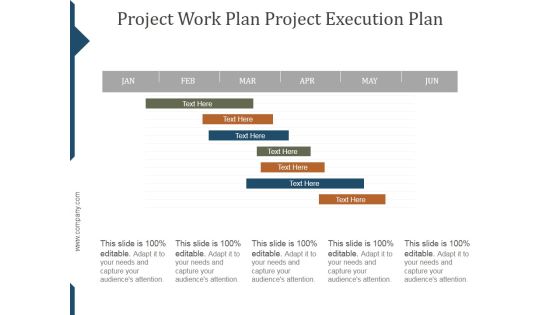
Project Work Plan Project Execution Plan Template Ppt PowerPoint Presentation Styles
This is a project work plan project execution plan template ppt powerpoint presentation styles. This is a seven stage process. The stages in this process are project, management, business, marketing, success.

data collection histograms ppt powerpoint presentation example
This is a data collection histograms ppt powerpoint presentation example. This is a six stage process. The stages in this process are business, planning, marketing, histograms, graph.

Key Performance Indicators Template 3 Ppt PowerPoint Presentation Samples
This is a key performance indicators template 3 ppt powerpoint presentation samples. This is a four stage process. The stages in this process are objective, measures, targets, invites.

Key Performance Indicators Template 2 Ppt PowerPoint Presentation Layouts Portfolio
This is a key performance indicators template 2 ppt powerpoint presentation layouts portfolio. This is a four stage process. The stages in this process are objective, measures, targets, invites.

Last 90 Days Results Ppt PowerPoint Presentation Introduction
This is a last 90 days results ppt powerpoint presentation introduction. This is a six stage process. The stages in this process are revenue, new customers, gross profit, sales comparison.

Acquisition Cost Per Customer Ppt PowerPoint Presentation Example 2015
This is a acquisition cost per customer ppt powerpoint presentation example 2015. This is a three stage process. The stages in this process are rising, steady, falling.
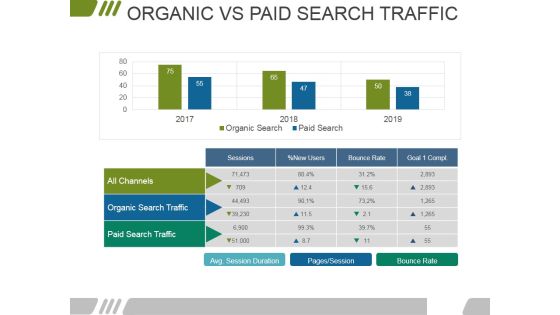
Organic Vs Paid Search Traffic Ppt PowerPoint Presentation Summary Visuals
This is a organic vs paid search traffic ppt powerpoint presentation summary visuals. This is a two stage process. The stages in this process are all channels, organic search traffic, paid search traffic, sessions, bounce rate.
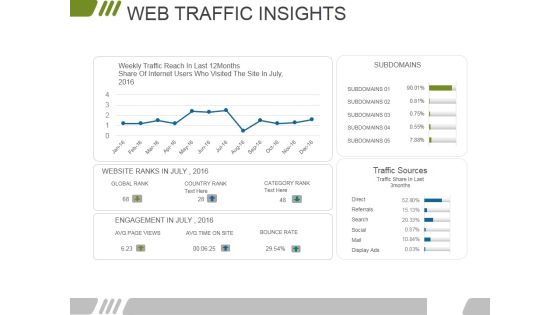
Web Traffic Insights Ppt PowerPoint Presentation Pictures Portrait
This is a web traffic insights ppt powerpoint presentation pictures portrait. This is a four stage process. The stages in this process are subdomains, traffic sources, category rank, country rank, global rank.
Website Performance Review Template 1 Ppt PowerPoint Presentation Slides Icons
This is a website performance review template 1 ppt powerpoint presentation slides icons. This is a three stage process. The stages in this process are online transaction, conversion rate, traffic source, site consumption time, organic branded.

Big Data Opportunities And Challenges Template Ppt PowerPoint Presentation Design Ideas
This is a big data opportunities and challenges template ppt powerpoint presentation design ideas. This is a three stage process. The stages in this process are business, marketing, success, finance, analysis.

Agency Performance Template 2 Ppt PowerPoint Presentation Graphics
This is a agency performance template 2 ppt powerpoint presentation graphics. This is a four stage process. The stages in this process are view ability, ad fraud, industry snapshot, brand safety, tra score.
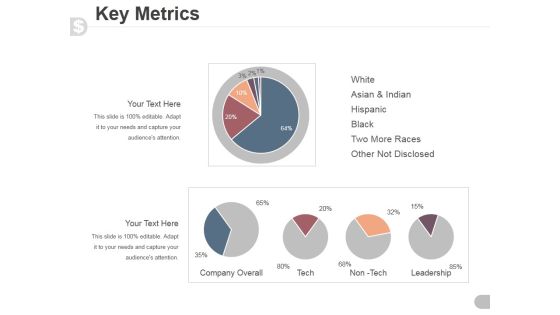
Key Metrics Ppt PowerPoint Presentation Visual Aids
This is a key metrics ppt powerpoint presentation visual aids. This is a five stage process. The stages in this process are white, asian and indian, hispanic, black, two more races, other not disclosed.

Big Data Database Comparison Ppt PowerPoint Presentation Outline
This is a big data database comparison ppt powerpoint presentation outline. This is a four stage process. The stages in this process are business, finance, management, percentage, growth.

Balance Sheet Kpis Ppt PowerPoint Presentation Professional
This is a balance sheet kpis ppt powerpoint presentation professional. This is a four stage process. The stages in this process are current assets, current liabilities, total assets, total liabilities.

Competitive Analysis Scatter Chart Radar Chart Ppt PowerPoint Presentation Infographics
This is a competitive analysis scatter chart radar chart ppt powerpoint presentation infographics. This is a eight stage process. The stages in this process are users interface, data import, example, pricing, support, update, tutorials, easy to use.
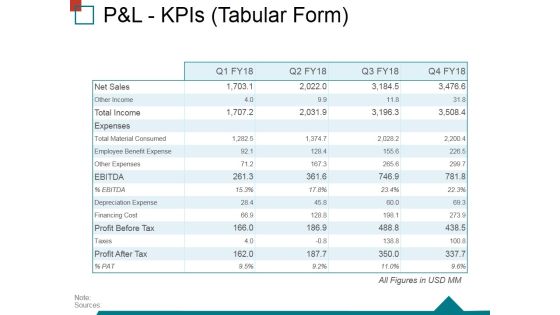
Pandl Kpis Tabular Form Ppt PowerPoint Presentation Ideas Structure
This is a pandl kpis tabular form ppt powerpoint presentation ideas structure. This is a four stage process. The stages in this process are operating profit, revenue, cogs, net profit.

Market Trends Ppt PowerPoint Presentation Model Background Images
This is a market trends ppt powerpoint presentation model background images. This is a two stage process. The stages in this process are our analysis, montana, texas, sales in texas.

Budget Report Ppt PowerPoint Presentation Topics
This is a budget report ppt powerpoint presentation topics. This is a five stage process. The stages in this process are project, incurred, future scheduled, budget, remaining.

Customer Trends Template 1 Ppt PowerPoint Presentation Diagrams
This is a customer trends template 1 ppt powerpoint presentation diagrams. This is a five stage process. The stages in this process are business, marketing, bar graph, finance, management.

Balance Sheet Kpis Tabular Form Ppt PowerPoint Presentation Outline Background Image
This is a balance sheet kpis tabular form ppt powerpoint presentation outline background image. This is a four stage process. The stages in this process are current assets, current liabilities, total assets, total liabilities.

Cash Flow Statement Kpis Tabular Form Ppt PowerPoint Presentation Gallery Good
This is a cash flow statement kpis tabular form ppt powerpoint presentation gallery good. This is a four stage process. The stages in this process are operations, financing activities, investing activities, net increase in cash.

Telemarketing Report Template 2 Ppt PowerPoint Presentation Summary Inspiration
This is a telemarketing report template 2 ppt powerpoint presentation summary inspiration. This is a five stage process. The stages in this process are telemarketing report, business, marketing, success, strategy.
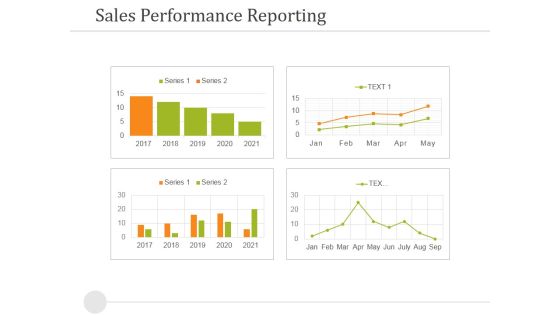
Sales Performance Reporting Ppt PowerPoint Presentation Outline Outfit
This is a sales performance reporting ppt powerpoint presentation outline outfit. This is a four stage process. The stages in this process are sales performance reporting, business, success, strategy, finance.
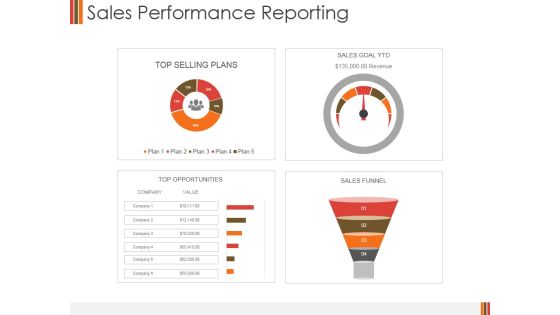
Sales Performance Reporting Ppt PowerPoint Presentation Slides Background Designs
This is a sales performance reporting ppt powerpoint presentation slides background designs. This is a four stage process. The stages in this process are top selling plans, sales goal ytd, top opportunities, sales funnel.

Content Marketing Performance Template 1 Ppt PowerPoint Presentation Infographics Graphics Example
This is a content marketing performance template 1 ppt powerpoint presentation infographics graphics example. This is a eight stage process. The stages in this process are brand awareness, engagement, sales, lead generation, customer retention lead nurturing, upsell.

Demand Forecasting Template 1 Ppt PowerPoint Presentation Styles Gridlines
This is a demand forecasting template 1 ppt powerpoint presentation styles gridlines. This is a four stage process. The stages in this process are trends, qualitative input, base forecast, seasonality factors.

Service Resource Planning Table Ppt Design Templates
This is a service resource planning table ppt design templates. This is a six stage process. The stages in this process are demand and capacity planning, engagement management, service delivery management, erp and corporate dashboards, new business, repeat business, strategic business, scope change, financial management.

Business Data Analysis Chart Comparing Multiple Entities PowerPoint Templates
Analyze Ailments On Our business data analysis chart comparing multiple entities Powerpoint Templates. Bring Out The Thinking Doctor In You. Dock Your Thoughts With Our Financial Analysis . They Will Launch Them Into Orbit.

Table Of Contents Risk Management For Organization Essential Assets Priorities Infographics PDF
This is a table of contents risk management for organization essential assets priorities infographics pdf template with various stages. Focus and dispense information on five stages using this creative set, that comes with editable features. It contains large content boxes to add your information on topics like leveraging workforce, dashboard, impact assessment, budget assessment, ensuring financial assets security. You can also showcase facts, figures, and other relevant content using this PPT layout. Grab it now.

Big Data Benefits Analytics In Healthcare Ppt PowerPoint Presentation Example 2015
This is a big data benefits analytics in healthcare ppt powerpoint presentation example 2015. This is a four stage process. The stages in this process are increased efficiency, better business decision making, improved customer experience and engagement, achieved financial savings.
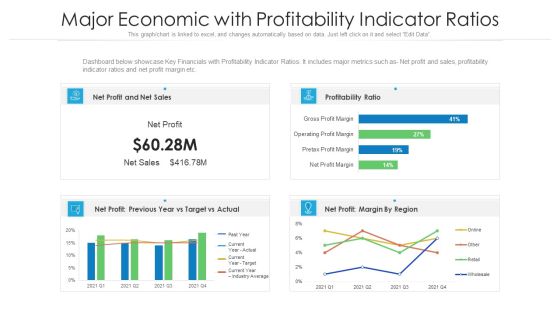
Major Economic With Profitability Indicator Ratios Ppt PowerPoint Presentation Gallery Layouts PDF
Dashboard below showcase Key Financials with Profitability Indicator Ratios. It includes major metrics such as- Net profit and sales, profitability indicator ratios and net profit margin etc. Pitch your topic with ease and precision using this major economic with profitability indicator ratios ppt powerpoint presentation gallery layouts pdf. This layout presents information on sales, profitability ratio, target. It is also available for immediate download and adjustment. So, changes can be made in the color, design, graphics or any other component to create a unique layout.
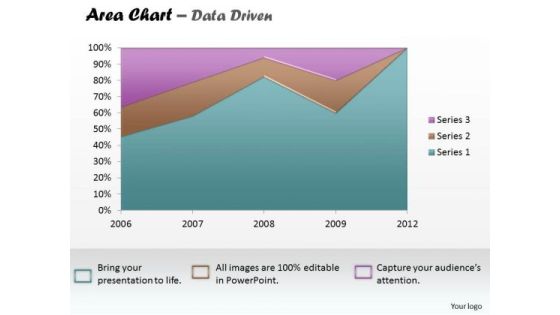
Data Analysis Excel Business Reporting Area Chart PowerPoint Templates
Establish The Dominance Of Your Ideas. Our data analysis excel business reporting area chart Powerpoint Templates Will Put Them On Top.
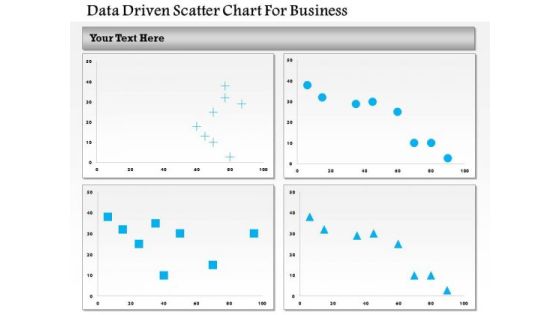
Business Diagram Data Driven Scatter Chart For Business PowerPoint Slide
This business diagram has been designed with four comparative charts. This slide suitable for data representation. You can also use this slide to present business analysis and reports. Use this diagram to present your views in a wonderful manner.

 Home
Home