Financial Chart
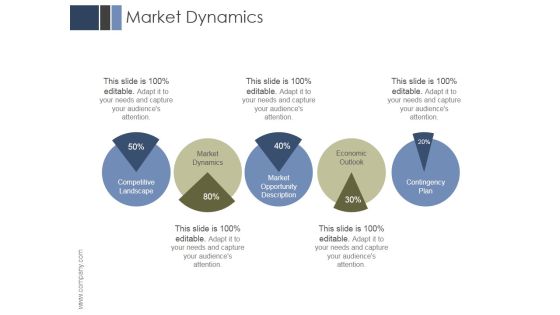
Market Dynamics Ppt PowerPoint Presentation Influencers
This is a market dynamics ppt powerpoint presentation influencers. This is a five stage process. The stages in this process are competitive landscape, market dynamics, market opportunity description, economic outlook, contingency plan.

Customer Centric Business Model Ppt Presentation
This is a customer centric business model ppt presentation. This is a four stage process. The stages in this process are success, arrows, business.
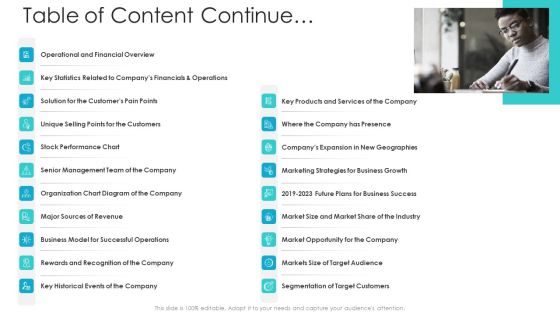
Private Equity Fundraising Pitch Deck Table Of Content Continue Ppt Infographics Example Topics PDF
This is a private equity fundraising pitch deck table of content continue ppt infographics example topics pdf template with various stages. Focus and dispense information on one stage using this creative set, that comes with editable features. It contains large content boxes to add your information on topics like financial overview, organization chart, business model for successful operations, management team, target customers. You can also showcase facts, figures, and other relevant content using this PPT layout. Grab it now.
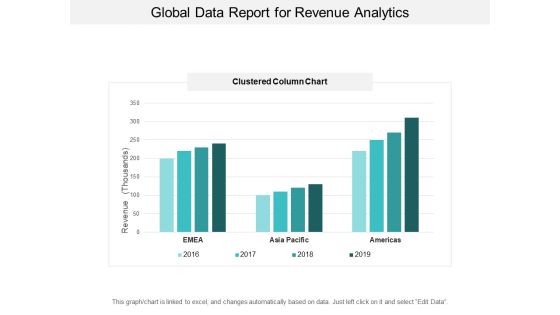
Global Data Report For Revenue Analytics Ppt PowerPoint Presentation Inspiration Visuals
This is a global data report for revenue analytics ppt powerpoint presentation inspiration visuals. This is a four stage process. The stages in this process are financial analysis, quantitative, statistical modelling.
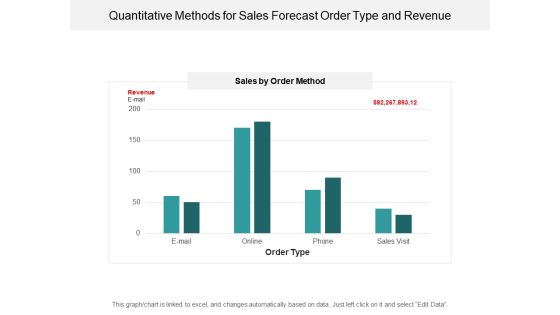
Quantitative Methods For Sales Forecast Order Type And Revenue Ppt PowerPoint Presentation Styles Show
This is a quantitative methods for sales forecast order type and revenue ppt powerpoint presentation styles show. This is a four stage process. The stages in this process are financial analysis, quantitative, statistical modelling.

Area Graph Showing Sales Trends Over Time Ppt PowerPoint Presentation Model Background Designs
This is a area graph showing sales trends over time ppt powerpoint presentation model background designs. This is a three stage process. The stages in this process are financial analysis, quantitative, statistical modelling.

Non-Profit Organization Agency Program Status Report Diagrams PDF
The slide displays program report of non-profit organization for financial analysis. Various pie charts included are total revenue and program expense. Showcasing this set of slides titled Non-Profit Organization Agency Program Status Report Diagrams PDF. The topics addressed in these templates are Total Revenue, Program Expense, Report Indicates. All the content presented in this PPT design is completely editable. Download it and make adjustments in color, background, font etc. as per your unique business setting.

Bar Graph Ppt PowerPoint Presentation Slides Designs
This is a bar graph ppt powerpoint presentation slides designs. This is a five stage process. The stages in this process are bar graph, business, marketing, plan, financial.
Revenue Cost Per Employee Comparison Ppt PowerPoint Presentation Icon Graphics Tutorials
This is a revenue cost per employee comparison ppt powerpoint presentation icon graphics tutorials. This is a two stage process. The stages in this process are revenue and cost per employee comparison, line chart, business, marketing, success,

Data Collection Histograms Ppt PowerPoint Presentation Design Templates
This is a data collection histograms ppt powerpoint presentation design templates. This is a five stage process. The stages in this process are histogram, business, marketing, analysis, chart.
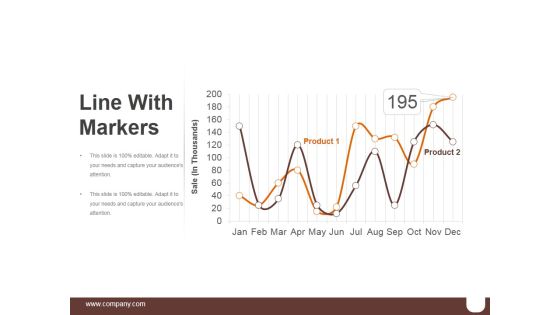
Line With Markers Ppt PowerPoint Presentation Microsoft
This is a line with markers ppt powerpoint presentation microsoft. This is a two stage process. The stages in this process are business, marketing, line chart, finance, management.

Types Of Channel Promotion Used Ppt PowerPoint Presentation Outline Display
This is a types of channel promotion used ppt powerpoint presentation outline display. This is a ten stage process. The stages in this process are bar graph, business, marketing, strategy, charts.
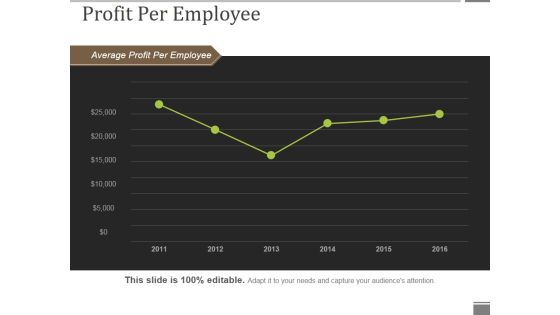
Profit Per Employee Ppt PowerPoint Presentation Show Portfolio
This is a profit per employee ppt powerpoint presentation show portfolio. This is a six stage process. The stages in this process are average profit per employee, line chart, business, marketing, success.

Revenue Split By Product Segment Template 1 Ppt PowerPoint Presentation Summary Example
This is a revenue split by product segment template 1 ppt powerpoint presentation summary example. This is a four stage process. The stages in this process are bar, business, marketing, finance, analysis.

Competitors Analysis 1 Ppt PowerPoint Presentation Outline Templates
This is a competitors analysis 1 ppt powerpoint presentation outline templates. This is a four stage process. The stages in this process are revenue, business, marketing, bar, success.

Current State Analysis Revenue Versus Target Ppt PowerPoint Presentation Model Smartart
This is a current state analysis revenue versus target ppt powerpoint presentation model smartart. This is a two stage process. The stages in this process are actual, target, actual vs target value.

Competitors Analysis 2 Ppt PowerPoint Presentation Slides Gallery
This is a competitors analysis 2 ppt powerpoint presentation slides gallery. This is a four stage process. The stages in this process are revenue, business, marketing, bar, success.

Bar Graph Ppt PowerPoint Presentation Professional Gridlines
This is a bar graph ppt powerpoint presentation professional gridlines. This is a three stage process. The stages in this process are bar, marketing, strategy, planning, growth.

Bar Graph Ppt PowerPoint Presentation Outline Aids
This is a bar graph ppt powerpoint presentation outline aids. This is a four stage process. The stages in this process are bar, graph, finance, marketing, strategy.

External Analysis Industry Trends Ppt PowerPoint Presentation File Outfit
This is a external analysis industry trends ppt powerpoint presentation file outfit. This is a two stage process. The stages in this process are revenue, export, bar, finance, analysis.
Quarter Track Record Ppt PowerPoint Presentation Icon Show
This is a quarter track record ppt powerpoint presentation icon show. This is a two stage process. The stages in this process are business, finance, strategy, marketing, analysis.

Clustered Bar Ppt PowerPoint Presentation Infographic Template Guidelines
This is a clustered bar ppt powerpoint presentation infographic template guidelines. This is a four stage process. The stages in this process are business, marketing, bar, finance, strategy.

Clustered Bar Ppt PowerPoint Presentation Inspiration Objects
This is a clustered bar ppt powerpoint presentation inspiration objects. This is a five stage process. The stages in this process are business, graph, bar, finance, analysis.

Clustered Bar Ppt PowerPoint Presentation Portfolio Clipart
This is a clustered bar ppt powerpoint presentation portfolio clipart. This is a four stage process. The stages in this process are business, strategy, analysis, planning, unit count.

Clustered Bar Ppt PowerPoint Presentation Gallery
This is a clustered bar ppt powerpoint presentation gallery. This is a four stage process. The stages in this process are business, marketing, clustered bar, product, finance.

Clustered Column Template Ppt PowerPoint Presentation Portfolio Deck
This is a clustered column template ppt powerpoint presentation portfolio deck. This is a two stage process. The stages in this process are business, graph, bar, finance, analysis.

Profitability Ratios Template Ppt PowerPoint Presentation Styles Slide
This is a profitability ratios template ppt powerpoint presentation styles slide. This is a two stage process. The stages in this process are net profit ratio, net profit after tax net sales, gross profit ratio, gross profit net sales.

100 Stacked Bar Ppt PowerPoint Presentation Slides Skills
This is a 100 stacked bar ppt powerpoint presentation slides skills. This is a four stage process. The stages in this process are business, marketing, bar, finance, strategy.

Competitors Analysis Template Ppt PowerPoint Presentation Infographic Template Rules
This is a competitors analysis template ppt powerpoint presentation infographic template rules. This is a four stage process. The stages in this process are net profit margin, finance, marketing, bar, success.
Workforce Diversity By Region Ppt PowerPoint Presentation Icon Graphics Pictures
This is a workforce diversity by region ppt powerpoint presentation icon graphics pictures. This is a four stage process. The stages in this process are by region, bar graph, business, presentation, marketing.

Activity Ratios Ppt PowerPoint Presentation Icon Themes
This is a activity ratios ppt powerpoint presentation icon themes. This is a two stage process. The stages in this process are inventory turnover, cogs, average inventory, receivable turnover, net credit sales, average accounts receivable .

Staff Acquisition Cost Cost Per Hire Ppt PowerPoint Presentation Styles Guidelines
This is a staff acquisition cost cost per hire ppt powerpoint presentation styles guidelines. This is a seven stage process. The stages in this process are cost per hire, bar graph, business, marketing, planning.
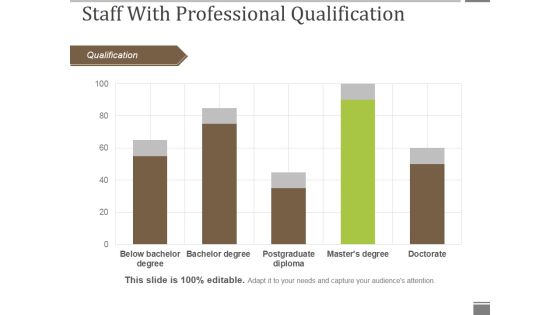
Staff With Professional Qualification Ppt PowerPoint Presentation Gallery Graphics Pictures
This is a staff with professional qualification ppt powerpoint presentation gallery graphics pictures. This is a five stage process. The stages in this process are qualification, bar graph, business, marketing, success.

Workforce Diversity By Age Group Ppt PowerPoint Presentation Visual Aids Gallery
This is a workforce diversity by age group ppt powerpoint presentation visual aids gallery. This is a three stage process. The stages in this process are by age group, bar graph, business, marketing, presentation.

Clustered Column Line Ppt PowerPoint Presentation File Shapes
This is a clustered column line ppt powerpoint presentation file shapes. This is a four stage process. The stages in this process are business, marketing, strategy, bar, success.

Competitors Analysis Ppt PowerPoint Presentation Inspiration Layout Ideas
This is a competitors analysis ppt powerpoint presentation inspiration layout ideas. This is a four stage process. The stages in this process are cost of goods sold, bar, finance, business, marketing, success.

Current Staff Profile Years Of Experience Ppt PowerPoint Presentation File Graphics Tutorials
This is a current staff profile years of experience ppt powerpoint presentation file graphics tutorials. This is a four stage process. The stages in this process are business, marketing, strategy, finance, bar.
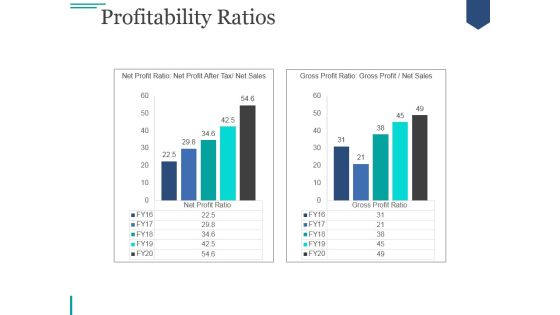
Profitability Ratios Ppt PowerPoint Presentation Infographic Template
This is a profitability ratios ppt powerpoint presentation infographic template. This is a two stage process. The stages in this process are graph, business, marketing, strategy, growth.

Activity Ratios Template 1 Ppt PowerPoint Presentation Outline Design Templates
This is a activity ratios template 1 ppt powerpoint presentation outline design templates. This is a two stage process. The stages in this process are inventory turnover, receivable turnover, graph, success, growth.

Customer Service Benchmarking Template Ppt PowerPoint Presentation Layouts Graphics Template
This is a customer service benchmarking template ppt powerpoint presentation layouts graphics template. This is a four stage process. The stages in this process are business, strategy, marketing, planning, finance.

data collection scatter diagram ppt powerpoint presentation inspiration
This is a data collection scatter diagram ppt powerpoint presentation inspiration. This is a three stage process. The stages in this process are business, planning, marketing, scatter diagram, finance.

Website Performance Review Template Ppt PowerPoint Presentation Information
This is a website performance review template ppt powerpoint presentation information. This is a six stage process. The stages in this process are site consumption time, online transaction, top keywords non branded visits, average visit time.
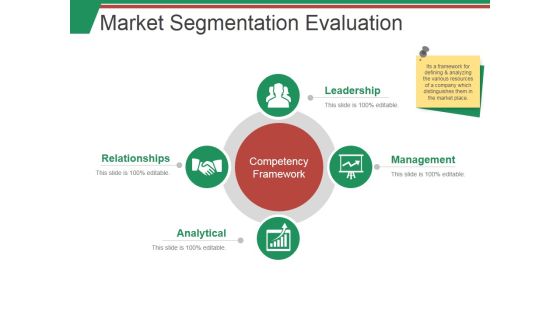
Market Segmentation Evaluation Template 1 Ppt PowerPoint Presentation Summary Smartart
This is a market segmentation evaluation template 1 ppt powerpoint presentation summary smartart. This is a two stage process. The stages in this process are market sales, net profit, beverages, milk product, nutrition.

Activity Ratios Template 3 Ppt PowerPoint Presentation Professional Example
This is a activity ratios template 3 ppt powerpoint presentation professional example. This is a two stage process. The stages in this process are total asset turnover, net sales, fixed assets turnover, fixed assets.

Activity Ratios Template Ppt PowerPoint Presentation Summary Slides
This is a activity ratios template ppt powerpoint presentation summary slides. This is a two stage process. The stages in this process are total asset turnover, net sales, fixed assets turnover, fixed assets.
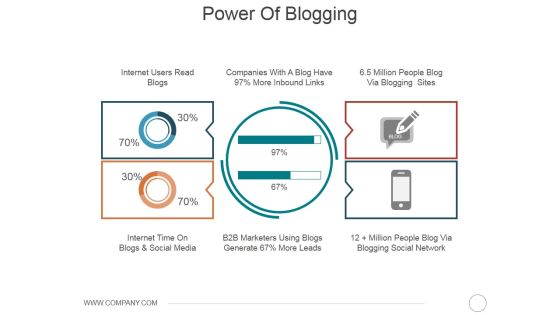
Power Of Blogging Ppt PowerPoint Presentation Model Example Introduction
This is a power of blogging ppt powerpoint presentation model example introduction. This is a five stage process. The stages in this process are finance, business, marketing, analysis, planning.

Competitor Positioning Ppt PowerPoint Presentation Pictures File Formats
This is a competitor positioning ppt powerpoint presentation pictures file formats. This is a two stage process. The stages in this process are business, strategy, analysis, planning, market growth, company growth.

Crm Dashboard Top Customer Ppt PowerPoint Presentation Ideas
This is a crm dashboard top customer ppt powerpoint presentation ideas. This is a five stage process. The stages in this process are customer.
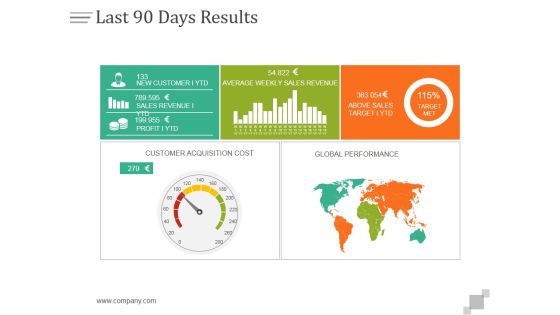
Last 90 Days Results Ppt PowerPoint Presentation Layouts
This is a last 90 days results ppt powerpoint presentation layouts. This is a five stage process. The stages in this process are business, finance, marketing, strategy, analysis, success.
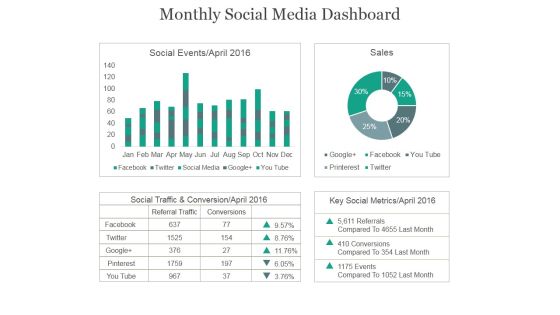
Monthly Social Media Dashboard Ppt PowerPoint Presentation Example 2015
This is a monthly social media dashboard ppt powerpoint presentation example 2015. This is a four stage process. The stages in this process are social events, sales, social traffic, conservation, key social metrics.

Organic Vs Paid Search Traffic Ppt PowerPoint Presentation Show
This is a organic vs paid search traffic ppt powerpoint presentation show. This is a four stage process. The stages in this process are all channels, organic search traffic, paid search traffic, sessions.

Clustered Column Ppt PowerPoint Presentation Deck
This is a clustered column ppt powerpoint presentation deck. This is a two stage process. The stages in this process are business, marketing, clustered column, product, finance.

Stacked Line Ppt PowerPoint Presentation Outline
This is a stacked line ppt powerpoint presentation outline. This is a three stage process. The stages in this process are projects, marketing, stacked line, finance, product.
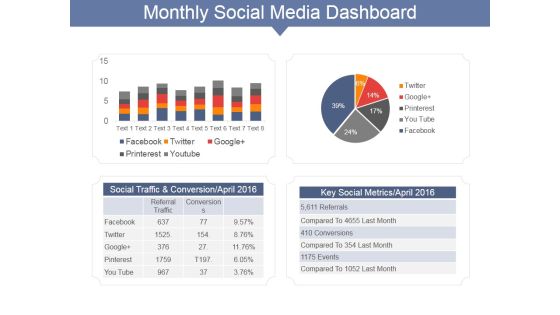
Monthly Social Media Dashboard Ppt PowerPoint Presentation Gallery Show
This is a monthly social media dashboard ppt powerpoint presentation gallery show. This is a two stage process. The stages in this process are social traffic and conversion april, key social metrics april, facebook, twitter.
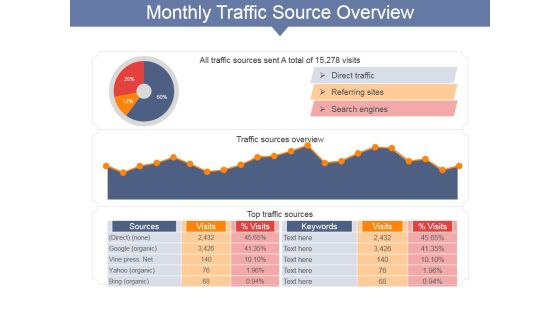
Monthly Traffic Source Overview Ppt PowerPoint Presentation Portfolio Format Ideas
This is a monthly traffic source overview ppt powerpoint presentation portfolio format ideas. This is a three stage process. The stages in this process are direct traffic, referring sites, search engines, sources, keywords.
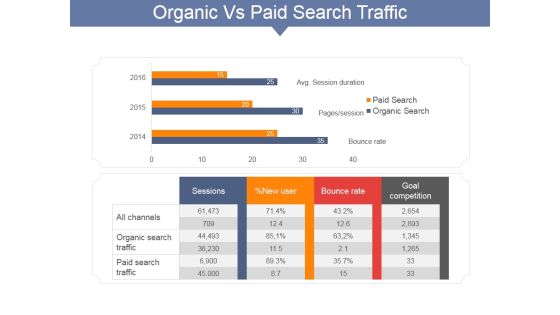
Organic Vs Paid Search Traffic Ppt PowerPoint Presentation Portfolio Master Slide
This is a organic vs paid search traffic ppt powerpoint presentation portfolio master slide. This is a two stage process. The stages in this process are sessions, all channels, organic search traffic, paid search traffic, bounce rate.
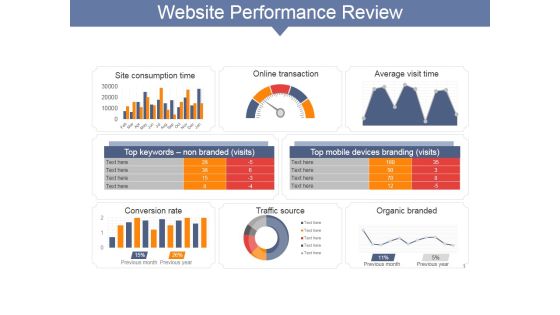
Website Performance Review Ppt PowerPoint Presentation File Visuals
This is a website performance review ppt powerpoint presentation file visuals. This is a eight stage process. The stages in this process are top converting goals, average visit value goal, cost, conversion rate, return on investment, visits .
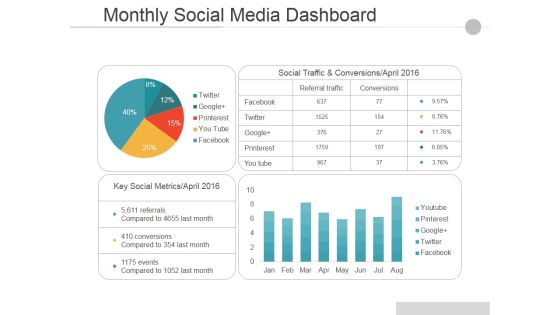
Monthly Social Media Dashboard Ppt PowerPoint Presentation Pictures Guide
This is a monthly social media dashboard ppt powerpoint presentation pictures guide. This is a two stage process. The stages in this process are social traffic and conversions april, key social metrics april, facebook, twitter, google.

Organic Visits And Backlinks Ppt PowerPoint Presentation Inspiration Example Introduction
This is a Organic Visits And Backlinks Ppt PowerPoint Presentation Inspiration Example Introduction. This is a two stage process. The stages in this process are Business, Marketing, Finance, Success, Growth.

Competitor Positioning Ppt PowerPoint Presentation Show Example Introduction
This is a competitor positioning ppt powerpoint presentation show example introduction. This is a two stage process. The stages in this process are market growth, company growth, business, finance, percentage.
 Home
Home