Financial Chart

Profitability Ratios Template 1 Ppt PowerPoint Presentation Outline Information
This is a profitability ratios template 1 ppt powerpoint presentation outline information. This is a two stage process. The stages in this process are net profit ratio, gross profit ratio, net profit after tax, net sales.
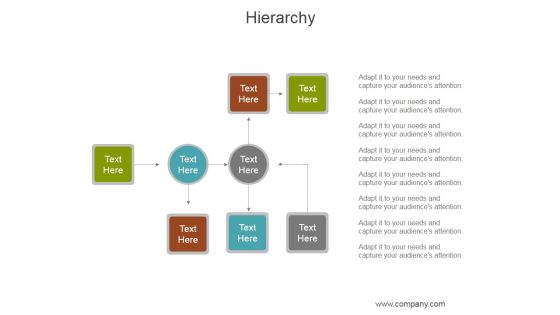
Hierarchy Ppt PowerPoint Presentation Background Image
This is a hierarchy ppt powerpoint presentation background image. This is a eight stage process. The stages in this process are business, marketing, planning, strategy, management.
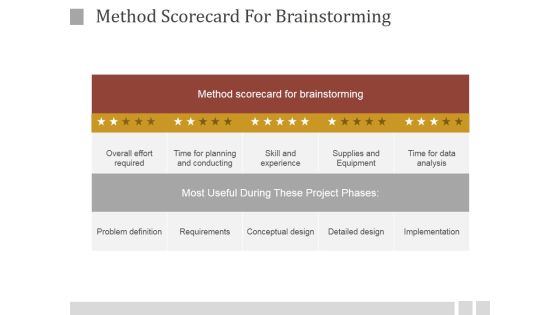
Method Scorecard For Brainstorming Ppt PowerPoint Presentation Visuals
This is a method scorecard for brainstorming ppt powerpoint presentation visuals. This is a five stage process. The stages in this process are method scorecard for brainstorming, overall effort required, time for planning and conducting, skill and experience, supplies and equipment, time for data analysis.

Departments And Team Ppt PowerPoint Presentation Infographics
This is a departments and team ppt powerpoint presentation infographics. This is a three stage process. The stages in this process are product manager, graphic designer, web designer, marketing, ceo.
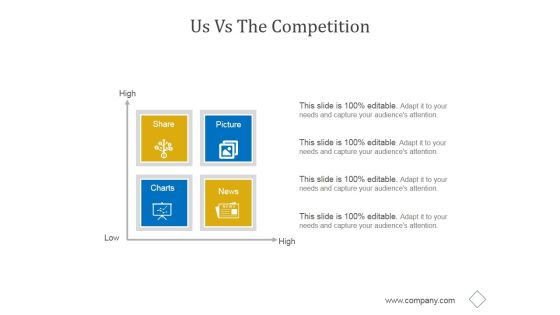
Us Vs The Competition Ppt PowerPoint Presentation Influencers
This is a us vs the competition ppt powerpoint presentation influencers. This is a four stage process. The stages in this process are business, marketing, management, competition, matrix.

Pareto Optimal Portfolio Ppt PowerPoint Presentation Deck
This is a pareto optimal portfolio ppt powerpoint presentation deck. This is a two stage process. The stages in this process are infeasible region, dominated solutions, attribute, utopia point.

Performance Attribution Ppt PowerPoint Presentation Styles
This is a performance attribution ppt powerpoint presentation styles. This is a three stage process. The stages in this process are performance, currency, success, analysis, business, marketing.

Benefits Of Big Data Ppt PowerPoint Presentation Example 2015
This is a benefits of big data ppt powerpoint presentation example 2015. This is a four stage process. The stages in this process are business, marketing, success, finance, analysis.
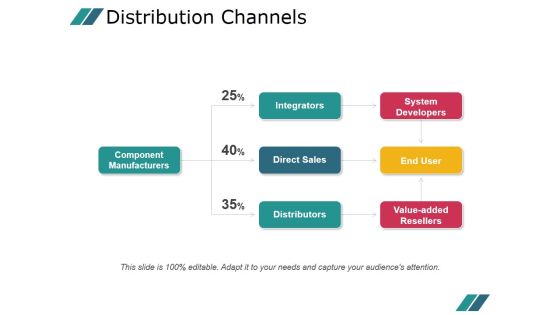
Distribution Channels Ppt PowerPoint Presentation Ideas
This is a distribution channels ppt powerpoint presentation ideas. This is a three stage process. The stages in this process are component manufacturers, integrators, direct sales, distributors, system developers, end user, value added resellers.
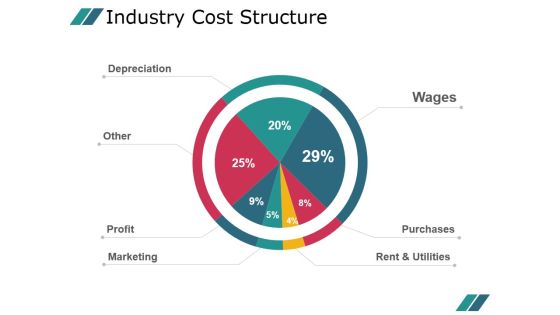
Industry Cost Structure Template 1 Ppt PowerPoint Presentation Example 2015
This is a industry cost structure template 1 ppt powerpoint presentation example 2015. This is a seven stage process. The stages in this process are wages, purchases, rent and utilities, depreciation, other, profit, marketing.
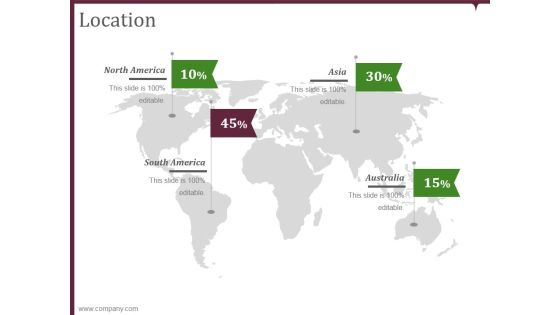
Location Ppt PowerPoint Presentation Tips
This is a location ppt powerpoint presentation tips. This is a four stage process. The stages in this process are north america, south america, asia, australia.

Brand Mentions Ppt PowerPoint Presentation Summary Graphic Images
This is a brand mentions ppt powerpoint presentation summary graphic images. This is a six stage process. The stages in this process are news, comments, blogs, facebook, twitter.
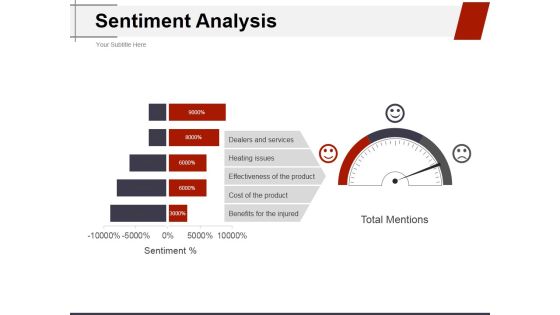
Sentiment Analysis Ppt PowerPoint Presentation Ideas Structure
This is a sentiment analysis ppt powerpoint presentation ideas structure. This is a three stage process. The stages in this process are dealers and services, heating issues, effectiveness of the product, cost of the product, benefits for the injured.

Business Performance Comparison Ppt PowerPoint Presentation Summary
This is a business performance comparison ppt powerpoint presentation summary. This is a two stage process. The stages in this process are business, performance, comparison, presentation, design, diagram.

Dashboard Ppt PowerPoint Presentation Layouts Graphics Pictures
This is a dashboard ppt powerpoint presentation layouts graphics pictures. This is a three stage process. The stages in this process are business, strategy, analysis, planning, dashboard.

Team Goals For Multiple Departments Ppt PowerPoint Presentation Infographics
This is a team goals for multiple departments ppt powerpoint presentation infographic. This is a three stage process. The stages in this process are engineering, product, marketing, sales, support, finance admin.

Dashboard Ppt PowerPoint Presentation Examples
This is a dashboard ppt powerpoint presentation examples. This is a three stage process. The stages in this process are low, medium, high.

Product Sales Volume Ppt PowerPoint Presentation Slide
This is a product sales volume ppt powerpoint presentation slide. This is a five stage process. The stages in this process are business, marketing, product, sales, volume.
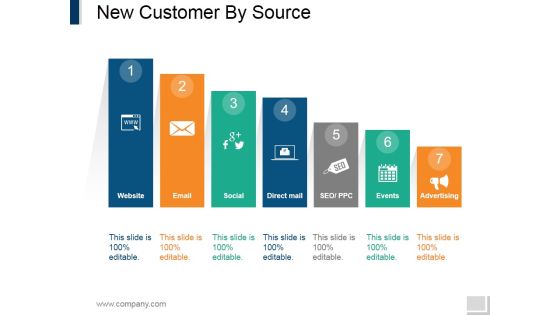
New Customer By Source Ppt PowerPoint Presentation Infographic Template Graphic Tips
This is a new customer by source ppt powerpoint presentation infographic template graphic tips. This is a seven stage process. The stages in this process are website, email, social, direct mail, seo ppc, events, advertising.
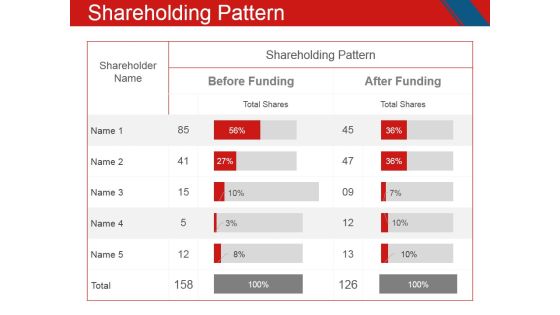
Shareholding Pattern Ppt PowerPoint Presentation Model Microsoft
This is a shareholding pattern ppt powerpoint presentation model microsoft. This is a two stage process. The stages in this process are shareholder name, shareholding pattern, before funding, after funding.

Customer Service Bench Marketing Ppt PowerPoint Presentation Professional Summary
This is a customer service bench marketing ppt powerpoint presentation professional summary. This is a five stage process. The stages in this process are very poor, poor, good, excellent.
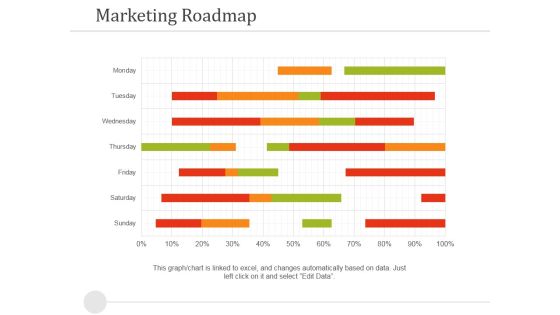
Marketing Roadmap Ppt PowerPoint Presentation Portfolio Examples
This is a marketing roadmap ppt powerpoint presentation portfolio examples. This is a seven stage process. The stages in this process are marketing roadmap, business, marketing, success, strategy, management.

Organic Visits And Backlinks Ppt PowerPoint Presentation Professional Aids
This is a organic visits and backlinks ppt powerpoint presentation professional aids. This is a two stage process. The stages in this process are rank, domain authority, backlinks.

Profitability Ratios Template 2 Ppt PowerPoint Presentation Infographics Layouts
This is a profitability ratios template 2 ppt powerpoint presentation infographics layouts. This is a two stage process. The stages in this process are price to earning ratio, earning per share, market value price per share.
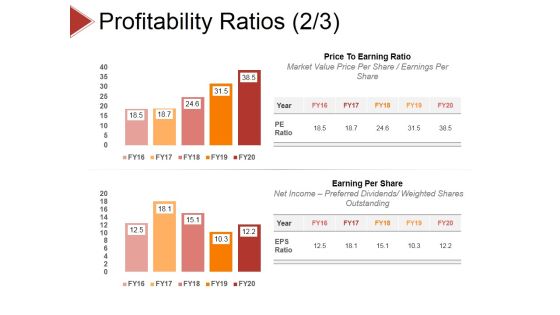
Profitability Ratios Template 3 Ppt PowerPoint Presentation Styles Slide Download
This is a profitability ratios template 3 ppt powerpoint presentation styles slide download. This is a two stage process. The stages in this process are roce, roa, net operating profit, net income.
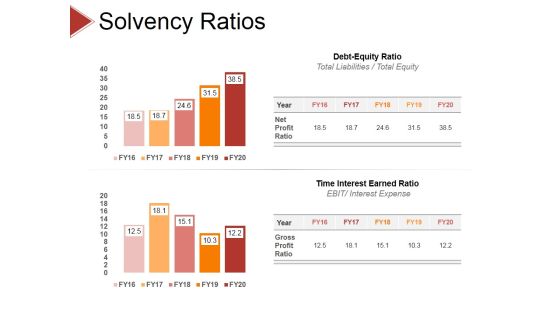
Solvency Ratios Ppt PowerPoint Presentation Model Show
This is a solvency ratios ppt powerpoint presentation model show. This is a two stage process. The stages in this process are debt equity ratio, time interest earned ratio.

Stacked Line With Marker Ppt PowerPoint Presentation Portfolio Gridlines
This is a stacked line with marker ppt powerpoint presentation portfolio gridlines. This is a twelve stage process. The stages in this process are business, strategy, analysis, pretention, stacked bar, finance.

Crowdfunding Statistics Template 1 Ppt PowerPoint Presentation Outline Shapes
This is a crowdfunding statistics template 1 ppt powerpoint presentation outline shapes. This is a seven stage process. The stages in this process are business, strategy, analysis, marketing, crowding portals worldwide.
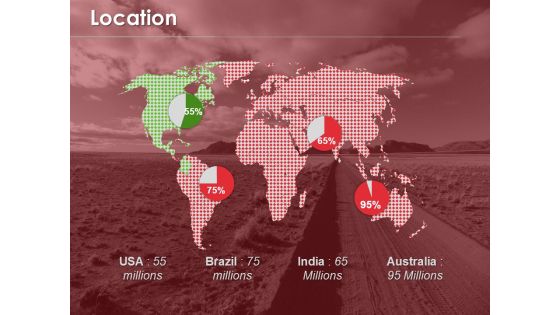
Location Ppt PowerPoint Presentation Gallery Master Slide
This is a location ppt powerpoint presentation gallery master slide. This is a four stage process. The stages in this process are usa, brazil, india, australia.

World Map With Different Company Locations Ppt PowerPoint Presentation Templates
This is a world map with different company locations ppt powerpoint presentation templates. This is a four stage process. The stages in this process are business, strategy, location, map, geography, icons, analysis.

News Paper Ppt PowerPoint Presentation Graphics
This is a news paper ppt powerpoint presentation graphics. This is a one stage process. The stages in this process are business, marketing, newspaper, planning, management.
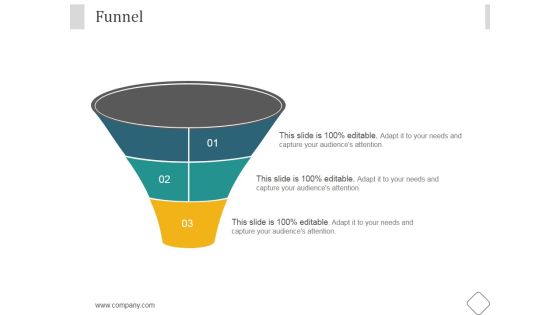
Funnel Ppt PowerPoint Presentation Backgrounds
This is a funnel ppt powerpoint presentation backgrounds. This is a three stage process. The stages in this process are business, marketing, management, funnel, planning.

Dashboard Ppt PowerPoint Presentation Outline Grid
This is a dashboard ppt powerpoint presentation outline grid. This is a two stage process. The stages in this process are business, strategy, analysis, planning, dashboard, finance.
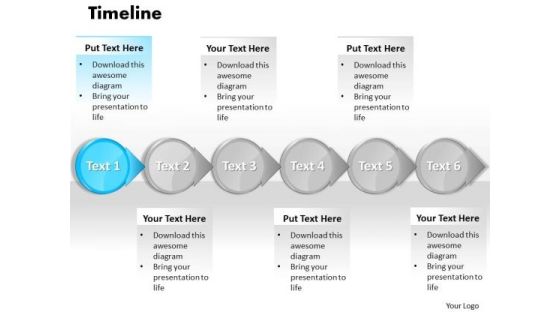
Ppt Levels In A Business Process PowerPoint Presentation Or Timeline Templates
PPT levels in a business process powerpoint presentation or timeline Templates-This diagram can be applied to chronological events and sequence diagrams. Added with an inbuilt text box, they lend a very clear understanding of the arrow diagram.Deliver amazing presentations to mesmerize your audience-PPT levels in a business process powerpoint presentation or timeline Templates-Arrows, Background, Business, Chart, Circle, Circular, Financial, Flow, Graphic, Gray, Icon, Illustration, Isometric, Perspective, Process, Recycle, Round, Shape, Flow, Marketing, Leadership, Steps
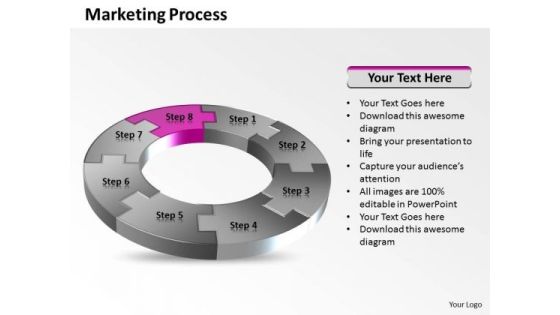
Ppt Leading Eight Create PowerPoint Macro Of Marketing Process Templates
PPT leading eight create powerpoint macro of marketing process Templates-Whether you manage people, projects or events This diagram will meet your all needs. This diagram are suitable for business and technical professionals who need to quickly and easily visualize, explore, and communicate information. -PPT leading eight create powerpoint macro of marketing process Templates-Arrows, Background, Business, Chart, Circle, Circular, Financial, Flow, Graphic, Gray, Icon, Illustration, Isometric, Perspective, Process, Recycle, Round, Shape, Flow, Marketing, Leadership, Steps

Ppt Important Eight PowerPoint Slide Numbers Of Marketing Process Templates
PPT important eight powerpoint slide numbers of marketing process Templates-Maximizing sales of your product is the intended destination. Evolve the strategy to take you down the required path with appropriate, efficient and effective marketing along the way.Activate the minds of your team with your ideas. -PPT important eight powerpoint slide numbers of marketing process Templates-Arrows, Background, Business, Chart, Circle, Circular, Financial, Flow, Graphic, Gray, Icon, Illustration, Isometric, Perspective, Process, Recycle, Round, Shape, Flow, Marketing, Leadership, Steps

Market Trends Percentage Spending By Region Ppt PowerPoint Presentation Picture
This is a market trends percentage spending by region ppt powerpoint presentation picture. This is a seven stage process. The stages in this process are business, marketing, growth, planning, management.
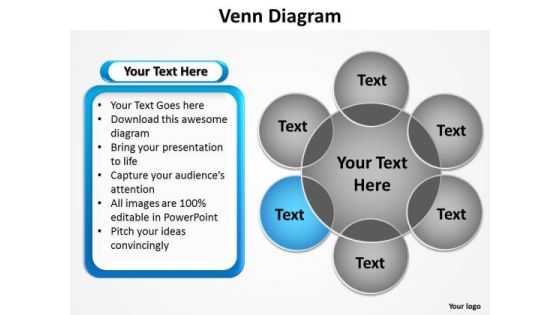
PowerPoint Design Process Venn Diagram Ppt Themes
PowerPoint Design Process Venn Diagram PPT Themes-The Venn graphic comprising interlinking circles geometrically demonstrate how various functions operating independently, to a large extent, are essentially interdependent. Amplify on this basic corporate concept and forefront the benefits of overlapping processes to arrive at common goals.-Background, Black, Blue, Business, Chart, Circle, Diagram, Drop, Financial, Green, Icon, Isolated, Overlapping, Process, Red, Round, Shadow, Shape, Three, Transparency, Vector, Venn, White
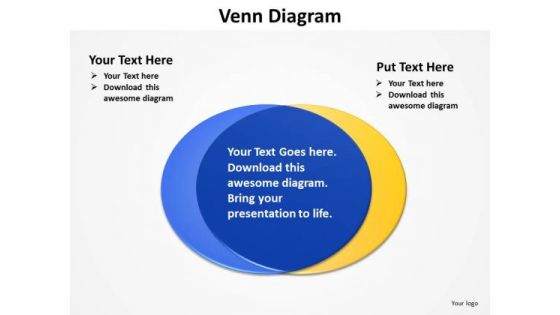
PowerPoint Backgrounds Process Venn Diagram Ppt Template
PowerPoint Backgrounds Process Venn Diagram PPT Template-The Venn graphic comprising interlinking circles geometrically demonstrate how various functions operating independently, to a large extent, are essentially interdependent. Amplify on this basic corporate concept and forefront the benefits of overlapping processes to arrive at common goals.-Background, Black, Blue, Business, Chart, Circle, Diagram, Drop, Financial, Green, Icon, Isolated, Overlapping, Process, Red, Round, Shadow, Shape, Three, Transparency, Vector, Venn, White

PowerPoint Backgrounds Strategy Venn Diagram Ppt Template
PowerPoint Backgrounds Strategy Venn Diagram PPT Template-The Venn graphic comprising interlinking circles geometrically demonstrate how various functions operating independently, to a large extent, are essentially interdependent. Amplify on this basic corporate concept and forefront the benefits of overlapping processes to arrive at common goals.-Background, Black, Blue, Business, Chart, Circle, Diagram, Drop, Financial, Green, Icon, Isolated, Overlapping, Process, Red, Round, Shadow, Shape, Three, Transparency, Vector, Venn, White
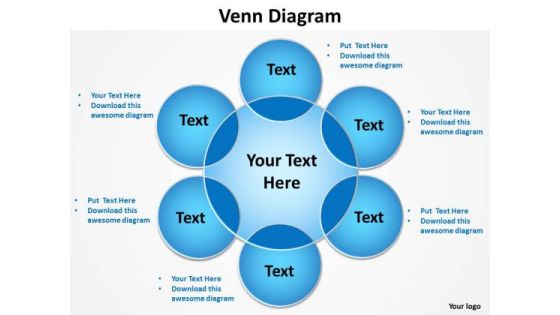
PowerPoint Backgrounds Marketing Venn Diagram Ppt Slide
PowerPoint Backgrounds Marketing Venn Diagram PPT Slide-The Venn graphic comprising interlinking circles geometrically demonstrate how various functions operating independently, to a large extent, are essentially interdependent. Amplify on this basic corporate concept and forefront the benefits of overlapping processes to arrive at common goals.-Background, Black, Blue, Business, Chart, Circle, Diagram, Drop, Financial, Green, Icon, Isolated, Overlapping, Process, Red, Round, Shadow, Shape, Three, Transparency, Vector, Venn, White
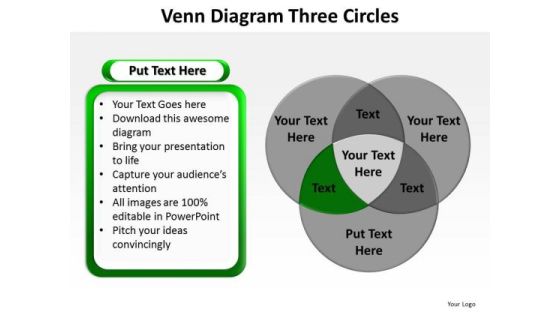
PowerPoint Design Success Venn Diagram Ppt Slides
PowerPoint Design Success Venn Diagram PPT Slides-The Venn graphic comprising interlinking circles geometrically demonstrate how various functions operating independently, to a large extent, are essentially interdependent. Amplify on this basic corporate concept and forefront the benefits of overlapping processes to arrive at common goals.-Background, Black, Blue, Business, Chart, Circle, Diagram, Drop, Financial, Green, Icon, Isolated, Overlapping, Process, Red, Round, Shadow, Shape, Three, Transparency, Vector, Venn, White
PowerPoint Layouts Company Venn Diagram Ppt Design
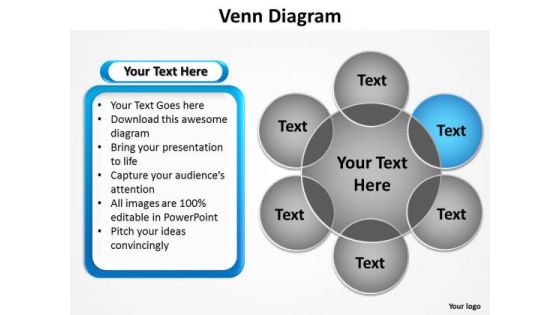
PowerPoint Layouts Company Venn Diagram PPT Design-The Venn graphic comprising interlinking circles geometrically demonstrate how various functions operating independently, to a large extent, are essentially interdependent. Amplify on this basic corporate concept and forefront the benefits of overlapping processes to arrive at common goals.-Background, Black, Blue, Business, Chart, Circle, Diagram, Drop, Financial, Green, Icon, Isolated, Overlapping, Process, Red, Round, Shadow, Shape, Three, Transparency, Vector, Venn, White

PowerPoint Design Slides Process Venn Diagram Ppt Backgrounds
PowerPoint Design Slides Process Venn Diagram PPT Backgrounds-The Venn graphic comprising interlinking circles geometrically demonstrate how various functions operating independently, to a large extent, are essentially interdependent. Amplify on this basic corporate concept and forefront the benefits of overlapping processes to arrive at common goals.-Background, Black, Blue, Business, Chart, Circle, Diagram, Drop, Financial, Green, Icon, Isolated, Overlapping, Process, Red, Round, Shadow, Shape, Three, Transparency, Vector, Venn, White

PowerPoint Layout Education Venn Diagram Ppt Slide Designs
PowerPoint Layout Education Venn Diagram PPT Slide Designs-The Venn graphic comprising interlinking circles geometrically demonstrate how various functions operating independently, to a large extent, are essentially interdependent. Amplify on this basic corporate concept and forefront the benefits of overlapping processes to arrive at common goals.-Background, Black, Blue, Business, Chart, Circle, Diagram, Drop, Financial, Green, Icon, Isolated, Overlapping, Process, Red, Round, Shadow, Shape, Three, Transparency, Vector, Venn, White
Marketing Ppt Template Continuous Illustration Of 6 Issues Business Plan PowerPoint 4 Design
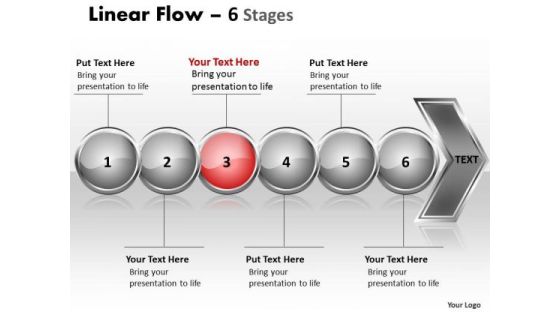
We present our marketing PPT template continuous illustration of 6 issues business plan power point 4 designs. Use our Symbol PowerPoint Templates because, you have it all down to a T. Use our Metaphor PowerPoint Templates because, to go for Gold and not just silver. Use our Arrows PowerPoint Templates because, guaranteed to focus the minds of your team. Use our Spheres PowerPoint Templates because; illustrate your thoughts and experiences to your staff. Use our Business PowerPoint Templates because, Marketing Strategy Business Template:- maximizing sales of your product is the intended destination. Use these PowerPoint slides for presentations relating to arrow background business chart diagram financial flow graphic gray icon illustration linear management orange perspective process reflection spheres stage text. The prominent colors used in the PowerPoint template are Red, Gray, and Black

Marketing Ppt Template Continuous Illustration Of 6 Issues Business Plan PowerPoint 5 Design
We present our marketing PPT template continuous illustration of 6 issues business plan power point 5 designs. Use our Symbol PowerPoint Templates because, the vision of being the market leader is clear to you. Use our Metaphor PowerPoint Templates because, Business ethics is an essential element in your growth. Use our Arrows PowerPoint Templates because; illustrate these thoughts with this slide. Use our Spheres PowerPoint Templates because; illustrate these thoughts with this slide. Use our Business PowerPoint Templates because, Marketing Strategy Business Template: - maximizing sales of your product is the intended destination. Use these PowerPoint slides for presentations relating to arrow background business chart diagram financial flow graphic gray icon illustration linear management orange perspective process reflection spheres stage text. The prominent colors used in the PowerPoint template are Blue, Gray, and Black
Process Ppt Collinear Representation Of 5 Concepts Business Communication PowerPoint 6 Design
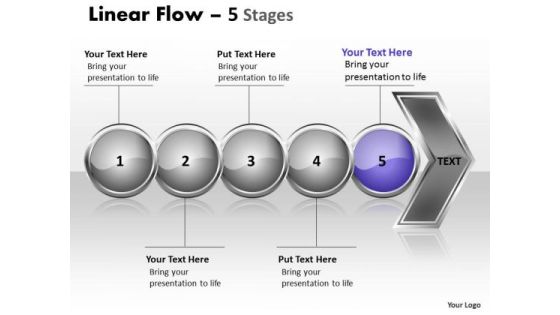
We present our process PPT collinear representation of 5 concepts business communication power point 6 designs. Use our Symbol PowerPoint Templates because, Listen to ideas and thoughts. Use our Metaphor PowerPoint Templates because, Business 3D Circular Puzzle: - Your business and plans for its growth consist of processes that are highly co-related. Use our Arrows PowerPoint Templates because; Outline your targets to your team. Use our Spheres PowerPoint Templates because; Get your listeners to put on their thinking caps. Use our Business PowerPoint Templates because, and watch them strengthen your companys sinews. Use these PowerPoint slides for presentations relating to arrow background business chart diagram financial flow graphic gray icon illustration linear management orange perspective process reflection spheres stage text. The prominent colors used in the PowerPoint template are Purple, White, and Black
Quantitative Data Analysis 3d Interpretation Of Statistical Quality Control PowerPoint Templates
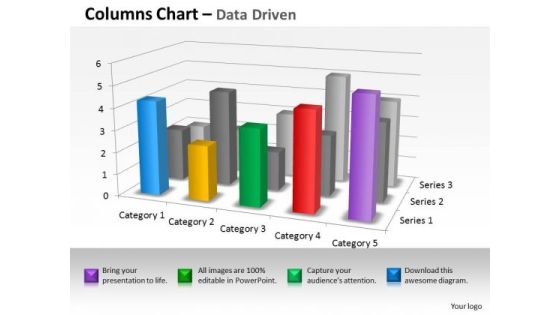
Land The Idea With Our quantitative data analysis 3d interpretation of statistical quality control Powerpoint Templates . Help It Grow With Your Thoughts.

Usa Ppt Background Arrow Create PowerPoint Macro 4 Stage 5 Image
USA PPT Background arrow create powerpoint macro 4 stage 5 Image-Visually support your Microsoft office PPT Presentation with our above template illustrating vertical block list. It is a useful captivating tool conceived to enable you to define your message in your business and finance PPT presentations. Create captivating presentations to deliver comparative and weighted arguments.-USA PPT Background arrow create powerpoint macro 4 stage 5 Image-Arrow, Background, Business, Chart, Diagram, Financial, Graphic, Gray, Icon, Illustration, Management, Orange, Perspective, Planning, Process, Shapes, Metaphor, Stages, Steps, Text

Ppt Vertical 6 Steps Downward PowerPoint Templates
PPT vertical 6 steps downward PowerPoint Templates-This PowerPoint Diagram shows six arrows placed Vertically to give an effective way to present your views. This Diagram can be used to show complex processes. This can be used for Presentations on circuitous, complicated, composite, compound, compounded, confused, conglomerate, convoluted, elaborate, entangled etc. An excellent graphic to attract the attention of your audience to improve earnings.-PPT vertical 6 steps downward PowerPoint Templates-Arrow, Background, Process, Business, Chart, Diagram, Financial, Graphic, Gray, Icon, Illustration, Management, Orange, Perspective, Planning Process, Stages, Steps, Text

Ppt Uniform Demonstration Of 6 Power Point Stage PowerPoint Templates
PPT uniform demonstration of 6 power point stage PowerPoint Templates-Develop competitive advantage with our above Diagram which contains a Picture of six stages organized in Horizontal Manner. It is a useful captivating tool enables you to define your message in your Marketing PPT presentations. You can edit text, color, shade and style as per you need.-PPT uniform demonstration of 6 power point stage PowerPoint Templates-Linear, Flow, Arrow, Background, Process, Business, Chart, Diagram, Financial, Graphic, Gray, Icon, Illustration, Management, Orange, Perspective, Process, Reflection, Stage, Spheres, Text,
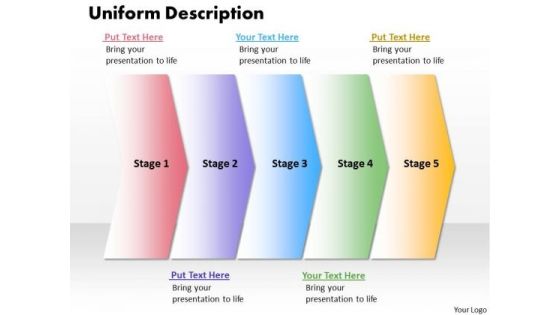
Ppt Uniform Description Of 5 Steps Working With Slide Numbers PowerPoint Templates
PPT uniform description of 5 steps working with slide numbers PowerPoint Templates-The above Diagram displays a picture of five Arrows placed in sequential manner. This image has been professionally designed to emphasize the concept of Operations performed in Circular process. Adjust the above image in your PPT presentations to visually support your content in your Business PPT slideshows.-PPT uniform description of 5 steps working with slide numbers PowerPoint Templates-Linear, Flow, Arrow, Background, Process, Business, Chart, Diagram, Financial, Graphic, Gray, Icon, Illustration, Management, Orange, Perspective, Process, Reflection, Stage, Spheres, Text,
Standard Icon Business Benchmarking Gear Ppt PowerPoint Presentation Complete Deck
Presenting this set of slides with name standard icon business benchmarking gear ppt powerpoint presentation complete deck. The topics discussed in these slides are bar chart, business benchmarking, gear, financial, seo performance. This is a completely editable PowerPoint presentation and is available for immediate download. Download now and impress your audience.

Area Ppt PowerPoint Presentation Themes
This is a area ppt powerpoint presentation themes. This is a two stage process. The stages in this process are area chart, management, growth, strategy, business.

Analyze Results Ppt PowerPoint Presentation Slide
This is a analyze results ppt powerpoint presentation slide. This is a two stage process. The stages in this process are analysis, business, marketing, finance, pie chart.

Cash Market Investor Deck Table Of Content Products Ppt Summary Design Inspiration PDF
Presenting cash market investor deck table of content ppt icon backgrounds pdf to provide visual cues and insights. Share and navigate important information on one stage that need your due attention. This template can be used to pitch topics like financial overview, products and services, business model, organization chart, markets size. In addtion, this PPT design contains high resolution images, graphics, etc, that are easily editable and available for immediate download.
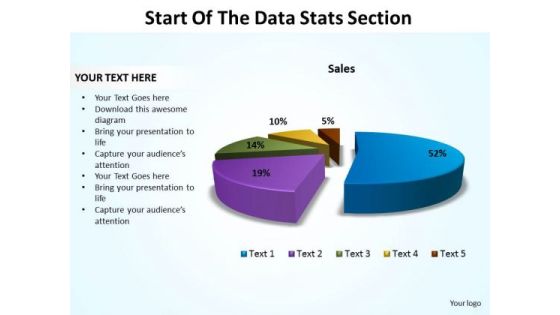
Business Marketing PowerPoint Templates Business Start Of The Data Stats Section Ppt Slides
Business Marketing PowerPoint Templates Business start of the data stats section PPT Slides-This Pie Chart is a simple template that provides a graphical, time-phased overview of a continuing sequence of stages, tasks, or events in a circular flow. You can divide a Pie Chart into segments for illustrating proportion-Business Marketing PowerPoint Templates Business start of the data stats section PPT Slides-This ppt can be used for concepts relating to-3d, Allocate, Allocation, Business, Chart, Circle, Data, Diagram, Divide, Division, Expensive, Financial, Graph Etc.
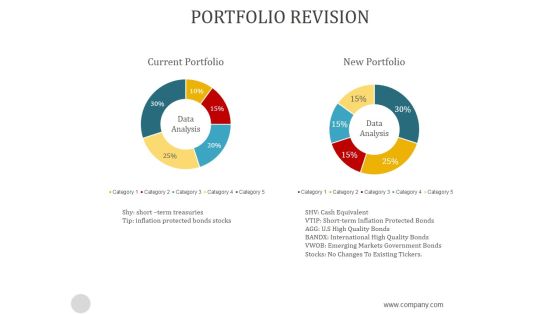
Portfolio Revision Ppt PowerPoint Presentation Template
This is a portfolio revision ppt powerpoint presentation template. This is a two stage process. The stages in this process are data analysis, current portfolio, new portfolio.
Product Launch Budget Plan Ppt PowerPoint Presentation Icon
This is a product launch budget plan ppt powerpoint presentation icon. This is a ten stage process. The stages in this process are software and internet, aerospace and defense, healthcare, consumer, chemicals and energy, industrials, telecom .
 Home
Home