Financial Chart

Business Diagram 3d Pencil With Text Boxes For Representation PowerPoint Slide
This Power Point diagram displays graphic of pencil with icons and text spaces. It contains diagram of colorful pencil for data display. Use this diagram to build professional presentations for your viewers.
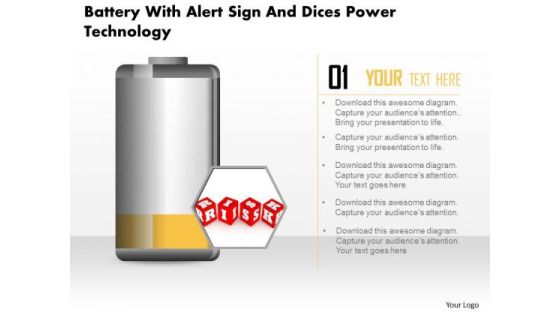
Business Diagram Battery With Alert Sign And Dices Power Technology PowerPoint Slide
This business diagram displays risk alert on battery icon. Use this diagram, in your presentations to display energy saving, battery and technology. Create professional presentations using this diagram slide.
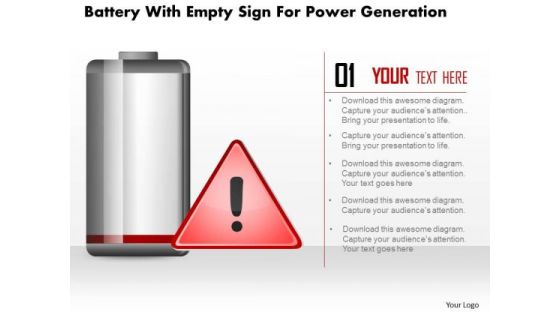
Business Diagram Battery With Empty Sign For Power Generation PowerPoint Slide
This business diagram displays empty sign alert on battery icon. Use this diagram, in your presentations to display energy saving, battery and technology. Create professional presentations using this diagram slide.

Business Diagram Battery Connected With Bulb For Idea Generation PowerPoint Slide
This business slide displays battery icon connected with bulb. This diagram is a data visualization tool that gives you a simple way to present statistical information. This slide helps your audience examine and interpret the data you present.
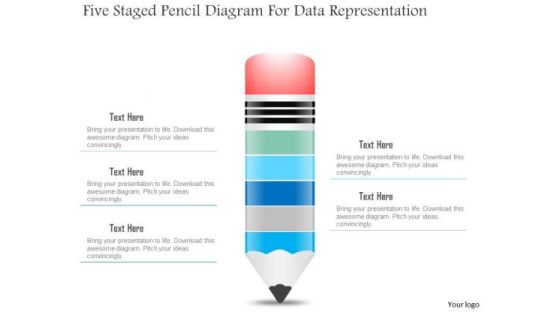
Business Diagram Five Staged Pencil Diagram For Data Representation PowerPoint Slide
This business slide displays five staged pencil diagram. It contains pencil graphic divided into five parts. This diagram slide depicts processes, stages, steps, points, options and education information display. Use this diagram, in your presentations to express your views innovatively.
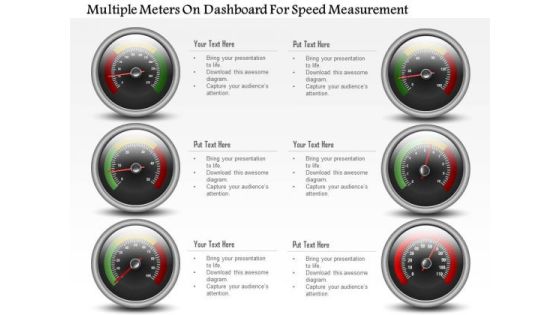
Business Diagram Multiple Meters On Dashboard For Speed Measurement PowerPoint Slide
This business diagram has been designed with multiple meters on dashboard. This slide can be used for business planning and progress. Use this diagram for your business and success milestones related presentations.
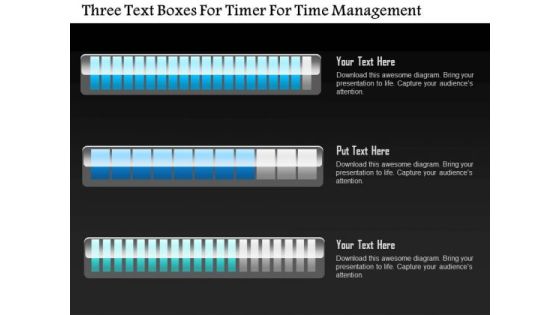
Business Diagram Three Text Boxes For Timer For Time Management PowerPoint Slide
This business diagram displays three text boxes. This diagram contains text boxes for data representation. Use this diagram to display business process workflows in any presentations.

Business Diagram Three Trucks For Data Representation For Business PowerPoint Slide
This business diagram displays three trucks graphic. This diagram contains trucks for percentage value growth. Use this diagram to display business growth over a period of time.
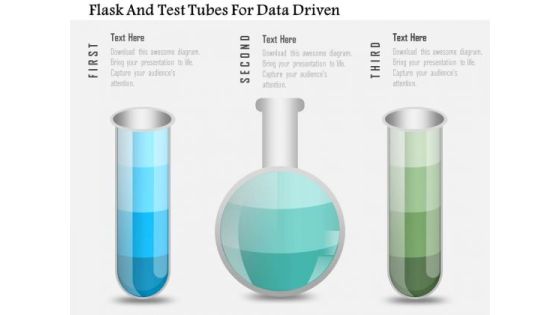
Business Diagram Flask And Test Tubes For Data Driven PowerPoint Slide
This data driven diagram has been designed with flask and test tubes. Download this diagram to give your presentations more effective look. It helps in clearly conveying your message to clients and audience.
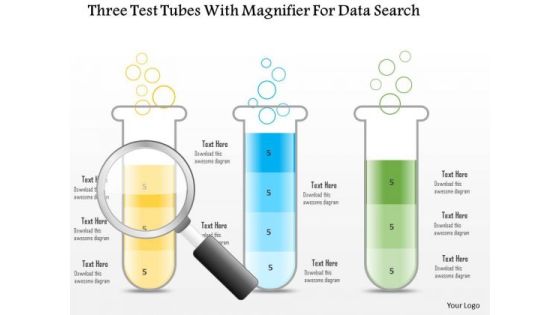
Business Diagram Three Test Tubes With Magnifier For Data Search PowerPoint Slide
This business diagram displays three test tubes with magnifying glass. This diagram is suitable to depict flow of business activities or steps. Download this professional slide to present information in an attractive manner.
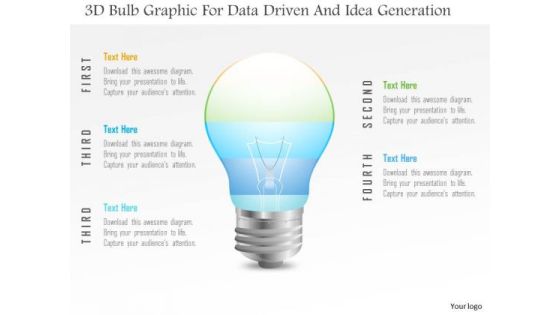
Business Diagram 3d Bulb Graphic For Data Driven And Idea Generation PowerPoint Slide
This Power Point template has been designed with 3d bulb graphic. Use this slide to represent technology idea and strategy concepts. Download this diagram for your business presentations and get exclusive comments on your efforts.
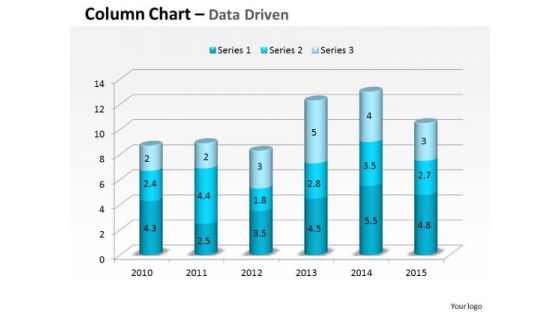
Data Analysis In Excel 3d Compare Yearly Business Performance PowerPoint Templates
Plan For All Contingencies With Our data analysis in excel 3d compare yearly business performance Powerpoint Templates . Douse The Fire Before It Catches.
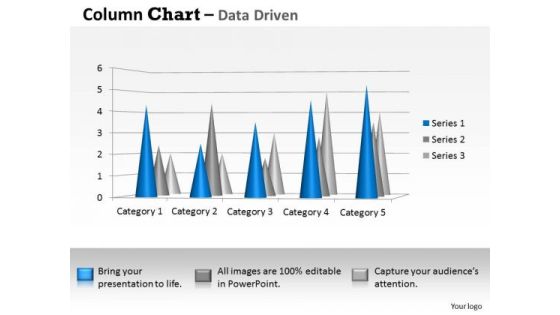
Data Analysis Techniques 3d Distribution Of In Sets PowerPoint Templates
Your Thoughts Will Be The Main Course. Provide The Dressing With Our data analysis techniques 3d distribution of in sets Powerpoint Templates .

Data Analysis Techniques 3d Graphical Presentation Of PowerPoint Templates
Our data analysis techniques 3d graphical presentation of Powerpoint Templates Will Follow The Drill. They Accomplish The Task Assigned To Them.

Examples Of Data Analysis Market 3d Categories Sets PowerPoint Templates
Our examples of data analysis market 3d categories sets Powerpoint Templates Give Your Thoughts Their Due. They Project Them With Full Intensity.
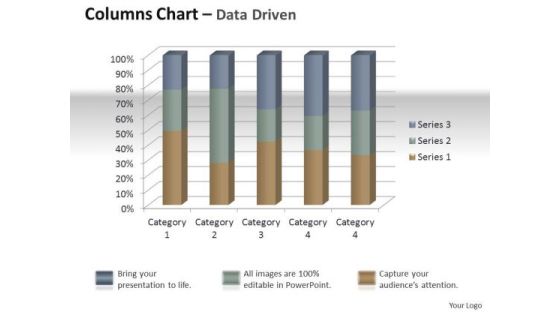
Marketing Data Analysis 3d Quality Control Of Units PowerPoint Templates
Establish Your Dominion With Our marketing data analysis 3d quality control of units Powerpoint Templates . Rule The Stage With Your Thoughts.

Data Analysis On Excel Driven Sets Of Business Information PowerPoint Slides Templates
Break The Deadlock With Our data analysis on excel driven sets of business information powerpoint slides Templates . Let The Words Start To Flow.

Examples Of Data Analysis Market 3d Business Intelligence And PowerPoint Templates
Our examples of data analysis market 3d business intelligence and Powerpoint Templates Are Dual Purpose. They Help Instruct And Inform At The Same Time.
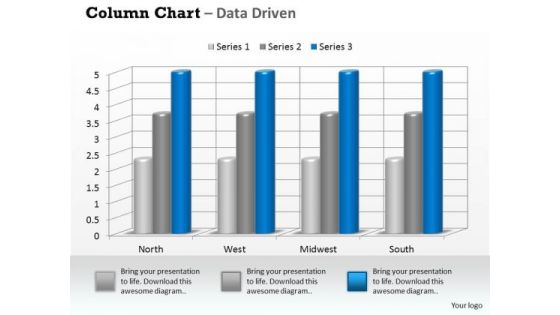
Examples Of Data Analysis Market 3d Business On Regular Intervals PowerPoint Templates
Drum It Out Loud And Clear On Our examples of data analysis market 3d business on regular intervals Powerpoint Templates . Your Words Will Ring In Their Ears.

Examples Of Data Analysis Market Driven Plotting The Business Values PowerPoint Slides Templates
Ring The Duck With Our examples of data analysis market driven plotting the business values powerpoint slides Templates . Acquire The Points With Your Ideas.
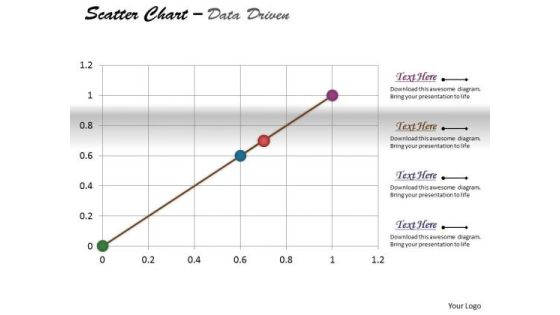
Excel Data Analysis Data Methods Statistical Tool Survey Driven PowerPoint Slides Templates
Be The Duke Of The Dais With Our excel data analysis data methods statistical tool survey driven powerpoint slides Templates . Acquire Royalty Status With Your Thoughts.

Excel Data Analysis Data Tools Data Methods Statistical Driven PowerPoint Slides Templates
There Is No Subject Too Dull For Our excel data analysis data tools data methods statistical driven powerpoint slides Templates . They Will Always Generate Keenness.
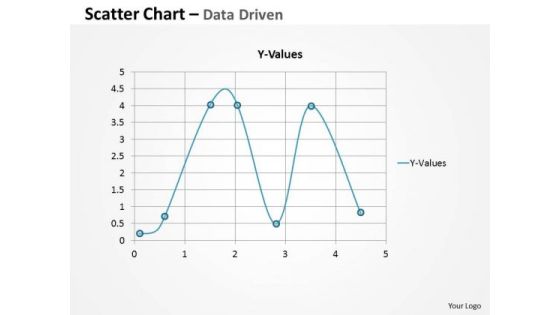
Excel Data Analysis Data Tools Data Methods Statistical Survey Driven PowerPoint Slides Templates
Ask For Assistance From Our excel data analysis data tools data methods statistical survey driven powerpoint slides Templates . You Will Be Duly Satisfied.

Excel Data Analysis Data Tools Data Methods Statistical Tool Survey PowerPoint Slides Templates
Get Out Of The Dock With Our excel data analysis data tools data methods statistical tool survey powerpoint slides Templates . Your Mind Will Be Set Free.

Crm Dashboard Project Management Ppt PowerPoint Presentation Layouts Ideas
This is a crm dashboard project management ppt powerpoint presentation layouts ideas. This is a two stage process. The stages in this process are total projects, projects on hold, overdue projects, available resources, schedule.

Crm Dashboard Leads By Source Ppt PowerPoint Presentation File Graphics Template
This is a crm dashboard leads by source ppt powerpoint presentation file graphics template. This is a four stage process. The stages in this process are online site, exhibition, advertisement, email campaign.
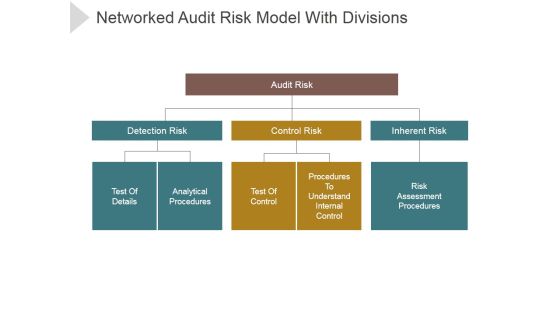
Networked Audit Risk Model With Divisions Ppt PowerPoint Presentation Professional
This is a networked audit risk model with divisions ppt powerpoint presentation professional. This is a three stage process. The stages in this process are audit risk, detection risk, control risk, inherent risk, test of details.
Private Equity Fundraising Investor Presentation Table Of Content Continue Ppt Icon Skills PDF
This is a private equity fundraising investor presentation table of content continue ppt icon skills pdf. template with various stages. Focus and dispense information on one stage using this creative set, that comes with editable features. It contains large content boxes to add your information on topics like stock performance chart, operational and financial overview, markets size of target audience. You can also showcase facts, figures, and other relevant content using this PPT layout. Grab it now.
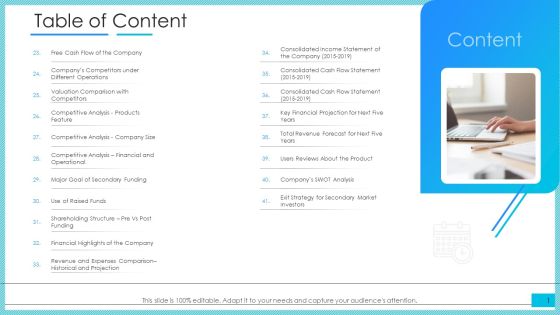
Post Initial Public Offering Investor Pitch Deck Table Of Content Products Themes PDF
This is a post initial public offering investor pitch deck table of content products themes pdf. template with various stages. Focus and dispense information on one stage using this creative set, that comes with editable features. It contains large content boxes to add your information on topics like stock performance chart, operational and financial overview, markets size of target audience. You can also showcase facts, figures, and other relevant content using this PPT layout. Grab it now.

Usa Ppt Theme Linear Flow 2 Phase Diagram Business Communication PowerPoint 3 Image
USA PPT Theme Linear Flow 2 phase diagram business communication powerpoint 3 Image-This diagram allows presenters to illustrate two approaches. Get your listeners to put on their thinking caps. Satiate their need to know with your logical explanations.-USA PPT Theme Linear Flow 2 phase diagram business communication powerpoint 3 Image-Arrow, Background, Business, Chart, Diagram, Financial, Flow, Graphic, Gray, Icon, Illustration, Linear, Management, Orange, Perspective, Process, Reflection, Spheres, Stage, Text

Usa PowerPoint Template Vertical Steps 6 1 Project Management Ppt Image
USA PowerPoint template vertical steps 6 1 project management ppt Image-Vertical diagrams are usually used to represent a process as a list of steps. Constant monitoring of the processes provides you with opportunities to concentrate on the core competencies in your business and improve the standards for more effective results. -USA PowerPoint template vertical steps 6 1 project management ppt Image-Arrow, Background, Business, Chart, Diagram, Financial, Graphic, Gray, Icon, Illustration, Management, Orange, Perspective, Planning, Process, Process, Stages, Steps, Text
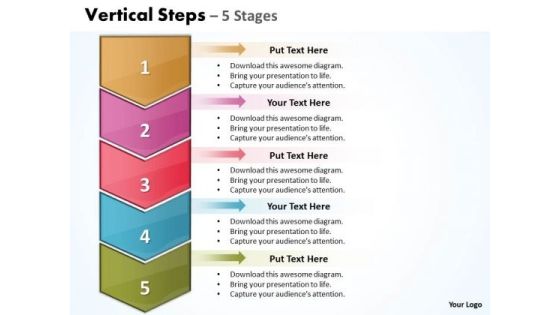
Usa Ppt Vertical Steps Working With Slide Numbers 5 1 Business Plan PowerPoint Graphic
USA PPT vertical steps working with slide numbers 5 1 business plan powerpoint Graphic-Use this diagram to priorities your ideas. Transmit your thoughts via our slide and prod your team to action. Take your team along by explaining your plans.-USA PPT vertical steps working with slide numbers 5 1 business plan powerpoint Graphic-Arrow, Background, Business, Chart, Diagram, Financial, Graphic, Gray, Icon, Illustration, Management, Orange, Perspective, Planning, Process, Process, Stages, Steps, Text

Ppt Vertical Steps Working With Slide Numbers Demonstration PowerPoint Templates
PPT vertical steps working with slide numbers demonstration PowerPoint Templates-This Diagram makes information accessible throughout the organization with a collective, visible view of critical data from different perspectives and providing the tools to upcoming business scenarios and plan for change. This image has been professionally designed to emphasize the concept of sequential process using vertical arrows.-PPT vertical steps working with slide numbers demonstration PowerPoint Templates-Arrow, Background, Process, Business, Chart, Diagram, Financial, Graphic, Gray, Icon, Illustration, Management, Orange, Perspective, Planning Process, Stages, Steps, Text
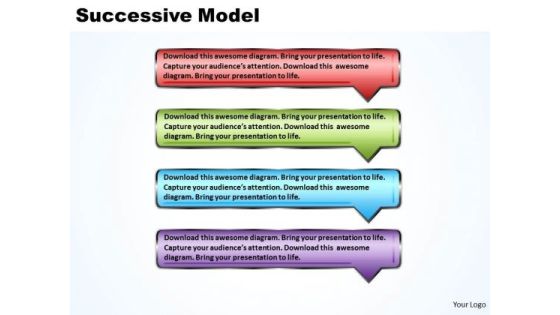
Ppt Successive Model Using 4 Rectangular Circular Arrows PowerPoint 2007 Templates
PPT successive model using 4 rectangular circular arrows powerpoint 2007 Templates-In case you need to graphically display Linear processes you could use these Circular Scheme PPT Slides. It will be helpful for presentations on stages of business processes, business plan from start to the achievement, etc.-PPT successive model using 4 rectangular circular arrows powerpoint 2007 Templates-Arrow, Background, Process, Business, Chart, Diagram, Financial, Graphic, Gray, Icon, Illustration, Management, Orange, Perspective, Planning Process, Stages, Steps, Text
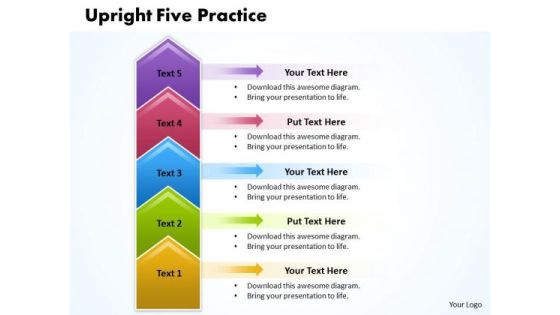
Ppt Upright 5 Practice The PowerPoint Macro Steps Representation Templates
PPT upright 5 practice the powerpoint macro steps representation Templates-In case you need to graphically display Linear processes you could use these Arrow Scheme PPT Slides. It will be helpful for presentations on stages of business processes, business plan from start to the achievement, etc.-PPT upright 5 practice the powerpoint macro steps representation Templates-Arrow, Background, Process, Business, Chart, Diagram, Financial, Graphic, Gray, Icon, Illustration, Management, Orange, Perspective, Planning Process, Stages, Steps, Text
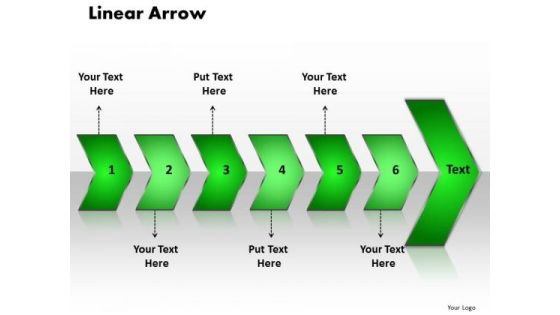
Ppt 6 Linear Circular Arrows PowerPoint 2010 Placed Horizontally Templates
PPT 6 linear circular arrows powerpoint 2010 placed horizontally Templates-Diagrams for PowerPoint Circle arrow offer an elegant alternative to the boring bullet points used in Presentations. You can portray specific models like Analyze, Plan, Implement and Review model, Waterfall model or any other customized processes.-PPT 6 linear circular arrows powerpoint 2010 placed horizontally Templates-Arrow, Background, Business, Chart, Diagram, Financial, Graphic, Gray, Icon, Illustration, Management, Orange, Perspective, Process, Reflection, Stage, Text, Transparency
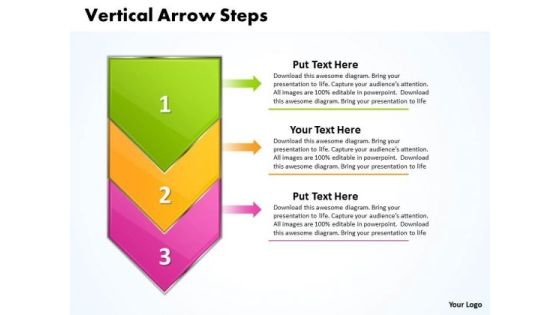
Ppt Vertical Arrow Steps Working With Slide Numbers Description PowerPoint Templates
PPT vertical arrow steps working with slide numbers description PowerPoint Templates-Emphatically define your message with our above Diagram which contains a graphic of Process with its components defined vertically downwards. It symbolizes affiliation, affinity, alliance, association, connection etc. It consists of three colorful stages.-PPT vertical arrow steps working with slide numbers description PowerPoint Templates-Arrow, Background, Process, Business, Chart, Diagram, Financial, Graphic, Gray, Icon, Illustration, Management, Orange, Perspective, Planning Process, Stages, Steps, Text
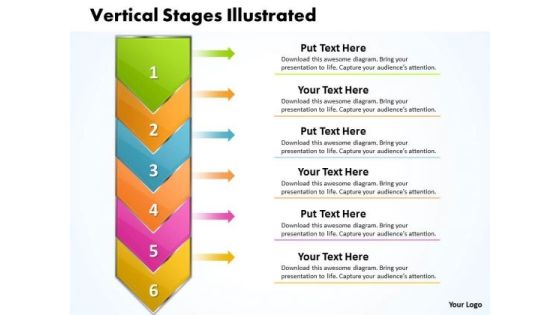
Ppt Vertical Stages Illustrated Through Arrow PowerPoint Templates
PPT vertical stages illustrated through arrow PowerPoint Templates-Use this Sequentially based PowerPoint Diagram to represent six different approaches arranged in vertical manner. It portrays the concept of convert, reclaim, recondition, recover, recycle , redeem, regenerate, remodel, reoccupy, repossess, rescue, restore, retake, salvage etc.-PPT vertical stages illustrated through arrow PowerPoint Templates-Arrow, Background, Process, Business, Chart, Diagram, Financial, Graphic, Gray, Icon, Illustration, Management, Orange, Perspective, Planning Process, Stages, Steps, Text
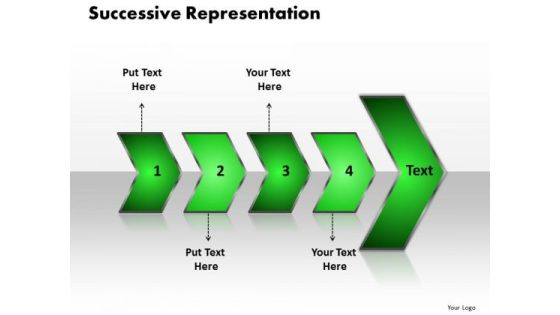
Ppt Successive Representation Of 4 Arrows Free PowerPoint Templates
PPT successive representation of 4 arrows free powerpoint templates-This continual illustration of procedure graphic is a visual representation of your information and ideas. Use this diagram as a method of graphically representing the flow of data as an information processing system.-PPT successive representation of 4 arrows free powerpoint templates-Linear, Flow, Arrow, Background, Process, Business, Chart, Diagram, Financial, Graphic, Gray, Icon, Illustration, Management, Orange, Perspective, Process, Reflection, Stage, Spheres, Text,

Ppt 7 Linear Curved Arrows PowerPoint 2010 Placed Sequentially Templates
PPT 7 linear curved arrows powerpoint 2010 placed sequentially Templates-This 3D Business PowerPoint Diagram Displays the curved arrows Successive to each other signifying the continuous flow of steps to be executed. This Diagram can be used to represent Process charts, Business chart, and Sales process chart and Finance process etc. An excellent graphic to attract the attention of your audience to improve earnings.-PPT 7 linear curved arrows powerpoint 2010 placed sequentially Templates-Arrow, Background, Process, Business, Chart, Diagram, Financial, Graphic, Gray, Icon, Illustration, Management, Orange, Perspective, Process, Reflection, Stage, Text, Transparency

Bar Graph Ppt PowerPoint Presentation Themes
This is a bar graph ppt powerpoint presentation themes. This is a three stage process. The stages in this process are business, marketing, strategy, success, management.
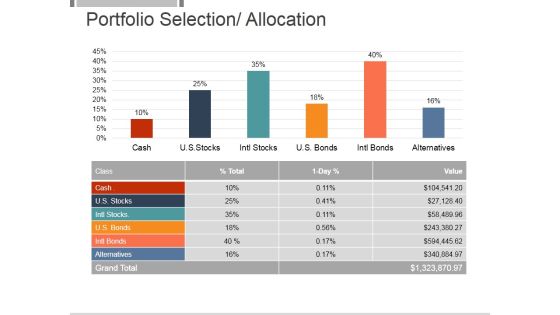
Portfolio Selection Allocation Template 1 Ppt PowerPoint Presentation Themes
This is a portfolio selection allocation template 1 ppt powerpoint presentation themes. This is a six stage process. The stages in this process are financial, business, strategy, management, marketing.
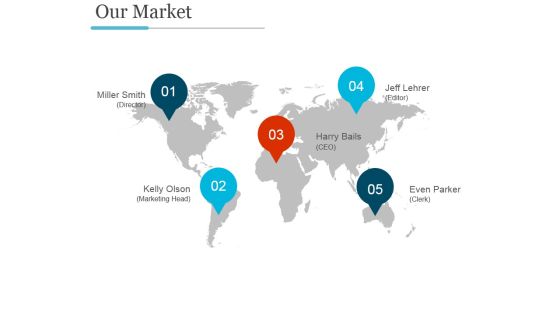
Our Market Template Ppt PowerPoint Presentation Design Templates
This is a our market template ppt powerpoint presentation design templates. This is a four stage process. The stages in this process are pie, percentage, finance, division, analysis.
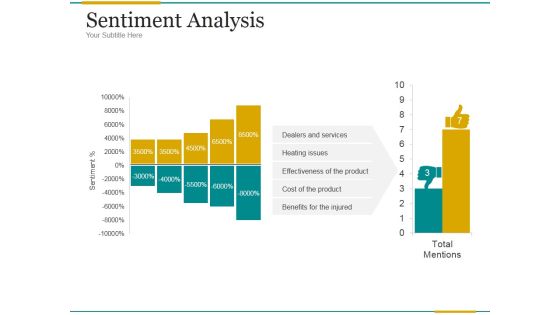
Sentiment Analysis Ppt PowerPoint Presentation Example File
This is a sentiment analysis ppt powerpoint presentation example file. This is a two stage process. The stages in this process are dealers and services, heating issues, effectiveness of the product, cost of the product, benefits for the injured.

Bar Graph Ppt PowerPoint Presentation Layouts Good
This is a bar graph ppt powerpoint presentation layouts good. This is a two stage process. The stages in this process are bar graph, finance, success, strategy, management.

Bar Graph Ppt PowerPoint Presentation Guide
This is a bar graph ppt powerpoint presentation guide. This is a five stage process. The stages in this process are bar graph, finance, marketing, analysis, strategy, business.

Bar Graph Ppt PowerPoint Presentation Model
This is a bar graph ppt powerpoint presentation model. This is a five stage process. The stages in this process are business, marketing, bar slides, management, finance.

Crm Dashboard Current Lead Status Ppt PowerPoint Presentation Guide
This is a crm dashboard current lead status ppt powerpoint presentation guide. This is a six stage process. The stages in this process are business, marketing, success, presentation, financial.

Bar Graph With Arrow For Career Planning Ppt PowerPoint Presentation Gallery
This is a bar graph with arrow for career planning ppt powerpoint presentation gallery. This is a six stage process. The stages in this process are business, finance, marketing, strategy, planning, success, arrow.

Customer Trends Template 1 Ppt PowerPoint Presentation Diagrams
This is a customer trends template 1 ppt powerpoint presentation diagrams. This is a five stage process. The stages in this process are business, marketing, bar graph, finance, management.

Budget Report Ppt PowerPoint Presentation Topics
This is a budget report ppt powerpoint presentation topics. This is a five stage process. The stages in this process are project, incurred, future scheduled, budget, remaining.
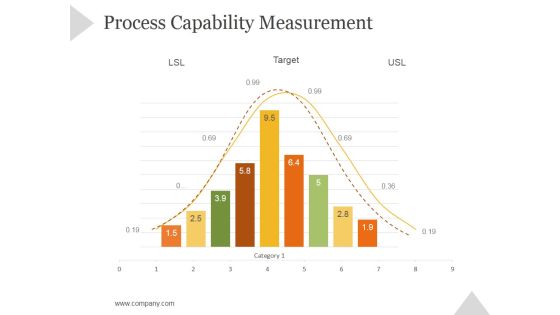
Process Capability Measurement Ppt PowerPoint Presentation Rules
This is a process capability measurement ppt powerpoint presentation rules. This is a nine stage process. The stages in this process are business, strategy, marketing, success, bar graph, growth strategy.

Pareto Analysis Tamplate 2 Ppt PowerPoint Presentation Graphics
This is a pareto analysis tamplate 2 ppt powerpoint presentation graphics. This is a twelve stage process. The stages in this process are bar graph, finance, marketing, strategy, analysis, business.

Data Analytics Ppt PowerPoint Presentation Themes
This is a data analytics ppt powerpoint presentation themes. This is a five stage process. The stages in this process are business, marketing, presentation, data analyst, management.
Plan And Pricing Ppt PowerPoint Presentation Icon Templates
This is a plan and pricing ppt powerpoint presentation icon templates. This is a three stage process. The stages in this process are package, pricing, business, sales, success, strategy.

Budgeting Planned Actual Comparison Ppt PowerPoint Presentation Infographic Template
This is a budgeting planned actual comparison ppt powerpoint presentation infographic template. This is a two stage process. The stages in this process are planned costs vs actual costs, deviation, actual costs, planned costs.

Donation Based Crowdfunding Ppt PowerPoint Presentation Layouts Deck
This is a donation based crowdfunding ppt powerpoint presentation layouts deck. This is a five stage process. The stages in this process are social causes, films and, performing art, business and enterpreneurship, music and recording art.
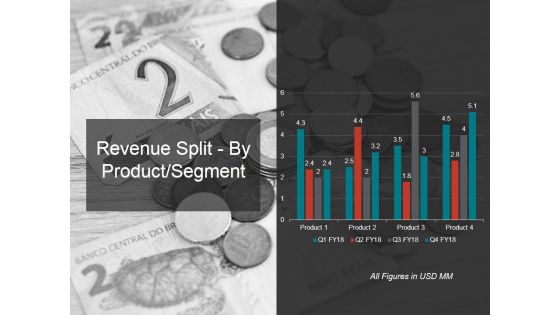
Revenue Split By Product Segment Template 1 Ppt PowerPoint Presentation Infographics Example
This is a revenue split by product segment template 1 ppt powerpoint presentation infographics example. This is a four stage process. The stages in this process are revenue, segment, business, marketing, success.

Revenue Model Ppt PowerPoint Presentation Visual Aids
This is a revenue model ppt powerpoint presentation visual aids. This is a five stage process. The stages in this process are business, marketing, management, finance, planning.
 Home
Home