Errc Graph

Complete Brand Promotion Playbook Bar Graph Structure PDF
Deliver an awe inspiring pitch with this creative Complete Brand Promotion Playbook Bar Graph Structure PDF bundle. Topics like Product, Automatically, Excel Changes can be discussed with this completely editable template. It is available for immediate download depending on the needs and requirements of the user.
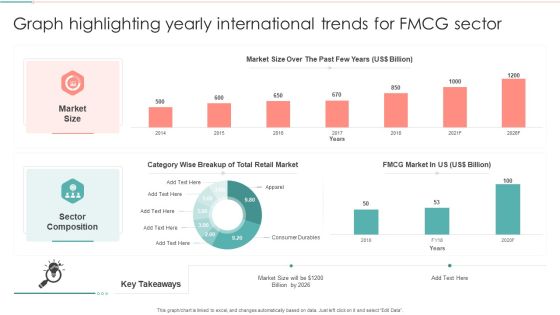
Graph Highlighting Yearly International Trends For FMCG Sector Information PDF
Pitch your topic with ease and precision using this Graph Highlighting Yearly International Trends For FMCG Sector Information PDF. This layout presents information on Sector Composition, Wise Breakup, Retail Market. It is also available for immediate download and adjustment. So, changes can be made in the color, design, graphics or any other component to create a unique layout.

2018 To 2021 Sales Performance Clustered Bar Graph Graphics PDF
Showcasing this set of slides titled 2018 To 2021 Sales Performance Clustered Bar Graph Graphics PDF. The topics addressed in these templates are Range Of Profits, Increase In Production, Profits Are Stagnant. All the content presented in this PPT design is completely editable. Download it and make adjustments in color, background, font etc. as per your unique business setting.
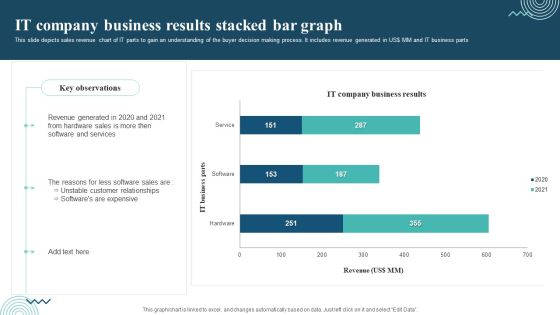
IT Company Business Results Stacked Bar Graph Topics PDF
Showcasing this set of slides titled IT Company Business Results Stacked Bar Graph Topics PDF. The topics addressed in these templates are Revenue Generated, Software And Services, Unstable Customer Relationships. All the content presented in this PPT design is completely editable. Download it and make adjustments in color, background, font etc. As per your unique business setting.
Profits And Discounts On Products Clustered Bar Graph Icons PDF
Showcasing this set of slides titled Profits And Discounts On Products Clustered Bar Graph Icons PDF. The topics addressed in these templates are Profits And Discounts, Less Discounts, Market Penetration. All the content presented in this PPT design is completely editable. Download it and make adjustments in color, background, font etc. as per your unique business setting.

Harvey Ball Graph For Employee Life Cycle Pictures PDF
Pitch your topic with ease and precision using this Harvey Ball Graph For Employee Life Cycle Pictures PDF. This layout presents information on Employee Life Cycle, Design Organisation Structure, Personnel Development Plans . It is also available for immediate download and adjustment. So, changes can be made in the color, design, graphics or any other component to create a unique layout.
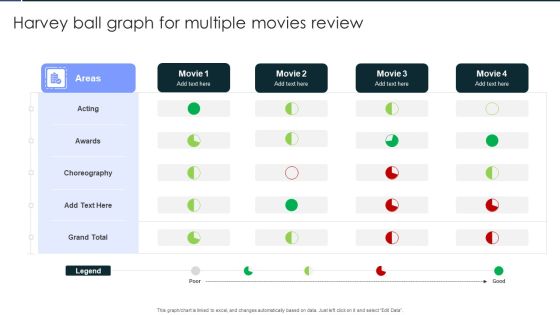
Harvey Ball Graph For Multiple Movies Review Template PDF
Showcasing this set of slides titled Harvey Ball Graph For Multiple Movies Review Template PDF. The topics addressed in these templates are Acting, Awards, Choreography. All the content presented in this PPT design is completely editable. Download it and make adjustments in color, background, font etc. as per your unique business setting.
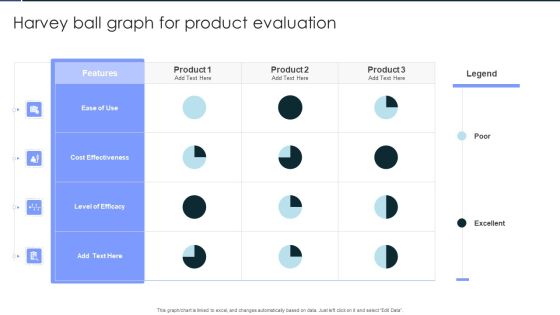
Harvey Ball Graph For Product Evaluation Microsoft PDF
Showcasing this set of slides titled Harvey Ball Graph For Product Evaluation Microsoft PDF. The topics addressed in these templates are Ease Of Use, Cost Effectiveness, Level Of Efficacy. All the content presented in this PPT design is completely editable. Download it and make adjustments in color, background, font etc. as per your unique business setting.
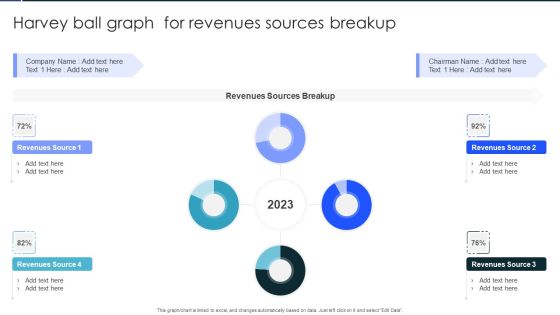
Harvey Ball Graph For Revenues Sources Breakup Infographics PDF
Showcasing this set of slides titled Harvey Ball Graph For Revenues Sources Breakup Infographics PDF. The topics addressed in these templates are Revenues Sources Breakup, Revenues, Sources Breakup. All the content presented in this PPT design is completely editable. Download it and make adjustments in color, background, font etc. as per your unique business setting.

Bar Graph Showing Business Success Ppt PowerPoint Presentation Inspiration
This is a bar graph showing business success ppt powerpoint presentation inspiration. This is a five stage process. The stages in this process are business, success, marketing, management, strategy.

Cost For Quality Graph Ppt PowerPoint Presentation Graphics
This is a cost for quality graph ppt powerpoint presentation graphics. This is a four stage process. The stages in this process are external failure, internal failure, prevention, appraisal, quality improvement.
Financial Projection Graph Template 1 Ppt PowerPoint Presentation Icon Summary
This is a financial projection graph template 1 ppt powerpoint presentation icon summary. This is a three stage process. The stages in this process are annual sales forecast, years, business, marketing, management.
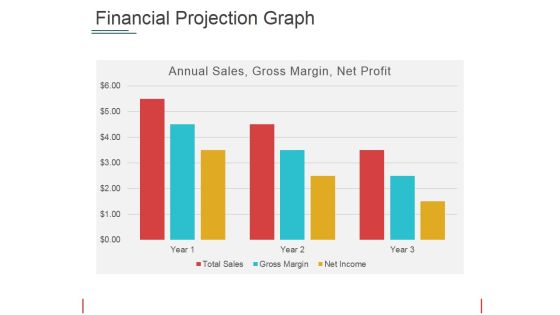
Financial Projection Graph Template 2 Ppt PowerPoint Presentation Show Picture
This is a financial projection graph template 2 ppt powerpoint presentation show picture. This is a three stage process. The stages in this process are annual sales, gross margin, net profit, years.

Bar Graph Ppt PowerPoint Presentation Visual Aids Model
This is a bar graph ppt powerpoint presentation visual aids model. This is a three stage process. The stages in this process are business, strategy, analysis, planning, sales in percentage.

Cost For Quality Graph Ppt PowerPoint Presentation Ideas Files
This is a cost for quality graph ppt powerpoint presentation ideas files. This is a four stage process. The stages in this process are external failure, internal failure, prevention, appraisal, quality improvement.

U S Environmental High Tech Industry Revenue Graph Professional PDF
This slide shows the revenue generated from different environmental technologies in US . It includes analytical services , wastewater treatment woks , solid waste management , etc. Showcasing this set of slides titled U S Environmental High Tech Industry Revenue Graph Professional PDF. The topics addressed in these templates are Management, Materials Collection, Revenues. All the content presented in this PPT design is completely editable. Download it and make adjustments in color, background, font etc. as per your unique business setting.
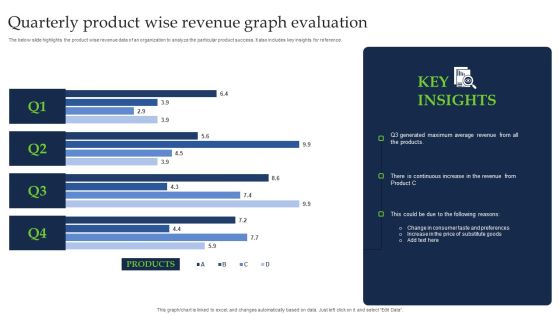
Quarterly Product Wise Revenue Graph Evaluation Brochure PDF
The below slide highlights the product wise revenue data of an organization to analyze the particular product success. It also includes key insights for reference. Pitch your topic with ease and precision using this Quarterly Product Wise Revenue Graph Evaluation Brochure PDF. This layout presents information on Products, Average Revenue. It is also available for immediate download and adjustment. So, changes can be made in the color, design, graphics or any other component to create a unique layout.

Carbon Emission Rate Percentage Stacked Bar Graph Rules PDF
This slide shows emission rate percentage chart comparison of continents to determine lowest emission releasing continents. It includes continents and emission percentage Showcasing this set of slides titled Carbon Emission Rate Percentage Stacked Bar Graph Rules PDF. The topics addressed in these templates are Carbon Emission, Increase In Industrialization, New Manufacturing. All the content presented in this PPT design is completely editable. Download it and make adjustments in color, background, font etc. as per your unique business setting.

Carbon Emissions Of Countries Bar Graph Professional PDF
This slide depicts emissions chart of various countries to avoid the worst impacts of climate change. It includes countries and carbon emissions in million metric tons. Pitch your topic with ease and precision using this Carbon Emissions Of Countries Bar Graph Professional PDF. This layout presents information on Maximum Production, Consumer Goods, Carbon Emissions. It is also available for immediate download and adjustment. So, changes can be made in the color, design, graphics or any other component to create a unique layout.

Global Electric Cars Sales Bar Graph Graphics PDF
This slide shows usage chart of electric cars world over to access present sales and future of EV. It includes years and number of electric cars sales. Showcasing this set of slides titled Global Electric Cars Sales Bar Graph Graphics PDF. The topics addressed in these templates are Electric Vehicle Sales, Electric Cars Purchased, Underdeveloped Technology. All the content presented in this PPT design is completely editable. Download it and make adjustments in color, background, font etc. as per your unique business setting.
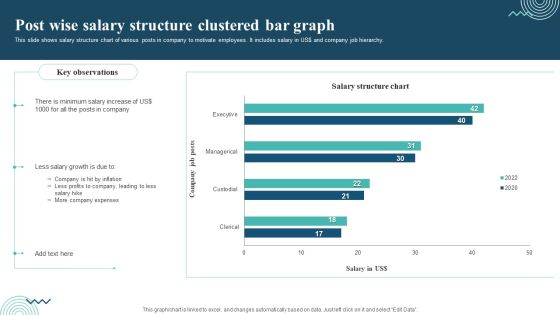
Post Wise Salary Structure Clustered Bar Graph Professional PDF
This slide shows salary structure chart of various posts in company to motivate employees. It includes salary in US dollar and company job hierarchy. Showcasing this set of slides titled Post Wise Salary Structure Clustered Bar Graph Professional PDF. The topics addressed in these templates are Minimum Salary Increase, Less Salary Growth, Company Expenses. All the content presented in this PPT design is completely editable. Download it and make adjustments in color, background, font etc. as per your unique business setting.
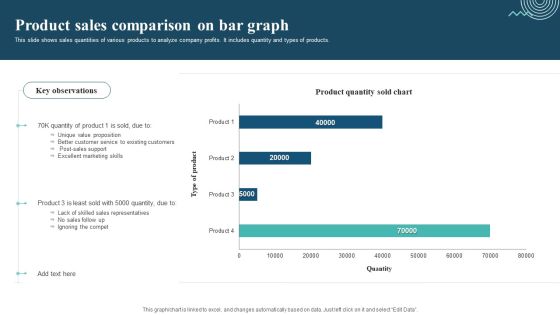
Product Sales Comparison On Bar Graph Sample PDF
This slide shows sales quantities of various products to analyze company profits. It includes quantity and types of products. Pitch your topic with ease and precision using this Product Sales Comparison On Bar Graph Sample PDF. This layout presents information on Unique Value Proposition, Excellent Marketing Skills, Ignoring The Compet. It is also available for immediate download and adjustment. So, changes can be made in the color, design, graphics or any other component to create a unique layout.
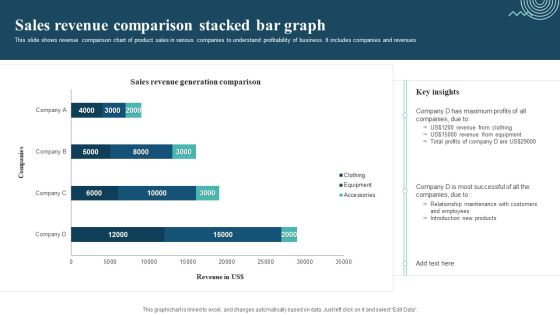
Sales Revenue Comparison Stacked Bar Graph Mockup PDF
This slide shows revenue comparison chart of product sales in various companies to understand profitability of business. It includes companies and revenues. Showcasing this set of slides titled Sales Revenue Comparison Stacked Bar Graph Mockup PDF. The topics addressed in these templates are Sales Revenue Comparison, Revenue From Clothing, Revenue From Equipment. All the content presented in this PPT design is completely editable. Download it and make adjustments in color, background, font etc. as per your unique business setting.
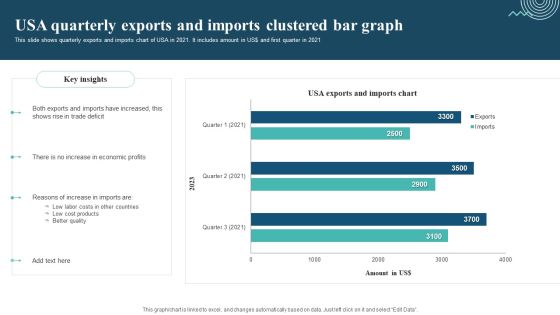
Usa Quarterly Exports And Imports Clustered Bar Graph Designs PDF
This slide shows quarterly exports and imports chart of USA in 2021. It includes amount in US dollar and first quarter in 2021. Pitch your topic with ease and precision using this Usa Quarterly Exports And Imports Clustered Bar Graph Designs PDF. This layout presents information on Exports And Imports, Trade Deficit, Economic Profits. It is also available for immediate download and adjustment. So, changes can be made in the color, design, graphics or any other component to create a unique layout.

Annual Customer Sales Performance Comparison Graph Portrait PDF
This slide shows the annual sales comparison chart. It also includes total and monthly sales target. Pitch your topic with ease and precision using this Annual Customer Sales Performance Comparison Graph Portrait PDF. This layout presents information on Total Sales Target, Sales Target, Achievement. It is also available for immediate download and adjustment. So, changes can be made in the color, design, graphics or any other component to create a unique layout.

USA Recruitment Process Outsourcing Market Size Graph Topics PDF
This slide shows market size of RPO in US market. It includes size of enterprise, on-demand and function based. Showcasing this set of slides titled USA Recruitment Process Outsourcing Market Size Graph Topics PDF. The topics addressed in these templates are RPO Enterprises, Largest Market Size. All the content presented in this PPT design is completely editable. Download it and make adjustments in color, background, font etc. as per your unique business setting.
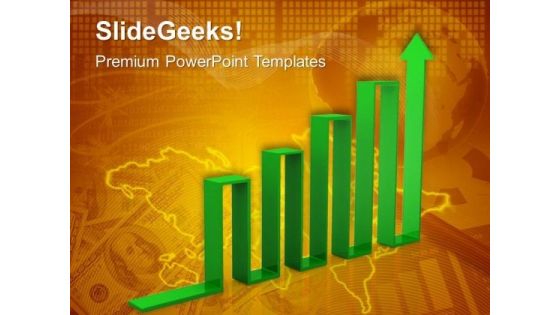
Arrow Graph Success PowerPoint Templates And PowerPoint Themes 1012
Arrow Graph Success PowerPoint Templates And PowerPoint Themes 1012-This PowerPoint Template shows arrow graph with increase. This image signifies the Financial or Business Growth. The Template assumes business concept. Use this template for Global Business. The structure of our templates allows you to effectively highlight the key issues concerning the growth of your business.-Arrow Graph Success PowerPoint Templates And PowerPoint Themes 1012-This PowerPoint template can be used for presentations relating to-Arrow to success, business, marketing, finance, arrows, success

Graph In 2011 Business PowerPoint Backgrounds And Templates 1210
Microsoft PowerPoint Template and Background with An orange arrow moving upwards over the 3D rendering of the year 2011 business graph on a white reflective background

Blocks Graph Business PowerPoint Templates And PowerPoint Themes 0512
Microsoft Powerpoint Templates and Background with blocks-These templates can be used for presentations relating to-Blocks, marketing, business, shapes, success, finance-Blocks Graph Business PowerPoint Templates And PowerPoint Themes 0512
Business Graph Handshake PowerPoint Templates And PowerPoint Themes 0512
Microsoft Powerpoint Templates and Background with handshake-These templates can be used for presentations relating to-Handshake, success, business, finance, marketing, Shapes-Business Graph Handshake PowerPoint Templates And PowerPoint Themes 0512
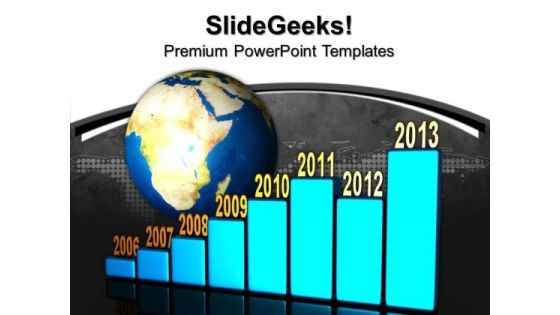
Yearly Business Graph Global PowerPoint Templates And PowerPoint Themes 0912
Yearly Business Graph Global PowerPoint Templates And PowerPoint Themes 0912-Microsoft Powerpoint Templates and Background with business concept-Business concept, business, success, global, finance, sales
Bar Graph Business PowerPoint Templates And PowerPoint Themes 1012
Bar Graph Business PowerPoint Templates And PowerPoint Themes 1012-This PowerPoint Template shows the Bar Graph with increasing percentage which signifies the Financial Growth. The Template signifies the concept of business growth. The structure of our templates allows you to effectively highlight the key issues concerning the growth of your business. Our PPT images are so ideally designed that it reveals the very basis of our PPT template are an effective tool to make your clients understand.-Bar Graph Business PowerPoint Templates And PowerPoint Themes 1012-This PowerPoint template can be used for presentations relating to-Financial bar graph chart, technology, money, business, finance, marketing

Business Graph PowerPoint Templates And PowerPoint Themes 1012
Business Graph PowerPoint Templates And PowerPoint Themes 1012-The PowerPoint Template shows the Growing Bar Graph reaching its Destination that is Globe. This template portrays the concepts of winning leadership Finance Success competition sports business shapes people and abstract. You can use this template to illustrate Global Issues. An excellent graphic to attract the attention of your audience to improve earnings.-Business Graph PowerPoint Templates And PowerPoint Themes 1012-This PowerPoint template can be used for presentations relating to-Business graph with earth, marketing, finance, business, success, money
Business Development Strategy Template 3d Man With Growth Graph Characters
Doll Up Your Thoughts With Our Business Development Strategy Template 3D Man With Growth Graph Characters Powerpoint Templates. They Will Make A Pretty Picture.

Business Development Strategy Template 3d Man With Success Graph Characters
Establish The Dominance Of Your Ideas. Our Business Development Strategy Template 3D Man With Success Graph Characters Powerpoint Templates Will Put Them On Top.
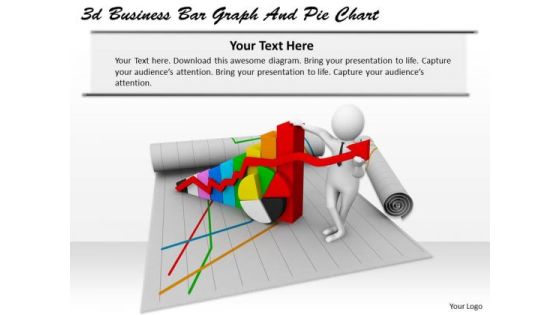
Business Intelligence Strategy 3d Bar Graph And Pie Chart Characters
Establish Your Dominion With Our Business Intelligence Strategy 3D Bar Graph And Pie Chart Characters Powerpoint Templates. Rule The Stage With Your Thoughts.

Business Strategy Consultants Bar Graph Upward Arrow Growing Euro Pictures
Be The Doer With Our Business Strategy Consultants Bar Graph Upward Arrow Growing Euro Pictures Powerpoint Templates. Put Your Thoughts Into Practice.
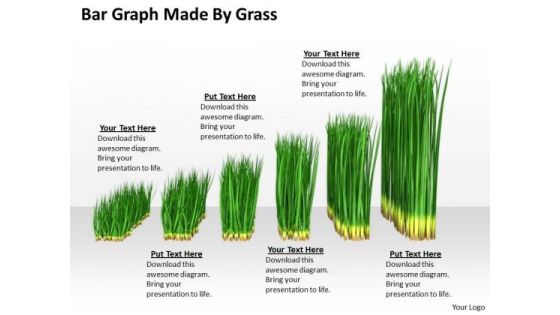
Business Strategy Plan Bar Graph Made By Grass Clipart
Brace Yourself, Arm Your Thoughts. Prepare For The Hustle With Our Business Strategy Plan Bar Graph Made By Grass Clipart Powerpoint Templates.
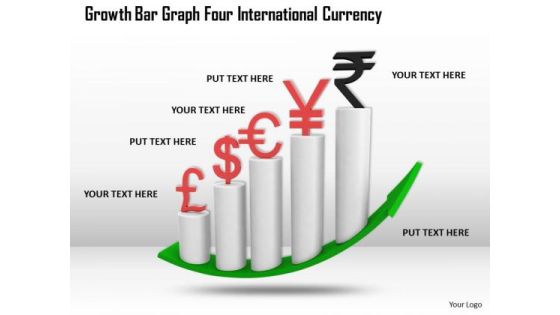
Business Growth Strategy Bar Graph For International Currency Photos
Deliver The Right Dose With Our business growth strategy bar graph for international currency photos Powerpoint Templates. Your Ideas Will Get The Correct Illumination.
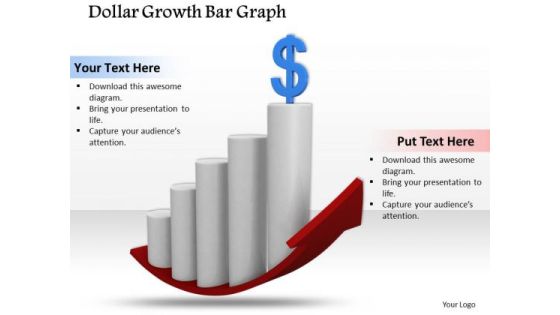
Business Management Strategy Dollar Growth Bar Graph Clipart Images
Land The Idea With Our business management strategy dollar growth bar graph clipart images Powerpoint Templates. Help It Grow With Your Thoughts.
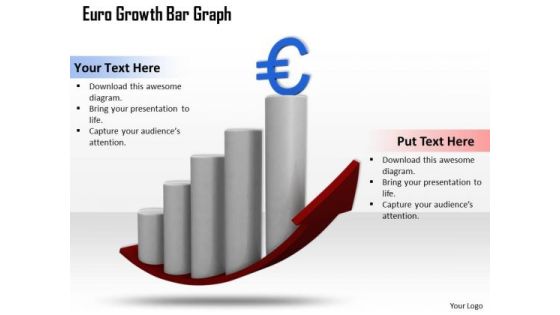
New Business Strategy Euro Growth Bar Graph Images Photos
Your Thoughts Are Dripping With Wisdom. Lace It With Our new business strategy euro growth bar graph images photos Powerpoint Templates.

Innovative Marketing Concepts 3d Team Around Business Graph Characters
Highlight Your Drive With Our innovative marketing concepts 3d team around business graph characters Powerpoint Templates. Prove The Fact That You Have Control.
Business Growth Strategy 3d Man On Graph Character
Doll Up Your Thoughts With Our business growth strategy 3d man on graph character Powerpoint Templates. They Will Make A Pretty Picture.
Business Growth Strategy 3d Man On Top Of Graph Character
Establish The Dominance Of Your Ideas. Our business growth strategy 3d man on top of graph character Powerpoint Templates Will Put Them On Top.

Business Strategy 3d Successful Man On Graph Concepts
Double The Impact With Our business strategy 3d successful man on graph concepts Powerpoint Templates. Your Thoughts Will Have An Imposing Effect.
Creative Marketing Concepts 3d Man Arrow Graph Characters
Draft It Out On Our creative marketing concepts 3d man arrow graph characters Powerpoint Templates. Give The Final Touches With Your Ideas.

Creative Marketing Concepts 3d Man Bar Graph With Laptop Characters
Reduce The Drag With Our creative marketing concepts 3d man bar graph with laptop characters Powerpoint Templates. Give More Lift To Your Thoughts.
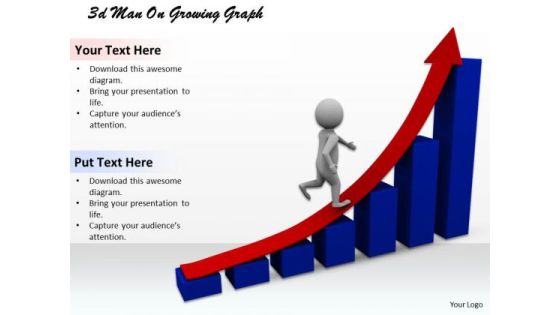
Innovative Marketing Concepts 3d Man Growing Graph Adaptable Business
Add Some Dramatization To Your Thoughts. Our innovative marketing concepts 3d man growing graph adaptable business Powerpoint Templates Make Useful Props.

Modern Marketing Concepts 3d Man Climbing Bar Graph Adaptable Business
Discover Decisive Moments With Our modern marketing concepts 3d man climbing bar graph adaptable business Powerpoint Templates. They Help Make That Crucial Difference.
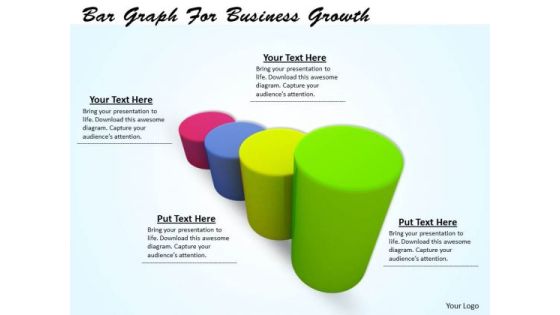
Stock Photo Bar Graph For Business Growth Ppt Template
Our Stock Photo Bar Graph For Business Growth PPT template Powerpoint Templates Deliver At Your Doorstep. Let Them In For A Wonderful Experience.

Stock Photo Pie Graph For Business Performance Ppt Template
Our Stock Photo Pie Graph For Business Performance PPT template Powerpoint Templates Allow You To Do It With Ease. Just Like Picking The Low Hanging Fruit.

Business Strategy Execution 3d Man Top Of Graph Character Modeling
Be The Doer With Our business strategy execution 3d man top of graph character modeling Powerpoint Templates. Put Your Thoughts Into Practice.

Business Strategy Implementation 3d Man Rising With Graph Concept
Put In A Dollop Of Our business strategy implementation 3d man rising with graph concept Powerpoint Templates. Give Your Thoughts A Distinctive Flavor.
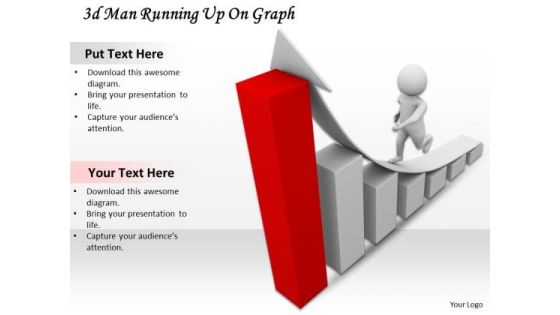
Business Strategy Implementation 3d Man Running Up Graph Concept
Get The Domestics Right With Our business strategy implementation 3d man running up graph concept Powerpoint Templates. Create The Base For Thoughts To Grow.

Stock Photo Pie Chart And Bar Graph PowerPoint Template
Put In A Dollop Of Our stock photo Pie Chart And Bar Graph powerpoint template Powerpoint Templates. Give Your Thoughts A Distinctive Flavor.

Modern Marketing Concepts 3d Team Meeting Around Graph Characters
Plan For All Contingencies With Our modern marketing concepts 3d team meeting around graph characters Powerpoint Templates. Douse The Fire Before It Catches.
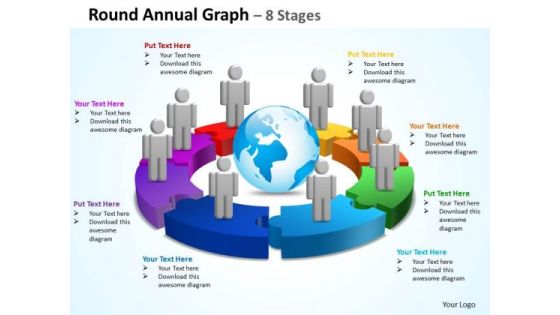
Business Diagram Round Annual Graph 8 Stages Marketing Diagram
Document Your Views On Our Business Diagram Round Annual Graph 8 Stages Marketing Diagram Powerpoint Templates. They Will Create A Strong Impression.

Marketing Diagram Circular Progress Diagrams Graph 8 Stages Strategy Diagram
Get The Doers Into Action. Activate Them With Our Marketing Diagram Circular Progress Diagrams Graph 8 Stages Strategy Diagram Powerpoint Templates.

Business Framework Model Buisness Graph Dashboard Style Consulting Diagram
Get Out Of The Dock With Our Business Framework Model Business Graph Dashboard Style Consulting Diagram Powerpoint Templates. Your Mind Will Be Set Free.
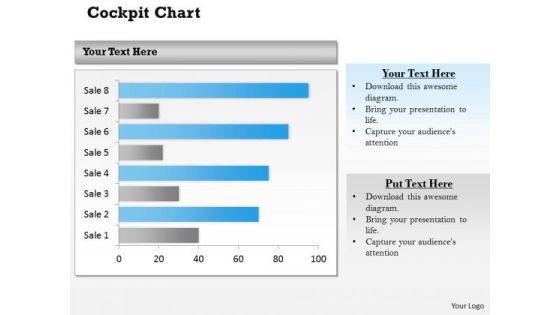
Strategic Management Business Graph Dashboard Layout Business Diagram
Doll Up Your Thoughts With Our Strategic Management Business Graph Dashboard Layout Business Diagram Powerpoint Templates. They Will Make A Pretty Picture.
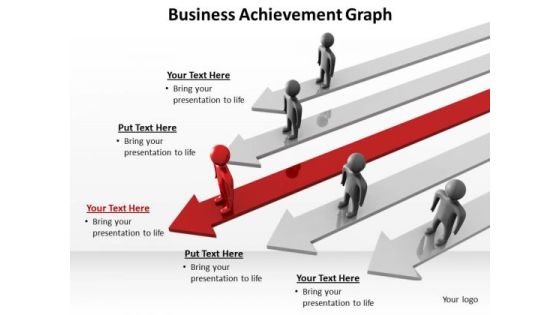
Mba Models And Frameworks Business Achievement Graph Consulting Diagram
Our MBA Models And Frameworks Business Achievement Graph Consulting Diagram Powerpoint Templates And Your Ideas Make A Great Doubles Pair. Play The Net With Assured Hands.
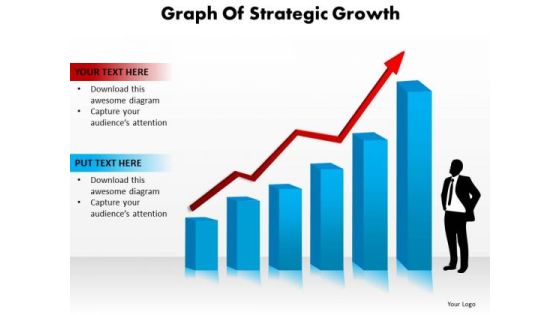
Strategy Diagram Graph Of Strategic Growth Business Cycle Diagram
Our Strategy Diagram Graph Of Strategic Growth Business Cycle Diagram Powerpoint Templates Heighten Concentration. Your Audience Will Be On The Edge.
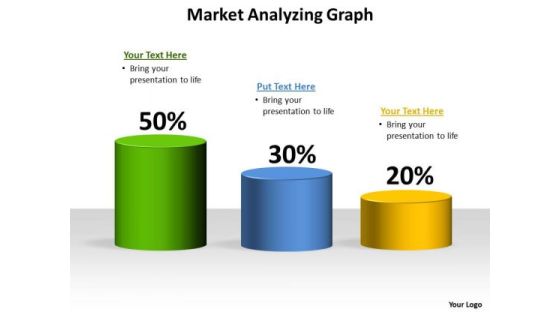
Business Finance Strategy Development Market Analyzing Graph Strategic Management
Establish The Dominance Of Your Ideas. Our Business Finance Strategy Development Market Analyzing Graph Strategic Management Powerpoint Templates Will Put Them On Top.
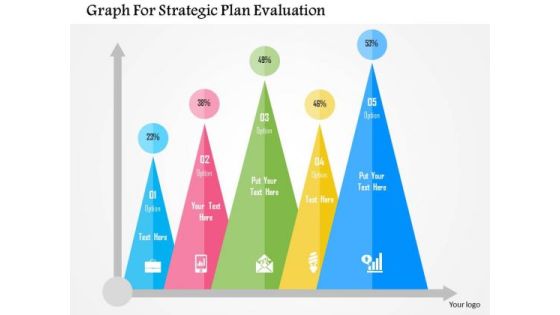
Business Diagram Graph For Strategic Plan Evaluation Presentation Template
Strategic plan evaluation can be explained with this diagram. It contains business statistics graph with icons. Download this diagram slide to make impressive presentations.

Graph On Tablet For Segmentation Strategy Powerpoint Template
Concept of segmentation strategy can be explained with this diagram. This PowerPoint template contains graph on computer tablet. Download this diagram slide to make interactive presentations.

Bar Graph Infographics For Business Analysis Powerpoint Template
This PowerPoint template contains bar graph with icons. This PPT slide helps to exhibit concepts like strategy, direction and success. Use this business slide to make impressive presentations.

Product Launch Budget Plan Bar Graph Ppt Slides
This is a product launch budget plan bar graph ppt slides. This is a eight stage process. The stages in this process are business, finance, marketing.
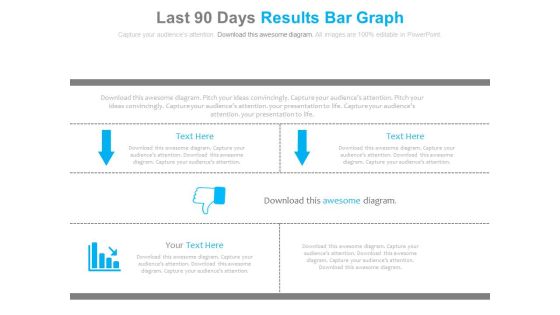
Last 90 Days Results Bar Graph Ppt Slides
This is a last 90 days results bar graph ppt slides. This is a three stage process. The stages in this process are arrows, business, marketing.
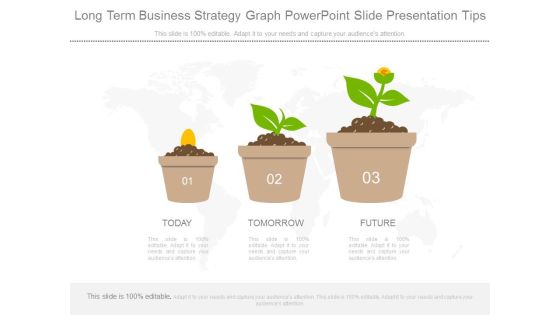
Long Term Business Strategy Graph Powerpoint Slide Presentation Tips
This is a long term business strategy graph powerpoint slide presentation tips. This is a three stage process. The stages in this process are today, tomorrow, future.

Curve Bar Graph For Process Capability Measurement Powerpoint Guide
This is a curve bar graph for process capability measurement powerpoint guide. This is a nine stage process. The stages in this process are target, lsl, usl, category.

Competitive Environment Analysis Bar Graph Ppt Slide Templates
This is a competitive environment analysis bar graph ppt slide templates. This is a one stage process. The stages in this process are engagement, brand, monthly, weekly.

Gross Margin Improvement Bar Graph Dashboard Powerpoint Slide Download
This is a gross margin improvement bar graph dashboard powerpoint slide download. This is a two stage process. The stages in this process are chart title.

Ebitda Highlights Growth Indication Bar Graph Powerpoint Slide Backgrounds
This is a ebitda highlights growth indication bar graph powerpoint slide backgrounds. This is a five stage process. The stages in this process are ebitda, ebitda margins, category.

Financials Bar Graph For Expectation Analysis Powerpoint Slide Deck Samples
This is a financials bar graph for expectation analysis powerpoint slide deck samples. This is a four stage process. The stages in this process are product version.

Bar Graph For Career Advancement Sample Of Ppt
This is a bar graph for career advancement sample of ppt. This is a six stage process. The stages in this process are business, strategy, management, growth, process.

bar graph template 2 ppt powerpoint presentation gallery
This is a bar graph template 2 ppt powerpoint presentation gallery. This is a four stage process. The stages in this process are business, marketing, product, analysis, growth.

Bar Graph Ppt PowerPoint Presentation Infographic Template Visuals
This is a bar graph ppt powerpoint presentation infographic template visuals. This is a twelve stage process. The stages in this process are business, marketing, management, growth, planning.

Bar Graph Ppt PowerPoint Presentation Outline Slide Download
This is a bar graph ppt powerpoint presentation outline slide download. This is a four stage process. The stages in this process are business, marketing, finance, timeline, growth.

Elevator Pitch Template 1 Ppt PowerPoint Presentation Diagram Graph Charts
This is a elevator pitch template 1 ppt powerpoint presentation diagram graph charts. This is a three stage process. The stages in this process are what, why, how.

Bar Graph Ppt Powerpoint Presentation Inspiration Background Image
This is a bar graph ppt powerpoint presentation inspiration background image. This is a four stage process. The stages in this process are australia, china, brazil, united states.

Bar Graph Ppt PowerPoint Presentation Visual Aids Styles
This is a bar graph ppt powerpoint presentation visual aids styles. This is a five stage process. The stages in this process are finance, analysis, planning, business, process.

Bar Graph Ppt PowerPoint Presentation Pictures Graphic Images
This is a bar graph ppt powerpoint presentation pictures graphic images. This is a two stage process. The stages in this process are actual, target, growth, success.

Bar Graph Ppt PowerPoint Presentation Styles File Formats
This is a bar graph ppt powerpoint presentation styles file formats. This is a four stage process. The stages in this process are percentage, business, marketing, finance, strategy.

Bar Graph Ppt PowerPoint Presentation Portfolio Example Topics
This is a bar graph ppt powerpoint presentation portfolio example topics. This is a four stage process. The stages in this process are business, marketing, management, success, planning.

Market Segmentation Ppt PowerPoint Presentation Diagram Graph Charts
This is a market segmentation ppt powerpoint presentation diagram graph charts. This is a four stage process. The stages in this process are geographic, demographic, psychographic, behavioral.

Bar Graph Finance Ppt PowerPoint Presentation Icon Good
This is a bar graph finance ppt powerpoint presentation icon good. This is a two stage process. The stages in this process are analysis, finance, marketing, management, investment.

Bar Graph Finance Ppt PowerPoint Presentation Pictures Elements
This is a bar graph finance ppt powerpoint presentation pictures elements. This is a three stage process. The stages in this process are finance, marketing, management, investment, analysis.

bar graph finance ppt powerpoint presentation portfolio summary
This is a bar graph finance ppt powerpoint presentation portfolio summary. This is a three stage process. The stages in this process are finance, marketing, management, investment, analysis.

Bar Graph Chart Ppt PowerPoint Presentation Portfolio Templates
This is a bar graph chart ppt powerpoint presentation portfolio templates. This is a two stage process. The stages in this process are financial, minimum, medium, maximum.
Direct Sales Lead Ppt Powerpoint Presentation Diagram Graph Charts Cpb
This is a direct sales lead ppt powerpoint presentation diagram graph charts cpb. This is a two stage process. The stages in this process are direct sales lead.
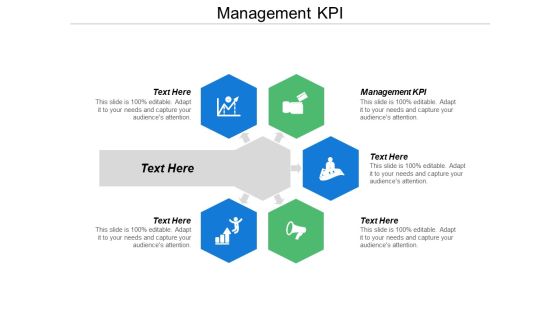
Management Kpi Ppt Powerpoint Presentation Diagram Graph Charts Cpb
This is a management kpi ppt powerpoint presentation diagram graph charts cpb. This is a five stage process. The stages in this process are management kpi.

Bar Graph Finance Ppt Powerpoint Presentation Layouts Mockup
This is a bar graph finance ppt powerpoint presentation layouts mockup. This is a three stage process. The stages in this process are finance, marketing, management, investment, analysis.

Bar Graph Finance Ppt Powerpoint Presentation File Ideas
This is a bar graph finance ppt powerpoint presentation file ideas. This is a four stage process. The stages in this process are finance, marketing, management, investment, analysis.

Column Chart Graph Ppt PowerPoint Presentation Outline Information
This is a column chart graph ppt powerpoint presentation outline information. This is a three stage process. The stages in this process are compare, marketing, business, management, planning.

Stock Chart Graph Ppt PowerPoint Presentation Ideas Demonstration
This is a stock chart graph ppt powerpoint presentation ideas demonstration. This is a three stage process. The stages in this process are finance, marketing, management, investment, analysis.

Clustered Column Graph Ppt PowerPoint Presentation Pictures Grid
This is a clustered column graph ppt powerpoint presentation pictures grid. This is a two stage process. The stages in this process are finance, marketing, management, investment, analysis.
Project Management Gantt Chart Graph Ppt PowerPoint Presentation Styles Icon
This is a project management gantt chart graph ppt powerpoint presentation styles icon. This is a four stage process. The stages in this process are four.

Bar Graph Finance Ppt PowerPoint Presentation Styles Slide
This is a bar graph finance ppt powerpoint presentation styles slide. This is a three stage process. The stages in this process are finance, marketing, management, investment, analysis.

Combo Chart Graph Ppt PowerPoint Presentation Inspiration Template
This is a combo chart graph ppt powerpoint presentation inspiration template. This is a three stage process. The stages in this process are finance, marketing, management, investment, analysis.

Pie Financial Graph Ppt PowerPoint Presentation Model Gridlines
This is a pie financial graph ppt powerpoint presentation model gridlines. This is a three stage process. The stages in this process are finance, marketing, management, investment, analysis.

Pie Financial Graph Ppt PowerPoint Presentation Gallery Gridlines
This is a pie financial graph ppt powerpoint presentation gallery gridlines. This is a three stage process. The stages in this process are finance, marketing, management, investment, analysis.

Combo Chart Graph Ppt PowerPoint Presentation Infographics Guide
This is a combo chart graph ppt powerpoint presentation infographics guide. This is a two stage process. The stages in this process are marketing, business, management, planning, strategy.

Clustered Bar Graph Ppt PowerPoint Presentation Outline Layouts
This is a clustered bar graph ppt powerpoint presentation outline layouts. This is a three stage process. The stages in this process are finance, marketing, analysis, investment, million.
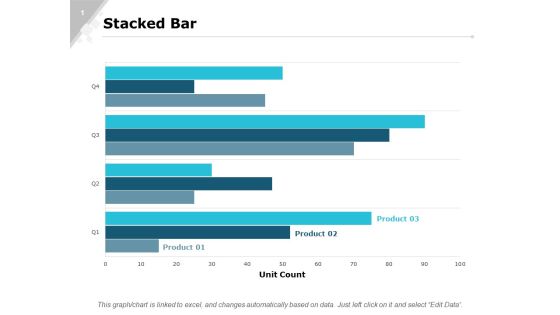
Stacked Bar Graph Ppt PowerPoint Presentation Inspiration Images
This is a stacked bar graph ppt powerpoint presentation inspiration images. This is a three stage process. The stages in this process are finance, marketing, analysis, investment, million.

Clustered Chart Graph Ppt PowerPoint Presentation Gallery Backgrounds
This is a clustered chart graph ppt powerpoint presentation gallery backgrounds. This is a three stage process. The stages in this process are finance, marketing, analysis, investment, million.

Combo Chart Graph Ppt PowerPoint Presentation Professional Guidelines
This is a combo chart graph ppt powerpoint presentation professional guidelines. This is a three stage process. The stages in this process are finance, marketing, analysis, investment, million.

Yearly Comparison Graph For Human Resource Employees Salary Template PDF
This slide showcases yearly comparison of salary of different employees in organization and identify the increment growth rate. It showcases comparative assessment for a period of 4 years. Pitch your topic with ease and precision using this Yearly Comparison Graph For Human Resource Employees Salary Template PDF. This layout presents information on Human Resource, Employees Salary. It is also available for immediate download and adjustment. So, changes can be made in the color, design, graphics or any other component to create a unique layout.

Yearly Sales Assessment Of Products With Bar Graph Structure PDF
This slide represent graphical presentation of annual sales review of various products sold by an organization within 5 years showing difference in revenue generated .It shows report of following years 2018,2019,2020,and 2021. Showcasing this set of slides titled Yearly Sales Assessment Of Products With Bar Graph Structure PDF. The topics addressed in these templates are Product, Sales Of Product, Product Demand. All the content presented in this PPT design is completely editable. Download it and make adjustments in color, background, font etc. as per your unique business setting.

Car Types Used In Usa Stacked Percentage Graph Sample PDF
This slide shows car use percentage chart in USA to compare vehicle buying decisions. It includes types of cars and car use percentage. Pitch your topic with ease and precision using this Car Types Used In Usa Stacked Percentage Graph Sample PDF. This layout presents information on Limited Space In City, Less Parking Space, Easy To Commute. It is also available for immediate download and adjustment. So, changes can be made in the color, design, graphics or any other component to create a unique layout.

Insurance Policy Usage Stacked Percentage Graph Template PDF
This slide illustrates use of insurance policy types percentage chart in USA to determine total number of insurances taken. It includes cities and insurance policy percentage. Pitch your topic with ease and precision using this Insurance Policy Usage Stacked Percentage Graph Template PDF. This layout presents information on Motor Vehicle Policies, More Population, Migration Of People. It is also available for immediate download and adjustment. So, changes can be made in the color, design, graphics or any other component to create a unique layout.

Business Marketing Organizational Expense Assessment Graph Information PDF
The following slide depicts the comparative analysis of marketing budget allocation for current and previous year to assess variance. It includes promotional activities such as advertising, paid media, agency fee, publicity etc. Showcasing this set of slides titled Business Marketing Organizational Expense Assessment Graph Information PDF. The topics addressed in these templates are Paid Media, Advertising, Budget Allocated. All the content presented in this PPT design is completely editable. Download it and make adjustments in color, background, font etc. as per your unique business setting.
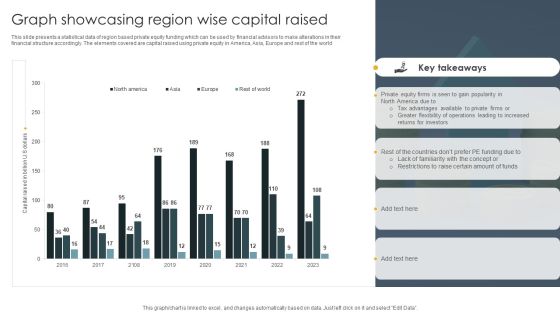
Graph Showcasing Region Wise Capital Raised Demonstration PDF
This slide presents a statistical data of region based private equity funding which can be used by financial advisors to make alterations in their financial structure accordingly. The elements covered are capital raised using private equity in America, Asia, Europe and rest of the world. Showcasing this set of slides titled Graph Showcasing Region Wise Capital Raised Demonstration PDF. The topics addressed in these templates are Investors, Tax Advantages, Private Equity. All the content presented in this PPT design is completely editable. Download it and make adjustments in color, background, font etc. as per your unique business setting.
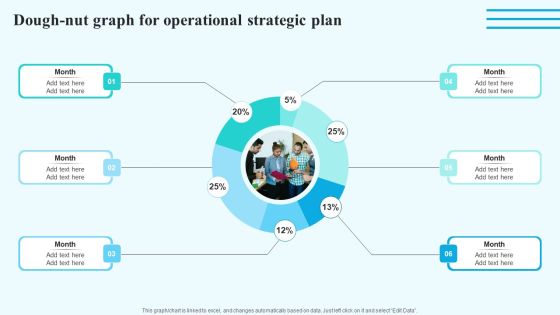
Dough Nut Graph For Operational Strategic Plan Information PDF
Are you in need of a template that can accommodate all of your creative concepts This one is crafted professionally and can be altered to fit any style. Use it with Google Slides or PowerPoint. Include striking photographs, symbols, depictions, and other visuals. Fill, move around, or remove text boxes as desired. Test out color palettes and font mixtures. Edit and save your work, or work with colleagues. Download Dough Nut Graph For Operational Strategic Plan Information PDF and observe how to make your presentation outstanding. Give an impeccable presentation to your group and make your presentation unforgettable.
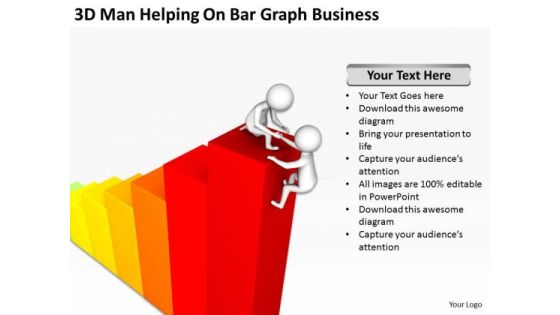
Famous Business People On Bar Graph New PowerPoint Presentation Templates
We present our famous business people on bar graph new powerpoint presentation templates.Present our Business PowerPoint Templates because you should once Tap the ingenuity of our PowerPoint Templates and Slides. They are programmed to succeed. Present our Teamwork PowerPoint Templates because Our PowerPoint Templates and Slides will fulfill your every need. Use them and effectively satisfy the desires of your audience. Use our Success PowerPoint Templates because It will Give impetus to the hopes of your colleagues. Our PowerPoint Templates and Slides will aid you in winning their trust. Use our Flow Charts PowerPoint Templates because Our PowerPoint Templates and Slides are Clear and concise. Use them and dispel any doubts your team may have. Download our Shapes PowerPoint Templates because Our PowerPoint Templates and Slides will fulfill your every need. Use them and effectively satisfy the desires of your audience.Use these PowerPoint slides for presentations relating to 3d, abstract, achievement, bar, business, cartoon, character, chart, climb,communication, concept, goal, graph, hand, help, hold, human,humanoid, icon, idea, idiom, illustration,isolated, measure, mentor, metaphor,over, partner, partnership, person,presentation, profit, prospectus, puppet,render, report, stair, success, team,teamwork, together. The prominent colors used in the PowerPoint template are Red, White, Yellow. Professionals tell us our famous business people on bar graph new powerpoint presentation templates will save the presenter time. People tell us our achievement PowerPoint templates and PPT Slides are designed by professionals We assure you our famous business people on bar graph new powerpoint presentation templates will get their audience's attention. Presenters tell us our climb PowerPoint templates and PPT Slides will help them to explain complicated concepts. We assure you our famous business people on bar graph new powerpoint presentation templates will make the presenter successul in his career/life. PowerPoint presentation experts tell us our bar PowerPoint templates and PPT Slides are incredible easy to use.
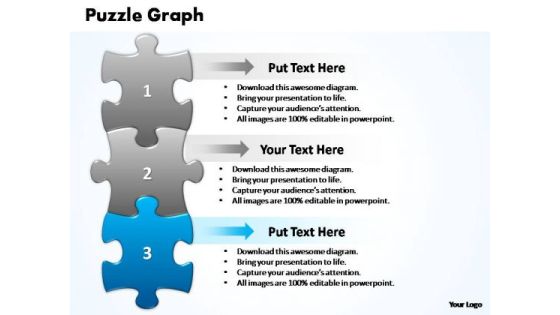
PowerPoint Designs Download Business Puzzle Graph Ppt Presentation
PowerPoint Designs Download Business Puzzle Graph PPT Presentation-This PowerPoint slide shows 3 puzzles diagram. There is a lot of space available for writing your text. You can easily edit the size, position, text, color. \n\n-PowerPoint Designs Download Business Puzzle Graph PPT Presentation

PowerPoint Presentation Leadership Business Puzzle Graph Ppt Designs
PowerPoint Presentation Leadership Business Puzzle Graph PPT Designs-This PowerPoint slide shows 3 puzzles diagram. There is a lot of space available for writing your text. You can easily edit the size, position, text, color. \n\n-PowerPoint Presentation Leadership Business Puzzle Graph PPT Designs
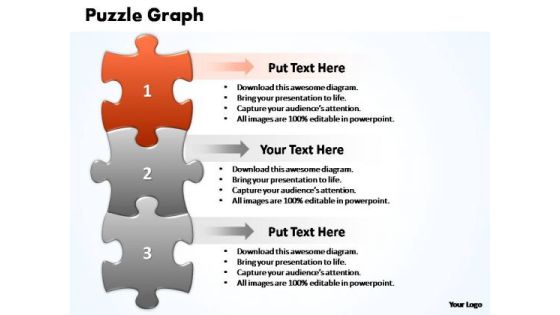
PowerPoint Slide Editable Business Puzzle Graph Ppt Themes
PowerPoint Slide Editable Business Puzzle Graph PPT Themes-This PowerPoint slide shows 3 puzzles diagram. There is a lot of space available for writing your text. You can easily edit the size, position, text, color. \n\n-PowerPoint Slide Editable Business Puzzle Graph PPT Themes

Marketing Diagram Cycle Chain Graph Business Cycle Diagram
Get the doers into action. Activate them with our Marketing Diagram Cycle Chain Graph Business Cycle Diagram Powerpoint Templates. Put your money on our Marketing Diagram Cycle Chain Graph Business Cycle Diagram Powerpoint Templates. Your ideas will rake in the dollars.
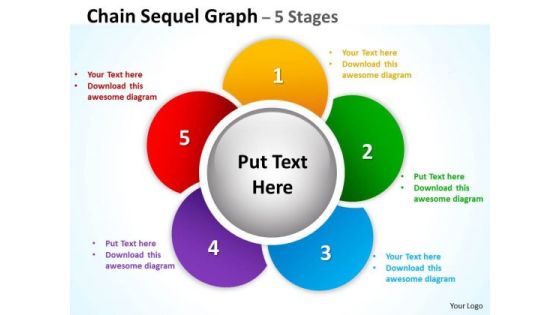
Business Framework Model Chain Sequel Graph Diagrams Consulting Diagram
Our Business Framework Model Chain Sequel Graph diagrams Consulting diagram Powerpoint Templates team are a dogged lot. They keep at it till they get it right. Dole it out with our Business Framework Model Chain Sequel Graph diagrams Consulting diagram Powerpoint Templates. Your thoughts will get the right proportions.
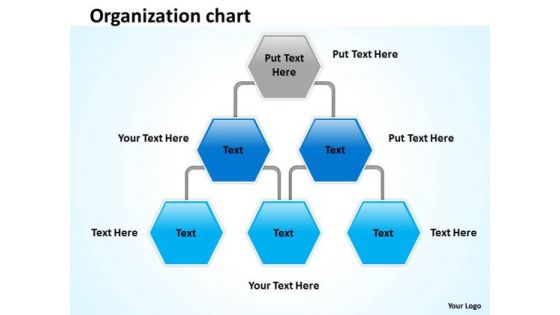
Marketing Diagram Organization Graph Mba Models And Frameworks
Our marketing diagram Organization graph MBA models and frameworks Powerpoint Templates Enjoy Drama. They Provide Entertaining Backdrops. Our marketing diagram Organization graph MBA models and frameworks Powerpoint Templates Help To Make A Draft. They Give You A Good Place To Start.
 Home
Home