Errc Graph

Bar Graph Ppt PowerPoint Presentation Model
This is a bar graph ppt powerpoint presentation model. This is a five stage process. The stages in this process are business, marketing, bar slides, management, finance.

Bar Graph Ppt PowerPoint Presentation Topics
This is a bar graph ppt powerpoint presentation topics. This is a five stage process. The stages in this process are business, strategy, icons, management.

Bar Graph Ppt PowerPoint Presentation Backgrounds
This is a bar graph ppt powerpoint presentation backgrounds. This is a four stage process. The stages in this process are business, marketing, finance, growth, management.

Bar Graph Ppt PowerPoint Presentation Shapes
This is a bar graph ppt powerpoint presentation shapes. This is a five stage process. The stages in this process are arrows, marketing, strategy, business, success.

Bar Graph Ppt PowerPoint Presentation Templates
This is a bar graph ppt powerpoint presentation templates. This is a four stage process. The stages in this process are arrows, business, marketing, strategy, growth, graphic.

Bar Graph Ppt PowerPoint Presentation Clipart
This is a bar graph ppt powerpoint presentation clipart. This is a four stage process. The stages in this process are silhouettes, business, success, growth, stair.

Bar Graph Ppt PowerPoint Presentation Layout
This is a bar graph ppt powerpoint presentation layout. This is a three stage process. The stages in this process are business, marketing, management, analysis, growth.

Bar Graph Ppt PowerPoint Presentation Deck
This is a bar graph ppt powerpoint presentation deck. This is a five stage process. The stages in this process are percentage, process, strategy, success, marketing.

Financial Projection Graph Ppt PowerPoint Presentation Introduction
This is a financial projection graph ppt powerpoint presentation introduction. This is a five stage process. The stages in this process are jan, feb ,mar, apr, may, jun.

Bar Graph Ppt PowerPoint Presentation Images
This is a bar graph ppt powerpoint presentation images. This is a four stage process. The stages in this process are business, strategy, marketing, analysis, success, growth.

Bar Graph Ppt PowerPoint Presentation Themes
This is a bar graph ppt powerpoint presentation themes. This is a three stage process. The stages in this process are business, marketing, strategy, success, management.

Bar Graph Ppt PowerPoint Presentation Design Ideas
This is a bar graph ppt powerpoint presentation design ideas. This is a four stage process. The stages in this process are business, management, marketing, finance, year.

Bar Graph Ppt PowerPoint Presentation Design Templates
This is a bar graph ppt powerpoint presentation design templates. This is a four stage process. The stages in this process are business, marketing, success, growth, years.

Competitor Analysis Graph Ppt PowerPoint Presentation Graphics
This is a competitor analysis graph ppt powerpoint presentation graphics. This is a five stage process. The stages in this process are competitor, business, marketing.

Bar Graph Ppt PowerPoint Presentation Tips
This is a bar graph ppt powerpoint presentation tips. This is a four stage process. The stages in this process are business, strategy, analysis, success, growth strategy, stair.

Bar Graph Ppt PowerPoint Presentation Pictures Display
This is a bar graph ppt powerpoint presentation pictures display. This is a one stage process. The stages in this process are sales in percentage, financial year.

Bar Graph Ppt PowerPoint Presentation Slides Format
This is a bar graph ppt powerpoint presentation slides format. This is a two stage process. The stages in this process are business, marketing, growth, planning, sales plan.

Bar Graph Ppt PowerPoint Presentation Ideas Diagrams
This is a bar graph ppt powerpoint presentation ideas diagrams. This is a twelve stage process. The stages in this process are jan, feb, mar, apr, may, growth.

Agenda Ppt PowerPoint Presentation Diagram Graph Charts
This is a agenda ppt powerpoint presentation diagram graph charts. This is a four stage process. The stages in this process are agenda, planning, management, business, list.

Bar Graph Ppt PowerPoint Presentation Outline Slides
This is a bar graph ppt powerpoint presentation outline slides. This is a three stage process. The stages in this process are business, marketing, management, analysis, growth.

Bar Graph Ppt PowerPoint Presentation Ideas Professional
This is a bar graph ppt powerpoint presentation ideas professional. This is a five stage process. The stages in this process are business, marketing, growth, planning, process.

Bar Graph Ppt PowerPoint Presentation Gallery Maker
This is a bar graph ppt powerpoint presentation gallery maker. This is a six stage process. The stages in this process are business, marketing, growth, planning, management.

Bar Graph Ppt PowerPoint Presentation Model Images
This is a bar graph ppt powerpoint presentation model images. This is a four stage process. The stages in this process are business, marketing, finance, growth, management.

Bar Graph Ppt PowerPoint Presentation Layouts Gridlines
This is a bar graph ppt powerpoint presentation layouts gridlines. this is a three stage process. The stages in this process are product, percentage, business, marketing, management.

Bar Graph Ppt Powerpoint Presentation Model Topics
This is a bar graph ppt powerpoint presentation model topics. This is a twelve stage process. The stages in this process are jan, feb, mar, mar, apr.

Bar Graph Ppt PowerPoint Presentation Gallery Inspiration
This is a bar graph ppt powerpoint presentation gallery inspiration. This is a three stage process. The stages in this process are product, sales in percentage, finance, success.
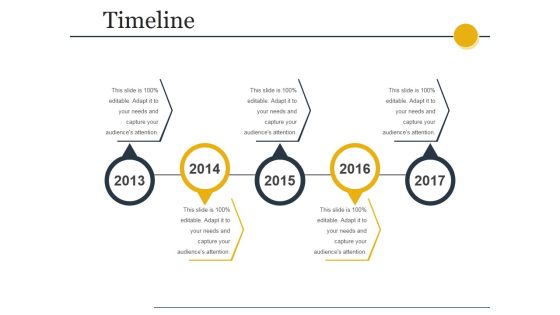
Timeline Ppt PowerPoint Presentation Diagram Graph Charts
This is a timeline ppt powerpoint presentation diagram graph charts. This is a five stage process. The stages in this process are timeline, years, business, marketing, planning.

Bar Graph Ppt PowerPoint Presentation Outline Structure
This is a bar graph ppt powerpoint presentation outline structure. This is a three stage process. The stages in this process are product, percentage, finance, business.

Bar Graph Ppt PowerPoint Presentation Icon
This is a bar graph ppt powerpoint presentation icon. This is a three stage process. The stages in this process are business, finance, marketing, strategy, analysis.

Bar Graph Ppt PowerPoint Presentation Inspiration Sample
This is a bar graph ppt powerpoint presentation inspiration sample. This is a four stage process. The stages in this process are business, pyramid, marketing, strategy, planning.

Bar Graph Ppt PowerPoint Presentation Show Slides
This is a bar graph ppt powerpoint presentation show slides. This is a two stage process. The stages in this process are finance, marketing, management, investment, analysis.

Clustered Column Graph Ppt PowerPoint Presentation Layouts
This is a clustered column graph ppt powerpoint presentation layouts. This is a two stage process. The stages in this process are finance, marketing, management, investment, analysis.
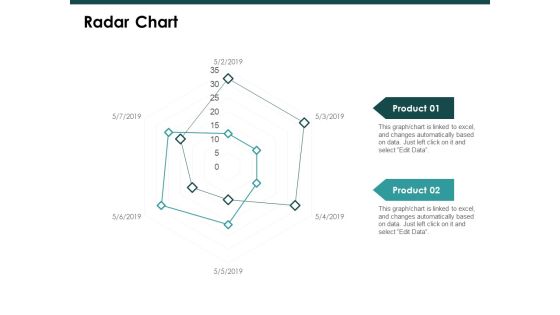
Radar Chart Graph Ppt PowerPoint Presentation Slide
This is a radar chart graph ppt powerpoint presentation slide. This is a two stage process. The stages in this process are finance, marketing, management, investment, analysis.

Clustered Bar Graph Ppt PowerPoint Presentation Templates
This is a clustered bar graph ppt powerpoint presentation templates. This is a three stage process. The stages in this process are finance, marketing, management, investment, analysis.
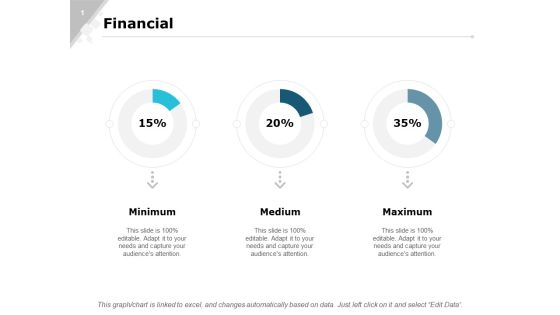
Financial Graph Ppt PowerPoint Presentation Visuals
This is a financial graph ppt powerpoint presentation visuals. This is a three stage process. The stages in this process are finance, marketing, analysis, investment, million.

Stock Photo Smartphone Business Graph PowerPoint Slide
This image slide displays smartphone with bar graph. This image slide has been crafted with graphic of smart phone with bar graph on screen on grey shaded background. Use this image slide to express views on technology and business management. Make wonderful presentations using this image slide.
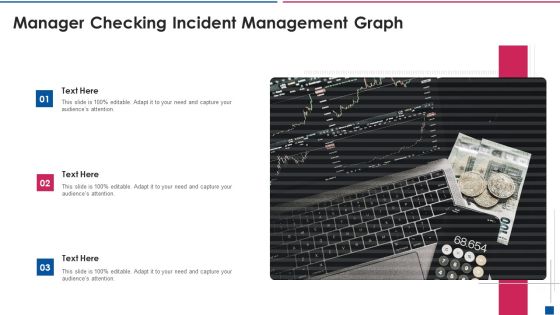
Manager Checking Incident Management Graph Clipart PDF
Persuade your audience using this manager checking incident management graph clipart pdf. This PPT design covers three stages, thus making it a great tool to use. It also caters to a variety of topics including manager checking incident management graph. Download this PPT design now to present a convincing pitch that not only emphasizes the topic but also showcases your presentation skills.
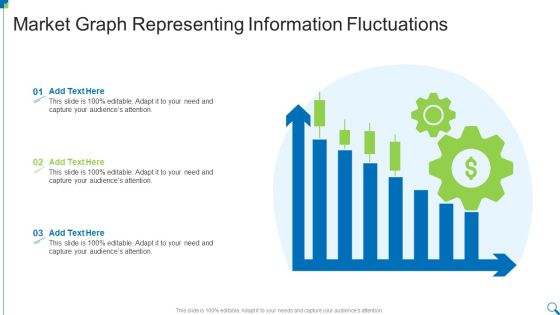
Market Graph Representing Information Fluctuations Diagrams PDF
Presenting Market Graph Representing Information Fluctuations Diagrams PDF to dispense important information. This template comprises three stages. It also presents valuable insights into the topics including Market Graph, Representing, Information Fluctuations This is a completely customizable PowerPoint theme that can be put to use immediately. So, download it and address the topic impactfully.
Investment Portfolio Advantages Graph Icon Rules PDF
Presenting Investment Portfolio Advantages Graph Icon Rules PDF to dispense important information. This template comprises three stages. It also presents valuable insights into the topics including Investment Portfolio, Advantages Graph Icon. This is a completely customizable PowerPoint theme that can be put to use immediately. So, download it and address the topic impactfully.

Bar Graph Business PowerPoint Template 1110
Abstract vector background with bar graphs and dollar sign

Graph And Chart Business PowerPoint Template 1110
Graphs and charts with compass. Workplace of businessman
Business Concepts 3d Team Discussing Bar Graph
Put In A Dollop Of Our Business Concepts 3d Team Discussing Bar Graph Powerpoint Templates. Give Your Thoughts A Distinctive Flavor. Create Your Domain With Our marketing Powerpoint Templates. Rule Minds With Your Thoughts.
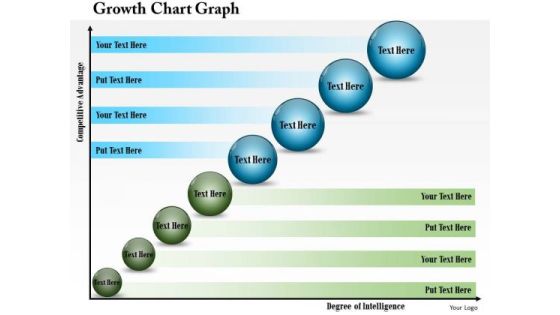
Business Diagram Growth Chart Graph Presentation Template
This business diagram has been designed x-y graph of competitive advantage and degree of intelligence. This diagram depicts the business growth chart. Give professional appearance to your presentations using this business slide.
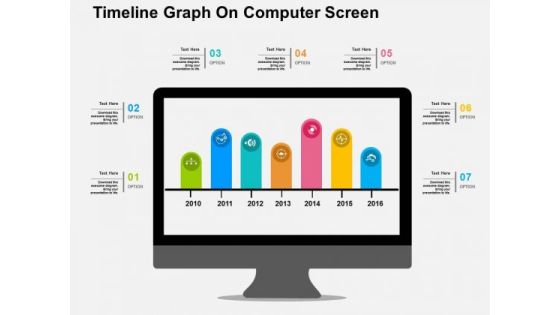
Timeline Graph On Computer Screen PowerPoint Template
Create dynamic presentations with our professional template containing diagram of bar graph on computer screen. This diagram is useful to display business timeline. Download this template to leave permanent impression on your audience.

Bar Graph On Tablet PowerPoint Templates
Create dynamic presentations with our professional template containing diagram of bar graph on computer tablet. You may use this slide to portray concepts like business, growth, success etc. Present your views using our innovative slide.

Graph To Evaluate Potential Investments PowerPoint Templates
Use this diagram to evaluate potential investments. This PPT slide contains bar graph with icons. This slide is designed to attract the attention of your audience towards business plan evaluation.

Profit Growth Graph With Gears Powerpoint Template
This business slide contains profit growth graph with gears. This PowerPoint template helps to display outline of business plan. Use this diagram to impart more clarity to data and to create more sound impact on viewers.

Bar Graph With Five Icons Powerpoint Slides
This PowerPoint slide contains diagram bar graph with icons. This PPT slide helps to exhibit concepts of financial deal and planning. Use this business slide to make impressive presentations.

Business Capital Investors Graph Powerpoint Presentation
This is a business capital investors graph powerpoint presentation. This is a five stage process. The stages in this process are public, venture capital, seed capital, angles, grants f and f$.

Pareto Marketing Analysis Graph Diagram Powerpoint Guide
This is a pareto marketing analysis graph diagram powerpoint guide. This is a seven stage process. The stages in this process are google advertisements, trade shows, conferences, blog and websites, online advertising, magazine advertisements, print advertising.

Pareto Analysis Bar Graph Powerpoint Slide Deck
This is a pareto analysis bar graph powerpoint slide deck. This is a ten stage process. The stages in this process are restaurant complaints, total complaints, complaints pricing and service, pricing and service, analysis bring down complaints, category.

Channel Sales Performance Graph Ppt Slide Examples
This is a channel sales performance graph ppt slide examples. This is a four stage process. The stages in this process are jan, feb, mar, apr, may, jun, jul, aug, sep.

Bar Graph Ppt PowerPoint Presentation Slides Deck
This is a bar graph ppt powerpoint presentation slides deck. This is a three stage process. The stages in this process are financial in years, product, sales in percentage.

Bar Graph Ppt PowerPoint Presentation Gallery Grid
This is a bar graph ppt powerpoint presentation gallery grid. This is a three stage process. The stages in this process are sales in percentage, product, finance, business, marketing.
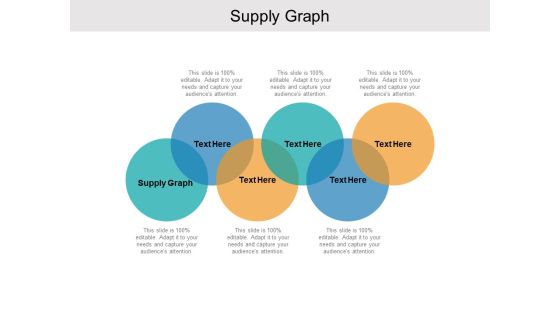
Supply Graph Ppt PowerPoint Presentation Show Cpb
Presenting this set of slides with name supply graph ppt powerpoint presentation show cpb. This is an editable Powerpoint six stages graphic that deals with topics like supply graph to help convey your message better graphically. This product is a premium product available for immediate download and is 100 percent editable in Powerpoint. Download this now and use it in your presentations to impress your audience.

Business People Vector Templates Download Graph PowerPoint
We present our business people vector templates download graph PowerPoint.Download our Computer PowerPoint Templates because You have the co-ordinates for your destination of success. Let our PowerPoint Templates and Slides map out your journey. Download and present our Business PowerPoint Templates because Our PowerPoint Templates and Slides will give good value for money. They also have respect for the value of your time. Use our People PowerPoint Templates because Watching this your Audience will Grab their eyeballs, they wont even blink. Use our Technology PowerPoint Templates because You canTake a leap off the starting blocks with our PowerPoint Templates and Slides. They will put you ahead of the competition in quick time. Use our Circle Charts PowerPoint Templates because They will Put your wonderful verbal artistry on display. Our PowerPoint Templates and Slides will provide you the necessary glam and glitter.Use these PowerPoint slides for presentations relating to 3d, abstract, action, background, business, businessman, career, carpet, cartoon,challenge, color, communication, company, competition, concept, corporate,design, finance, graph, graphic,growth, high, human, idea, illustration,individual, isolated, leader, man, motion, occupation, organization, people, person,red, render, shape, stair, step, success, symbol, top, up, white, winner, work,workforce. The prominent colors used in the PowerPoint template are Pink, Green, Yellow.

Bar Graph For Future Planning Powerpoint Template
This business diagram display bar graph for years 2015 and 2016. You may use this slide to display statistical analysis. This diagram provides an effective way of displaying information you can edit text, color, shade and style as per you need.

Bar Graph Displaying Profit Growth Powerpoint Slides
This PowerPoint template has been designed with six point?s bar graph with icons. This PPT slide can be used to prepare presentations for marketing reports and also for financial data analysis. You can download finance PowerPoint template to prepare awesome presentations.

Clustered Bar Graph Ppt PowerPoint Presentation Layouts
Presenting this set of slides with name clustered bar graph ppt powerpoint presentation layouts. The topics discussed in these slides are business, planning, strategy, marketing, management. This is a completely editable PowerPoint presentation and is available for immediate download. Download now and impress your audience.
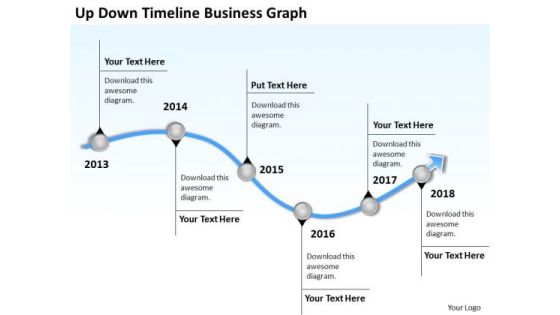
Business Analysis Diagrams PowerPoint Presentations Graph Templates
We present our business analysis diagrams powerpoint presentations graph templates.Download and present our Curves and Lines PowerPoint Templates because Your audience will believe you are the cats whiskers. Present our Business PowerPoint Templates because Our PowerPoint Templates and Slides will effectively help you save your valuable time. They are readymade to fit into any presentation structure. Present our Business PowerPoint Templates because Our PowerPoint Templates and Slides will give good value for money. They also have respect for the value of your time. Use our Arrows PowerPoint Templates because It will get your audience in sync. Present our Process and Flows PowerPoint Templates because It can Conjure up grand ideas with our magical PowerPoint Templates and Slides. Leave everyone awestruck by the end of your presentation.Use these PowerPoint slides for presentations relating to 3d, account, accounting, annual, balance, business, chart, commerce, crisis, data,earnings, economics, economy, exchange, figures, finance, financial, graph,graphic, growth, illustration, index, information, investment, list, line,management,market, marketing, money, monitoring, numbers, office, paperwork, plan, price,printout, report, research, sale, statistical, statistics, stock, success, tax, trade,work. The prominent colors used in the PowerPoint template are Blue light, Gray, White.
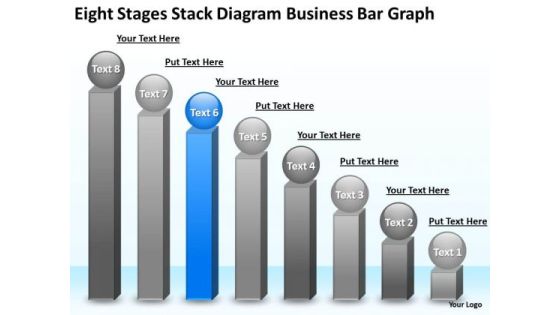
Business PowerPoint Presentations Bar Graph Plan Slides
We present our business powerpoint presentations bar graph plan Slides.Present our Business PowerPoint Templates because It will Raise the bar of your Thoughts. They are programmed to take you to the next level. Download our Spheres PowerPoint Templates because You can Channelise the thoughts of your team with our PowerPoint Templates and Slides. Urge them to focus on the goals you have set. Download our Competition PowerPoint Templates because Our PowerPoint Templates and Slides will let you Leave a lasting impression to your audiences. They possess an inherent longstanding recall factor. Present our Shapes PowerPoint Templates because It will get your audience in sync. Use our Success PowerPoint Templates because Our PowerPoint Templates and Slides will let you Leave a lasting impression to your audiences. They possess an inherent longstanding recall factor.Use these PowerPoint slides for presentations relating to bar, graph, statistics, economy, render, success, representation, diagram, graphic, achievment, obstruction, chevron, accounting, finances, energy eco, steps, figure, tall, barrier, strategy, ladder, up, planning, high, climb, stripes, growth, maintenance, profit, successful, repair, return, gradient, sustainability, financial, construction, upwards, increasing. The prominent colors used in the PowerPoint template are Blue, Gray, White.
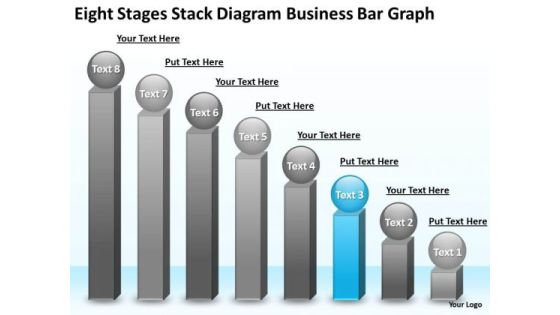
PowerPoint Presentations Bar Graph Business Plan Templates
We present our powerpoint presentations bar graph business plan templates.Use our Finance PowerPoint Templates because Our PowerPoint Templates and Slides are created by a hardworking bunch of busybees. Always flitting around with solutions gauranteed to please. Download our Leadership PowerPoint Templates because Our PowerPoint Templates and Slides are endowed to endure. Ideas conveyed through them will pass the test of time. Use our Business PowerPoint Templates because Your ideas provide food for thought. Our PowerPoint Templates and Slides will help you create a dish to tickle the most discerning palate. Use our Success PowerPoint Templates because Our PowerPoint Templates and Slides will provide you a launch platform. Give a lift off to your ideas and send them into orbit. Use our Spheres PowerPoint Templates because You can Bait your audience with our PowerPoint Templates and Slides. They will bite the hook of your ideas in large numbers.Use these PowerPoint slides for presentations relating to Concepts, Leadership, Success, Human, Achievement, Wink, Business, Ball, Three-Dimensional, Sign, Template, Diagram, Change, Character, Graphic, Stock, Development, Shape, Graph, Finances, Steps, Chart, Sphere, Examining, Up, Nice, Planning, Face, Growth, Person, Progress, Increases, Improvement, Image, Mimicry, Financial, Staircase. The prominent colors used in the PowerPoint template are Blue, Gray, Black.

Circular Graph For Statistical Information PowerPoint Template
Visually support your presentation with our above template showing circular graph. This slide has been professionally designed to present statistical information. This template offers an excellent background to build impressive presentation.

Graph Showing Economy Crash PowerPoint Templates
This business slide contains design of graph. This diagram is suitable to present downfall and economy crash. Visual effect of this diagram helps in maintaining the flow of the discussion and provides more clarity to the subject.

Illustration Of Dollar Growth Graph PowerPoint Template
This business slide contains graphics of dollar symbols on graph. This diagram helps to portray concept of financial planning. Present your views using this innovative slide and be assured of leaving a lasting impression.

Growth Graph With Design Elements PowerPoint Templates
The above template displays growth bar graph. This PowerPoint template signifies the concept of business and financial planning. Adjust the above diagram in your business presentations to visually support your content.

Graph For Sample Strategic Plans Powerpoint Template
Create dynamic presentations with our professional template containing bar graph. This diagram is useful to depict sample strategic plan. Download this template to leave permanent impression on your audience.
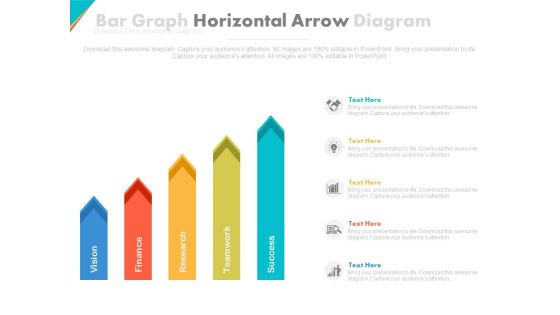
Five Horizontal Arrows Bar Graph Powerpoint Slides
This PowerPoint template contains five horizontal arrows bra graph. You may download this PPT slide design to display steps of strategic planning. You can easily customize this template to make it more unique as per your need.

Spain Map With Growth Graph Powerpoint Slides
This PowerPoint template displays Spain map with growth graph. This PPT template can be used in business presentations to depict economic growth of country. This slide can also be used by school students for educational projects.
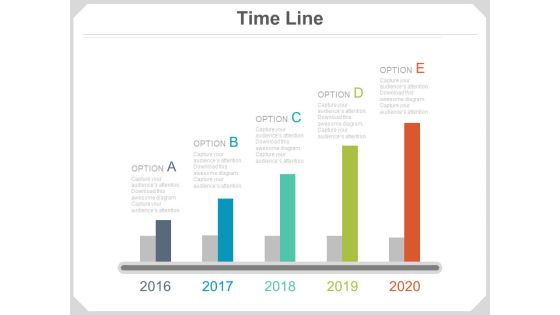
Five Growth Steps Timeline Graph Powerpoint Slides
This PowerPoint timeline slide design can be used to display growth steps. This timeline template has been designed with timeline growth graph. Download this PowerPoint timeline template to make impressive presentations.
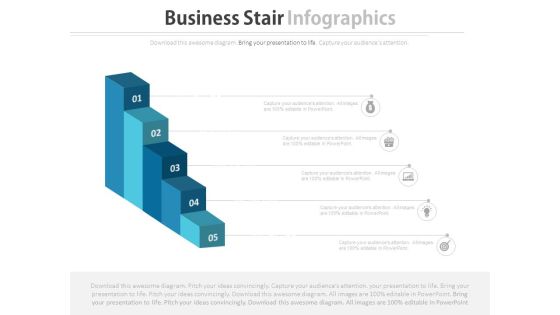
Five Steps Growth Bar Graph Powerpoint Template
This business template has been designed with five steps growth bar graph. This business diagram helps to bullet point your thoughts and ideas. Download this diagram to make interactive presentations.

Bar Graph For Statistical Analysis Powerpoint Template
Our above PPT slide contains computer screen on a desk displaying bar graph. This PowerPoint template may be used to display statistical analysis. This template is designed to attract the attention of your audience.

Dollar Graph Business PowerPoint Template 0610
Business Diagram it is isolated on a white background
Bar Graph Slashed PowerPoint Icon C
budget cuts layoffs and dropped sales business model
Bar Graph Slashed PowerPoint Icon Cc
budget cuts layoffs and dropped sales business model
Bar Graph Slashed PowerPoint Icon S
budget cuts layoffs and dropped sales business model

Graph Chart Business PowerPoint Template 0810
illustration composed by charts word map and globe

Analizing Graph Business PowerPoint Template 0910
3d illustration of business diagram prints and pie chart

Growing Graph Laptop Business PowerPoint Template 0910
modern laptop isolated on a white background

Training Graph Business PowerPoint Template 0910
good jobs (by 3D cubes crossword series)

Market Graph Business PowerPoint Template 0810
Closeup of pen showing on sales report

Business Graph Finance PowerPoint Template 0910
business bar chart with arrows isolated on a white background.

Graph Business PowerPoint Background And Template 1210
Microsoft PowerPoint Template and Background with a 3d rendering of a gold bars histogram

Business Graph Adjust PowerPoint Icon C
Microsoft powerpoint template and Background with a multi colored bar chart inside the center opening of a large gear

Business Graph Adjust PowerPoint Icon Cc
Microsoft powerpoint template and Background with a multi colored bar chart inside the center opening of a large gear

Business Graph Adjust PowerPoint Icon F
Microsoft powerpoint template and Background with a multi colored bar chart inside the center opening of a large gear

Business Graph Adjust PowerPoint Icon R
Microsoft powerpoint template and Background with a multi colored bar chart inside the center opening of a large gear

Business Graph Adjust PowerPoint Icon S
Microsoft powerpoint template and Background with a multi colored bar chart inside the center opening of a large gear

Bar Graph For Business Growth Powerpoint Templates
This PowerPoint slide contains graphics bar chart. This slide helps to exhibit business growth analysis. Sparkling thoughts are swirling around in your head. Filter them through with this diagram slide.

Statistics Graph Business PowerPoint Presentation Slides C
Microsoft Powerpoint Slides and Backgrounds with business statistics in white with a green arrow

Statistics Graph Business PowerPoint Presentation Slides Cc
Microsoft Powerpoint Slides and Backgrounds with business statistics in white with a green arrow

Statistics Graph Business PowerPoint Presentation Slides F
Microsoft Powerpoint Slides and Backgrounds with business statistics in white with a green arrow
Statistics Graph Business PowerPoint Presentation Slides R
Microsoft Powerpoint Slides and Backgrounds with business statistics in white with a green arrow

Statistics Graph Business PowerPoint Presentation Slides S
Microsoft Powerpoint Slides and Backgrounds with business statistics in white with a green arrow
Graph Symbol Business PowerPoint Presentation Slides C
Microsoft PowerPoint Templates and Backgrounds with digital footage of business symbol
Graph Symbol Business PowerPoint Presentation Slides Cc
Microsoft PowerPoint Templates and Backgrounds with digital footage of business symbol
Graph Symbol Business PowerPoint Presentation Slides F
Microsoft PowerPoint Templates and Backgrounds with digital footage of business symbol
Graph Symbol Business PowerPoint Presentation Slides R
Microsoft PowerPoint Templates and Backgrounds with digital footage of business symbol
Graph Symbol Business PowerPoint Presentation Slides S
Microsoft PowerPoint Templates and Backgrounds with digital footage of business symbol

Business Graph Success PowerPoint Presentation Slides C
Microsoft Powerpoint Slides and Backgrounds with isolated image of a young business man drawing increasing graphics with red line
Business Graph Success PowerPoint Presentation Slides Cc
Microsoft Powerpoint Slides and Backgrounds with isolated image of a young business man drawing increasing graphics with red line

Business Graph Success PowerPoint Presentation Slides F
Microsoft Powerpoint Slides and Backgrounds with isolated image of a young business man drawing increasing graphics with red line
Business Graph Success PowerPoint Presentation Slides R
Microsoft Powerpoint Slides and Backgrounds with isolated image of a young business man drawing increasing graphics with red line

Business Graph Success PowerPoint Presentation Slides S
Microsoft Powerpoint Slides and Backgrounds with isolated image of a young business man drawing increasing graphics with red line

Team With Bar Graph And Teamwork
This Power Point template has been designed with graphic of 3d team forming a pie chart. In this slide team is displaying data analysis and comparison. Use this editable slide to build innovative presentation for your viewers.
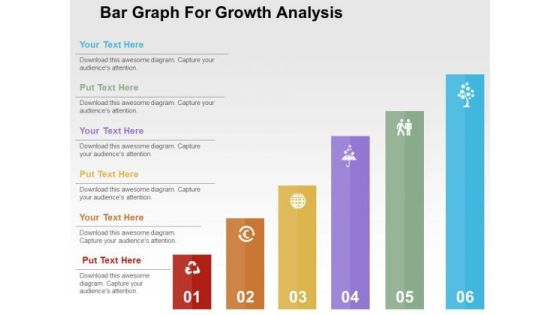
Bar Graph For Growth Analysis PowerPoint Template
This slide contains graphics bar chart. This slide helps to exhibit business growth analysis. Sparkling thoughts are swirling around in your head. Filter them through with this diagram slide.

Bar Graph For Statistical Analysis Powerpoint Slides
This PowerPoint template has been designed with bar chart and percentage values. You may download this PPT slide to depict statistical analysis. Add this slide to your presentation and impress your superiors.

Business Deal Graph Icons Illustration Powerpoint Template
This PowerPoint template has been designed with infographic layout. Download this diagram slide to display concepts of business deal, strategy and success. You can edit text, color, shade and style of this diagram as per you need.
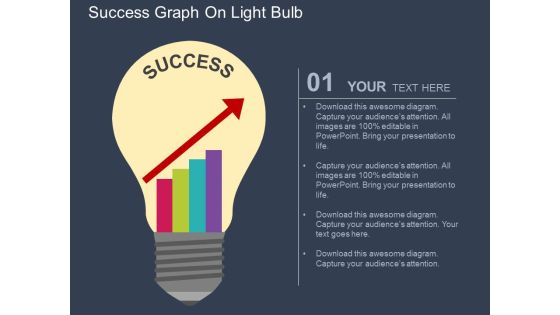
Success Graph On Light Bulb Powerpoint Templates
Adjust the above image into your Presentations to visually support your content. This slide has been professionally designed with four arrow banner. This template offers an excellent background to display corporate planning.

Security Analysis Bar Graph Ppt Slides
This is a security analysis bar chart ppt slides. This is a one stage process. The stages in this process are business, finance, marketing.

Bar Graph For Sales Inflow And Goals Graph Ppt PowerPoint Presentation Infographics Visual Aids PDF
Pitch your topic with ease and precision using this bar graph for sales inflow and goals graph ppt powerpoint presentation infographics visual aids pdf. This layout presents information on sales revenue vs target, new customer, congrats target is met. It is also available for immediate download and adjustment. So, changes can be made in the color, design, graphics or any other component to create a unique layout.

Business Diagram Colored Pie Graph Style Bar Graph For Result Representation Presentation Template
Concept of business result analysis has been displayed in this power point template. This PPT contains the colored pie graph with bar graph. Use this PPT for your business and marketing result analysis related presentations.
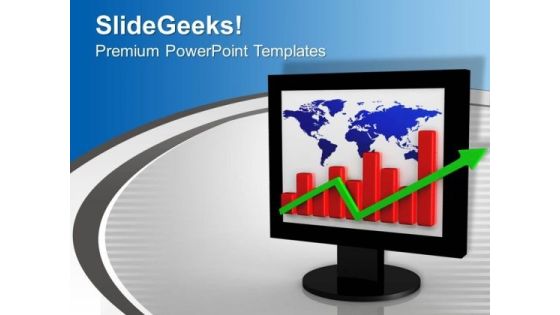
E Business Graph Showing Graph PowerPoint Templates Ppt Backgrounds For Slides 0213
We present our E Business Graph Showing Graph PowerPoint Templates PPT Backgrounds For Slides 0213.Use our Computer PowerPoint Templates because Our PowerPoint Templates and Slides will effectively help you save your valuable time. They are readymade to fit into any presentation structure. Present our Arrows PowerPoint Templates because Our PowerPoint Templates and Slides are created by a hardworking bunch of busybees. Always flitting around with solutions gauranteed to please. Use our Network Diagrams PowerPoint Templates because Our PowerPoint Templates and Slides will bullet point your ideas. See them fall into place one by one. Download our Finance PowerPoint Templates because Our PowerPoint Templates and Slides help you meet the demand of the Market. Just browse and pick the slides that appeal to your intuitive senses. Download and present our Marketing PowerPoint Templates because Our PowerPoint Templates and Slides will provide weight to your words. They will bring out the depth of your thought process.Use these PowerPoint slides for presentations relating to E business graph showing graph, computer, arrows, network diagrams, finance, marketing. The prominent colors used in the PowerPoint template are Red, Green, Blue.
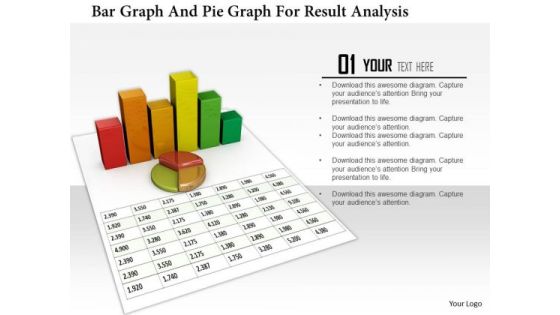
Stock Photo Bar Graph And Pie Graph For Result Analysis PowerPoint Slide
3D business graphs have been used to design this PowerPoint template. This Image slide is suitable to make business reports and charts. This slide can be used for business and marketing presentations.

Business Graph Finance PowerPoint Templates And PowerPoint Themes 0612
Business Graph Finance PowerPoint Templates And PowerPoint Themes Business PPT Templates-Business graph, finance, marketing, success, circle charts, business

Business Graph Money PowerPoint Templates And PowerPoint Backgrounds 0511
Microsoft PowerPoint Template and Background with business graph with profits rising off the chart graph

Business Graph Money PowerPoint Themes And PowerPoint Slides 0511
Microsoft PowerPoint Slide and Theme with business graph with profits rising off the chart graph

Business Graph Success PowerPoint Templates And PowerPoint Themes 0612
Business Graph Success PowerPoint Templates And PowerPoint Themes Business-Microsoft Powerpoint Templates and Background with success graph

Business Graph Marketing PowerPoint Templates And PowerPoint Themes 0712
Business Graph Marketing PowerPoint Templates And PowerPoint Themes 0712-Microsoft Powerpoint Templates and Background with business graph

Business Graph Money PowerPoint Templates And PowerPoint Themes 0712
Business Graph Money PowerPoint Templates And PowerPoint Themes 0712-Microsoft Powerpoint Templates and Background with business graph

 Home
Home