Errc Graph
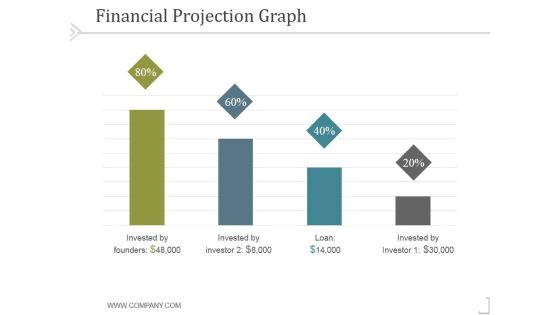
Financial Projection Graph Template 1 Ppt PowerPoint Presentation Model
This is a financial projection graph template 1 ppt powerpoint presentation model. This is a four stage process. The stages in this process are business, strategy, marketing, success, analysis.
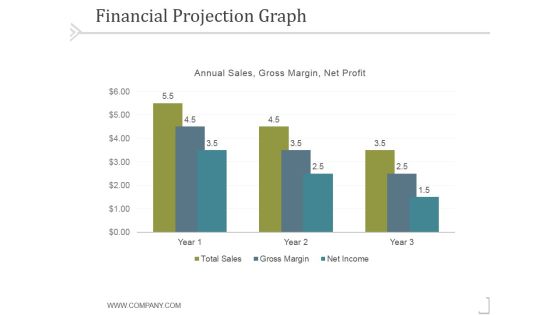
Financial Projection Graph Template 2 Ppt PowerPoint Presentation Template
This is a financial projection graph template 2 ppt powerpoint presentation template. This is a three stage process. The stages in this process are business, strategy, marketing, success, analysis.

Financial Projection Graph Template 1 Ppt PowerPoint Presentation Graphics
This is a financial projection graph template 1 ppt powerpoint presentation graphics. This is a three stage process. The stages in this process are annual sales, business, management, marketing, strategy.

Financial Projection Graph Template 2 Ppt PowerPoint Presentation Ideas
This is a financial projection graph template 2 ppt powerpoint presentation ideas. This is a nine stage process. The stages in this process are annual sales, business, management, marketing, strategy.

Financial Projection Graph Template 1 Ppt PowerPoint Presentation Clipart
This is a financial projection graph template 1 ppt powerpoint presentation clipart. This is a three stage process. The stages in this process are annual, sales, forecast, finance, marketing.
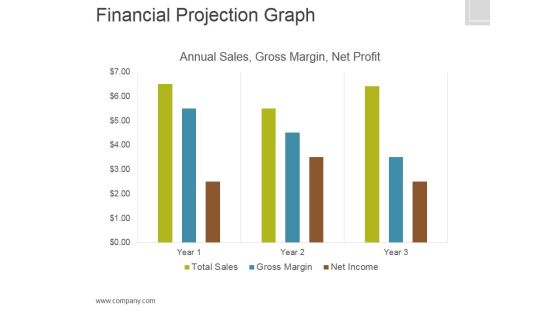
Financial Projection Graph Template 2 Ppt PowerPoint Presentation Graphics
This is a financial projection graph template 2 ppt powerpoint presentation graphics. This is a three stage process. The stages in this process are annual sales, gross margin, net profit, finance.

Gap Analysis Graph Ppt PowerPoint Presentation Portfolio Topics
This is a gap analysis graph ppt powerpoint presentation portfolio topics. This is a four stage process. The stages in this process are potential performance, diversification, product development, market growth, market penetration, actual performance.
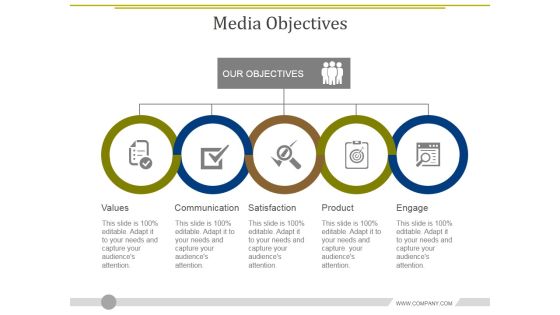
Media Objectives Template 2 Ppt PowerPoint Presentation Diagram Graph Charts
This is a media objectives template 2 ppt powerpoint presentation diagram graph charts. This is a five stage process. The stages in this process are values, communication, satisfaction, product, engage.
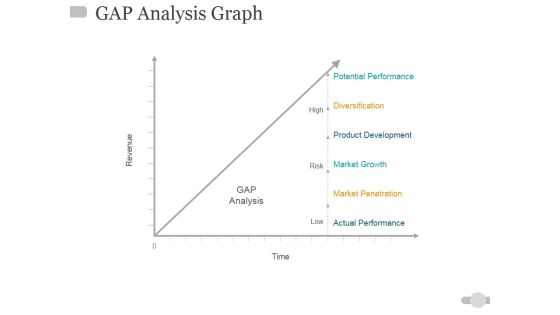
Gap Analysis Graph Ppt PowerPoint Presentation Inspiration Picture
This is a gap analysis graph ppt powerpoint presentation inspiration picture. This is a one stage process. The stages in this process are high, risk, low, time, gap analysis, revenue.

Bar Graph Ppt PowerPoint Presentation Summary Infographic Template
This is a bar graph ppt powerpoint presentation summary infographic template. This is a seven stage process. The stages in this process are business, strategy, marketing, analysis, growth strategy.
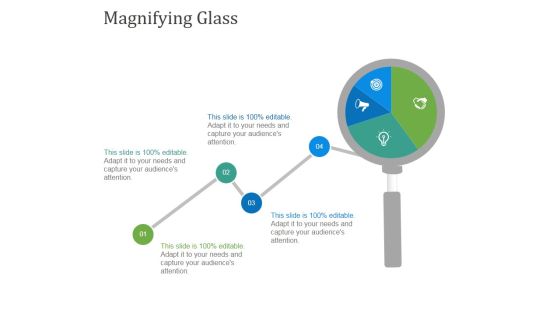
Magnifying Glass Ppt PowerPoint Presentation Diagram Graph Charts
This is a magnifying glass ppt powerpoint presentation diagram graph charts. This is a one stage process. The stages in this process are magnifying glass, planning, marketing, business, management, strategy.

Our Goal Ppt PowerPoint Presentation Diagram Graph Charts
This is a our goal ppt powerpoint presentation diagram graph charts. This is a three stage process. The stages in this process are trust and sincerity, reliability, commitment and dedication.

Gap Analysis Graph Ppt Powerpoint Presentation Gallery Sample
This is a gap analysis graph ppt powerpoint presentation gallery sample. This is a six stage process. The stages in this process are potential performance, diversification, market growth, market penetration.
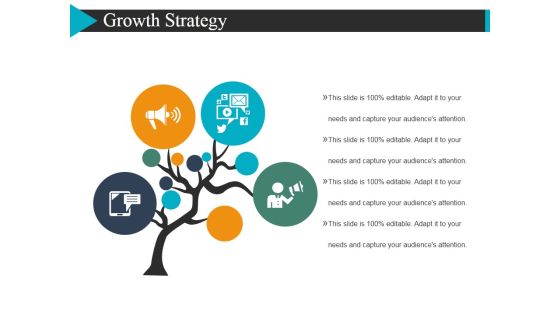
Growth Strategy Template 2 Ppt Powerpoint Presentation Diagram Graph Charts
This is a growth strategy template 2 ppt powerpoint presentation diagram graph charts. This is a four stage process. The stages in this process are tree, marketing, business, icons.

Gap Analysis Graph Ppt PowerPoint Presentation Slides Graphics Pictures
This is a gap analysis graph ppt powerpoint presentation slides graphics pictures. This is a five stage process. The stages in this process are revenue, time, high, low, risk.
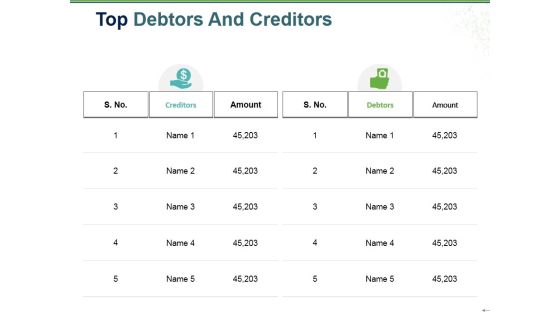
Top Debtors And Creditors Ppt PowerPoint Presentation Diagram Graph Charts
This is a top debtors and creditors ppt powerpoint presentation diagram graph charts. This is a five stage process. The stages in this process are amount, creditors, debtors, icons, strategy.

Knowledge On Our Competitors Ppt PowerPoint Presentation Diagram Graph Charts
This is a knowledge on our competitors ppt powerpoint presentation diagram graph charts. This is a six stage process. The stages in this process are services, strategy, quality, prices, other.
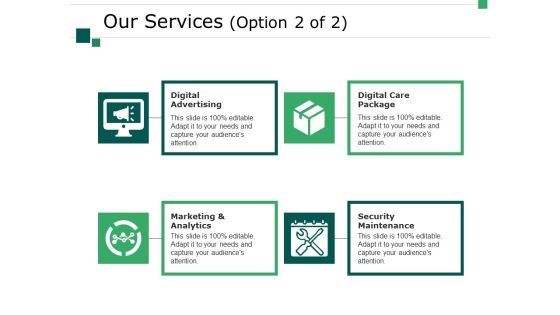
Our Services Template 2 Ppt PowerPoint Presentation Diagram Graph Charts
This is a our services template 2 ppt powerpoint presentation diagram graph charts. This is a four stage process. The stages in this process are business, digital advertising, digital care package, security maintenance, marketing and analytics, marketing, icons.

Machine Learning Main Points Ppt PowerPoint Presentation Diagram Graph Charts
This is a machine learning main points ppt powerpoint presentation diagram graph charts. This is a four stages process. The stages in this process are learning, pattern detection, programming, data, machine learning main points.

Clustered Column Graph Finance Investment Ppt PowerPoint Presentation Outline Icons
This is a clustered column graph finance investment ppt powerpoint presentation outline icons. This is a three stage process. The stages in this process are finance, investment, business, marketing, analysis.

Clustered Bar Graph Ppt PowerPoint Presentation Pictures Example File
This is a clustered bar graph ppt powerpoint presentation pictures example file. This is a two stage process. The stages in this process are finance, marketing, management, investment, analysis.

Bar Graph Financial Sales Product Ppt PowerPoint Presentation Icon Vector
This is a bar graph financial sales product ppt powerpoint presentation icon vector. This is a five stage process. The stages in this process are business, management, financial, marketing, sales.

Price Quality Relationship Graph Ppt PowerPoint Presentation Show Design Templates
This is a price quality relationship graph ppt powerpoint presentation show design templates. This is a two stage process. The stages in this process are cost benefit analysis, cost benefit investigation, cost benefit examination.

Bar Graph Finance Ppt PowerPoint Presentation Infographics Designs Download
This is a bar graph finance ppt powerpoint presentation infographics designs download. This is a three stage process. The stages in this process are finance, marketing, management, investment, analysis.

Successful Employee Referral Programs Ppt PowerPoint Presentation Diagram Graph Charts
This is a successful employee referral programs ppt powerpoint presentation diagram graph charts. This is a three stage process. The stages in this process are successful employee referral programs.

Bar Graph Employee Value Proposition Ppt PowerPoint Presentation File Layout
This is a bar graph employee value proposition ppt powerpoint presentation file layout. This is a three stage process. The stages in this process are business, management, strategy, analysis, marketing.
Growth Trend Arrow Graph Icon Ppt PowerPoint Presentation Summary Model
This is a growth trend arrow graph icon ppt powerpoint presentation summary model. This is a one stage process. The stages in this process are growth, upward trends, uptrends, upward arrow.

Decline Arrow Graph Ppt PowerPoint Presentation Pictures Portfolio
This is a decline arrow graph ppt powerpoint presentation pictures portfolio. This is a four stage process The stages in this process are downward step, downward phases, downward process.

Career Promotion Graph Growth Ppt PowerPoint Presentation Infographics Show
This is a career promotion graph growth ppt powerpoint presentation infographics show. This is a three stage process. The stages in this process are career progression, career aspiration, career promotion powerpoint presentation slides.

Graph With Growth Arrow Vector Ppt Powerpoint Presentation Gallery Show
This is a graph with growth arrow vector ppt powerpoint presentation gallery show. This is a three stage process. The stages in this process are accelerator, seed accelerators, startup accelerator.

Product Comparison Data Bar Graph Ppt Powerpoint Presentation Slides Show
This is a product comparison data bar graph ppt powerpoint presentation slides show. This is a four stage process. The stages in this process are data presentation, content presentation, information presentation.

Commodities Exchange Basics Ppt Powerpoint Presentation Diagram Graph Charts
This is a commodities exchange basics ppt powerpoint presentation diagram graph charts. This is a four stage process. The stages in this process are finance, marketing, management, investment, analysis.

Bar Graph Marketing Process Ppt PowerPoint Presentation Ideas Example Introduction
This is a bar graph marketing process ppt powerpoint presentation ideas example introduction. This is a three stage process. The stages in this process are finance, management, strategy, analysis, marketing.

Column Chart And Graph Ppt PowerPoint Presentation File Introduction
This is a column chart and graph ppt powerpoint presentation file introduction. This is a three stage process. The stages in this process are finance, marketing, management, investment, analysis.

Clustered Column Line Graph Ppt PowerPoint Presentation Ideas Demonstration
This is a clustered column line graph ppt powerpoint presentation ideas demonstration. This is a three stage process. The stages in this process are financial, minimum, maximum, marketing, strategy.
Red Upward Arrow On Bar Graph Ppt Powerpoint Presentation Infographics
This is a red upward arrow on bar graph ppt powerpoint presentation infographics. This is a four stage process. The stages in this process are increasing arrows, improving arrows, growing arrows.

Scatter Bubble Chart Graph Ppt PowerPoint Presentation Infographic Template Maker
This is a scatter bubble chart graph ppt powerpoint presentation infographic template maker. This is a two stage process. The stages in this process are finance, marketing, management, investment, analysis.

Donut Pie Chart Graph Ppt PowerPoint Presentation File Styles
This is a donut pie chart graph ppt powerpoint presentation file styles. This is a three stage process. The stages in this process are finance, marketing, management, investment, analysis.

Stacked Bar Graph Ppt PowerPoint Presentation Portfolio Slide Portrait
This is a stacked bar graph ppt powerpoint presentation portfolio slide portrait. This is a three stage process. The stages in this process are finance, marketing, management, investment, analysis.

Clustered Bar Graph Ppt PowerPoint Presentation Model Background Designs
This is a clustered bar graph ppt powerpoint presentation model background designs. This is a three stage process. The stages in this process are finance, marketing, management, investment, analysis.

Donut Pie Chart Graph Ppt PowerPoint Presentation Ideas Guidelines
This is a donut pie chart graph ppt powerpoint presentation ideas guidelines. This is a three stage process. The stages in this process are finance, marketing, management, investment, analysis.

Clustered Column Line Graph Ppt PowerPoint Presentation File Clipart
This is a clustered column line graph ppt powerpoint presentation file clipart. This is a three stage process. The stages in this process are finance, marketing, management, investment, analysis.

Combo Chart Graph Ppt PowerPoint Presentation Infographic Template Layout Ideas
This is a combo chart graph ppt powerpoint presentation infographic template layout ideas. This is a three stage process. The stages in this process are finance, marketing, analysis, investment, million.

Clustered Column Line Graph Ppt PowerPoint Presentation Inspiration Deck
This is a clustered column line graph ppt powerpoint presentation inspiration deck. This is a three stage process. The stages in this process are finance, marketing, analysis, investment, million.

Bar Graph Finance Ppt PowerPoint Presentation Outline Background Designs
This is a bar graph finance ppt powerpoint presentation outline background designs. This is a three stage process. The stages in this process are financial, maximum, medium, minimum, marketing.
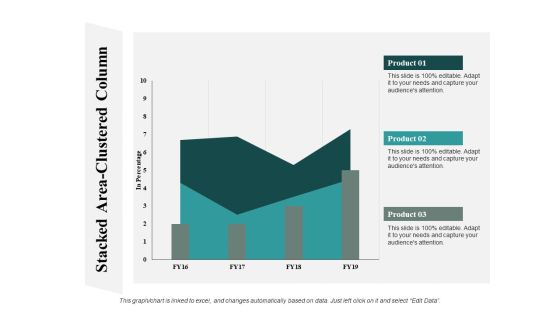
Stacked Area Clustered Column Graph Ppt PowerPoint Presentation Summary Guide
This is a stacked area clustered column graph ppt powerpoint presentation summary guide. This is a three stage process. The stages in this process are finance, marketing, analysis, investment, million.

Bar Graph With Red Progressive Arrow Ppt PowerPoint Presentation Outline
This is a bar graph with red progressive arrow ppt powerpoint presentation outline. This is a three stage process. The stages in this process are rising arrow, growing arrow, increasing arrow.

Combo Chart Graph Ppt PowerPoint Presentation Gallery Designs Download
This is a combo chart graph ppt powerpoint presentation gallery designs download. This is a three stage process. The stages in this process are finance, marketing, analysis, investment, million.

Area Chart Graph Ppt PowerPoint Presentation Professional Format Ideas
This is a column chart graph ppt powerpoint presentation slides file formats. This is a stage three process. The stages in this process are finance, marketing, analysis, investment, million.

Bar Graph Finance Ppt PowerPoint Presentation Pictures Portrait
This is a bar graph finance ppt powerpoint presentation pictures portrait. The topics discussed in this diagram are marketing, business, management, planning, strategy This is a completely editable PowerPoint presentation, and is available for immediate download.

Clustered Bar Graph Ppt PowerPoint Presentation File Design Inspiration
This is a clustered bar graph ppt powerpoint presentation file design inspiration. The topics discussed in this diagram are marketing, business, management, planning, strategy This is a completely editable PowerPoint presentation, and is available for immediate download.

Bubble Chart Graph Ppt PowerPoint Presentation Ideas Outfit
This is a bubble chart graph ppt powerpoint presentation ideas outfit. The topics discussed in this diagram are marketing, business, management, planning, strategy This is a completely editable PowerPoint presentation, and is available for immediate download.

Marketing Management Dashboard Graph Ppt PowerPoint Presentation Infographic Template Portfolio
This is a marketing management dashboard graph ppt powerpoint presentation infographic template portfolio. The topics discussed in this diagram are marketing, business, management, planning, strategy This is a completely editable PowerPoint presentation, and is available for immediate download.

Stacked Bar Graph Ppt PowerPoint Presentation Layouts Inspiration
This is a stacked bar graph ppt powerpoint presentation layouts inspiration. The topics discussed in this diagram are marketing, business, management, planning, strategy This is a completely editable PowerPoint presentation, and is available for immediate download.

Clustered Bar Graph Ppt PowerPoint Presentation Outline Ideas
This is a clustered bar graph ppt powerpoint presentation outline ideas. The topics discussed in this diagram are marketing, business, management, planning, strategy This is a completely editable PowerPoint presentation, and is available for immediate download.

Bar Graph Business PowerPoint Templates And PowerPoint Themes 0512
Bar Graph Business PowerPoint Templates And PowerPoint Themes 0512-Microsoft Powerpoint Templates and Background with graph of business-These high quality PowerPoint templates and PowerPoint images are carefully selected by our team of professionals to convey your ideas in a visually appealing manner. Each download contains a text and print slide. The text and print slides show up automatically when you insert a new slide in the downloaded template
Bar Graph Success PowerPoint Templates And PowerPoint Themes 0512
Bar Graph Success PowerPoint Templates And PowerPoint Themes 0512-Microsoft Powerpoint Templates and Background with graph of business-These high quality PowerPoint templates and PowerPoint images are carefully selected by our team of professionals to convey your ideas in a visually appealing manner. Each download contains a text and print slide. The text and print slides show up automatically when you insert a new slide in the downloaded template

Cylinderical Bar Graph Business PowerPoint Templates And PowerPoint Themes 0512
Cylinderical Bar Graph Business PowerPoint Templates And PowerPoint Themes 0512-Microsoft Powerpoint Templates and Background with bar graph-These high quality PowerPoint templates and PowerPoint images are carefully selected by our team of professionals to convey your ideas in a visually appealing manner. Each download contains a text and print slide. The text and print slides show up automatically when you insert a new slide in the downloaded template
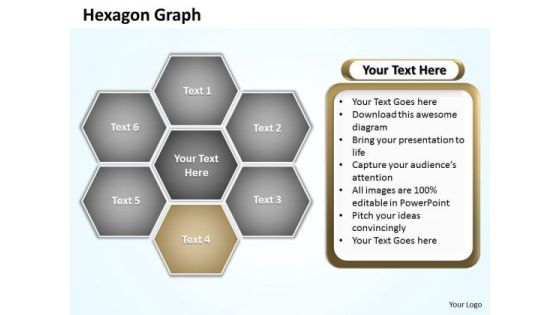
Ppt Hexagon Shapes Graph Editable PowerPoint Templates 2010
PPT hexagon shapes graph editable powerpoint templates 2010-Use this diagram to show the relationship to a central idea. Emphasizes both information in the center hexagon and how information in the outer hexagons contributes to the central idea. Transmit your thoughts via this slide and prod your team to action-PPT hexagon shapes graph editable powerpoint templates 2010-Abstract, Background, Design, Digital, Elements, Graphic, Grey, Hexagon, Illustration, Light, Modern, Perspective, Triangles, Shapes, Shiny, Style, Technology, Template, Vector, Vertical, Virtual, Wallpaper, Web

Ppt Linear Abstraction Arrow Animated Graph PowerPoint 2007 Templates
PPT linear abstraction arrow animated graph powerpoint 2007 Templates-Use this diagram to show a progression or sequential steps in a task, process, or workflow. They help to lay the base of your trend of thought and enhance the essence of your viable ideas. Create captivating presentations to deliver comparative and weighted arguments.-PPT linear abstraction arrow animated graph powerpoint 2007 Templates-analysis, arrow, background, business, chart, communication, concept, construction, delivery, design, development, engineering, fabrication, feasibiliti, generated, growth, idea, industry, making, production, products, science, sequence, shape

Stock Photo Bar Graph And Different Currencies PowerPoint Slide
This image slide displays bar graph with different currencies symbols. This image has been designed with graphic of bar graph, blue colored growth arrow and symbols of different currencies. Use this image slide, in your presentations to express views on finance, growth and achievements. This image slide may also be used to exhibit finance accounts in your presentations. This image slide will enhance the quality of your presentations.
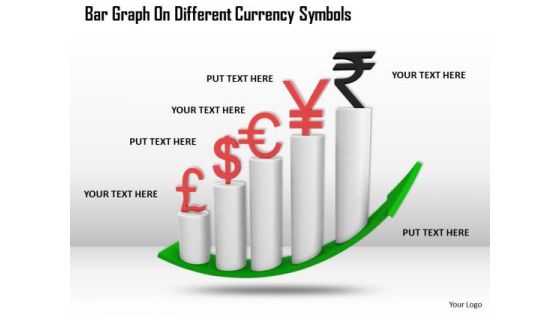
Stock Photo Bar Graph On Different Currency Symbols PowerPoint Slide
This image slide displays bar graph with different currency symbols. This image has been designed with graphic of bar graph, green colored growth arrow and symbols of different currencies. Use this image slide, in your presentations to express views on finance, monetary growth and achievements. This image slide may also be used to exhibit finance accounts in your presentations. This image slide will enhance the quality of your presentations.

Stock Photo Bar Graph With Dollar Currency Symbol PowerPoint Slide
This image slide displays bar graph with dollar currency symbol. This image has been designed with graphic of bar graph, red colored growth arrow and symbols of dollar currency. Use this image slide, in your presentations to express views on finance, growth and achievements. This image slide may also be used to exhibit finance accounts in your presentations. This image slide will enhance the quality of your presentations.
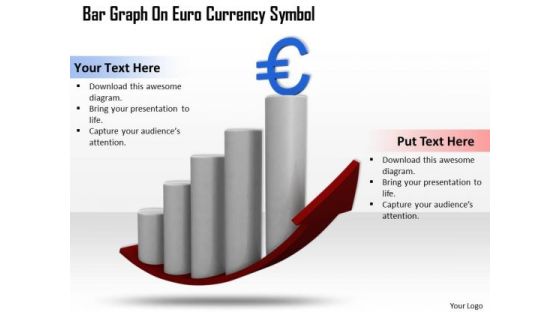
Stock Photo Bar Graph With Euro Currency Symbol PowerPoint Slide
This image slide displays bar graph with euro currency symbol. This image has been designed with graphic of bar graph, red colored growth arrow and symbols of euro currency. Use this image slide, in your presentations to express views on finance, growth and achievements. This image slide may also be used to exhibit finance accounts in your presentations. This image slide will enhance the quality of your presentations.
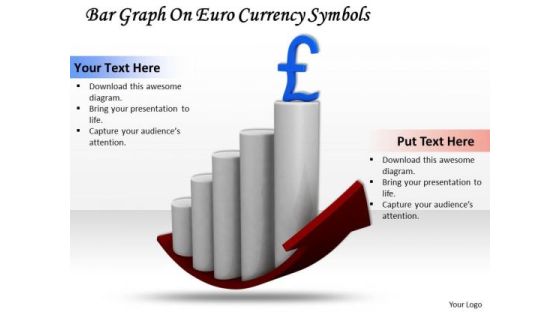
Stock Photo Bar Graph With Pound Currency Symbol PowerPoint Slide
This image slide displays bar graph with pound currency symbol. This image has been designed with graphic of bar graph, red colored growth arrow and symbols of pound currency. Use this image slide, in your presentations to express views on finance, growth and achievements. This image slide may also be used to exhibit finance accounts in your presentations. This image slide will enhance the quality of your presentations.
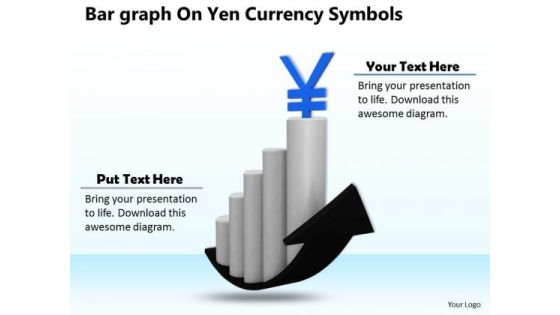
Stock Photo Bar Graph With Yen Currency Symbol PowerPoint Slide
This image slide displays bar graph with yen currency symbol. This image has been designed with graphic of bar graph, black colored growth arrow and symbols of pound currency. Use this image slide, in your presentations to express views on finance, growth and achievements. This image slide may also be used to exhibit finance accounts in your presentations. This image slide will enhance the quality of your presentations.

Keynesian Economics Graph Ppt PowerPoint Presentation Inspiration Example File Cpb
Presenting this set of slides with name keynesian economics graph ppt powerpoint presentation inspiration example file cpb. This is an editable Powerpoint four stages graphic that deals with topics like keynesian economics graph to help convey your message better graphically. This product is a premium product available for immediate download and is 100 percent editable in Powerpoint. Download this now and use it in your presentations to impress your audience.
Straight Line Graph Ppt PowerPoint Presentation Visual Aids Inspiration Cpb
Presenting this set of slides with name straight line graph ppt powerpoint presentation visual aids inspiration cpb. This is an editable Powerpoint three stages graphic that deals with topics like straight line graph to help convey your message better graphically. This product is a premium product available for immediate download and is 100 percent editable in Powerpoint. Download this now and use it in your presentations to impress your audience.
Unemployment Rate Graph Ppt PowerPoint Presentation Infographics Gallery Cpb
Presenting this set of slides with name unemployment rate graph ppt powerpoint presentation infographics gallery cpb. This is an editable Powerpoint five stages graphic that deals with topics like unemployment rate graph to help convey your message better graphically. This product is a premium product available for immediate download and is 100 percent editable in Powerpoint. Download this now and use it in your presentations to impress your audience.

Graph Demand Supply Ppt PowerPoint Presentation Layouts Design Templates Cpb
Presenting this set of slides with name graph demand supply ppt powerpoint presentation layouts design templates cpb. This is an editable Powerpoint six stages graphic that deals with topics like graph demand supply to help convey your message better graphically. This product is a premium product available for immediate download and is 100 percent editable in Powerpoint. Download this now and use it in your presentations to impress your audience.

Performance Graph Ppt PowerPoint Presentation Summary Example Topics Cpb
Presenting this set of slides with name performance graph ppt powerpoint presentation summary example topics cpb. This is an editable Powerpoint six stages graphic that deals with topics like performance graph to help convey your message better graphically. This product is a premium product available for immediate download and is 100 percent editable in Powerpoint. Download this now and use it in your presentations to impress your audience.

Commodity Price Graph Ppt PowerPoint Presentation Professional Information Cpb Pdf
Presenting this set of slides with name commodity price graph ppt powerpoint presentation professional information cpb pdf. This is an editable Powerpoint three stages graphic that deals with topics like commodity price graph to help convey your message better graphically. This product is a premium product available for immediate download and is 100 percent editable in Powerpoint. Download this now and use it in your presentations to impress your audience.

Credit Score Graph Ppt PowerPoint Presentation Model Visuals Cpb Pdf
Presenting this set of slides with name credit score graph ppt powerpoint presentation model visuals cpb pdf. This is an editable Powerpoint four stages graphic that deals with topics like credit score graph to help convey your message better graphically. This product is a premium product available for immediate download and is 100 percent editable in Powerpoint. Download this now and use it in your presentations to impress your audience.

Data Flow Graph Ppt PowerPoint Presentation Model Infographics Cpb Pdf
Presenting this set of slides with name data flow graph ppt powerpoint presentation model infographics cpb pdf. This is an editable Powerpoint six stages graphic that deals with topics like data flow graph to help convey your message better graphically. This product is a premium product available for immediate download and is 100 percent editable in Powerpoint. Download this now and use it in your presentations to impress your audience.

Deficit Spending Graph Ppt PowerPoint Presentation Summary Example Cpb Pdf
Presenting this set of slides with name deficit spending graph ppt powerpoint presentation summary example cpb pdf. This is an editable Powerpoint six stages graphic that deals with topics like deficit spending graph to help convey your message better graphically. This product is a premium product available for immediate download and is 100 percent editable in Powerpoint. Download this now and use it in your presentations to impress your audience.

Budget Constraint Graph Ppt PowerPoint Presentation Portfolio Mockup Cpb Pdf
Presenting this set of slides with name budget constraint graph ppt powerpoint presentation portfolio mockup cpb pdf. This is an editable Powerpoint six stages graphic that deals with topics like budget constraint graph to help convey your message better graphically. This product is a premium product available for immediate download and is 100 percent editable in Powerpoint. Download this now and use it in your presentations to impress your audience.
Period Sinusoidal Graph Ppt PowerPoint Presentation Summary Designs Cpb Pdf
Presenting this set of slides with name period sinusoidal graph ppt powerpoint presentation summary designs cpb pdf. This is an editable Powerpoint four stages graphic that deals with topics like period sinusoidal graph to help convey your message better graphically. This product is a premium product available for immediate download and is 100 percent editable in Powerpoint. Download this now and use it in your presentations to impress your audience.
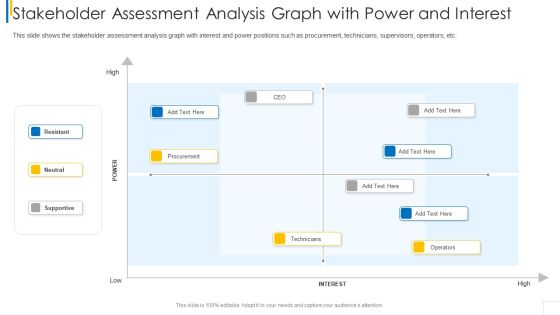
Stakeholder Assessment Analysis Graph With Power And Interest Ideas PDF
This slide shows the stakeholder assessment analysis graph with interest and power positions such as procurement, technicians, supervisors, operators, etc.Deliver an awe inspiring pitch with this creative stakeholder assessment analysis graph with power and interest ideas pdf bundle. Topics like resistant, neutral, supportive, procurement, technicians can be discussed with this completely editable template. It is available for immediate download depending on the needs and requirements of the user.
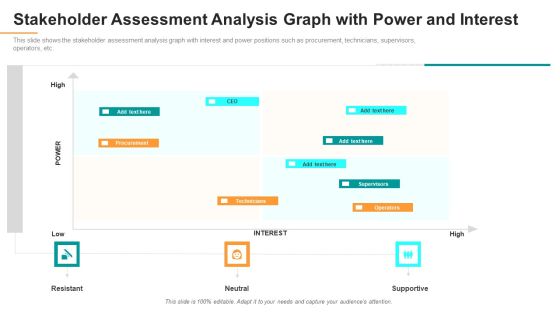
Stakeholder Assessment Analysis Graph With Power And Interest Introduction PDF
This slide shows the stakeholder assessment analysis graph with interest and power positions such as procurement, technicians, supervisors, operators, etc. Deliver and pitch your topic in the best possible manner with this stakeholder assessment analysis graph with power and interest introduction pdf. Use them to share invaluable insights on technicians, operators, interest and impress your audience. This template can be altered and modified as per your expectations. So, grab it now.
End Stage Project Results Icon With Graph Information PDF
Persuade your audience using this end stage project results icon with graph information pdf. This PPT design covers three stages, thus making it a great tool to use. It also caters to a variety of topics including end stage project results icon with graph. Download this PPT design now to present a convincing pitch that not only emphasizes the topic but also showcases your presentation skills.

Company Performance Dashboard Icon With Bar Graph Template PDF
Persuade your audience using this company performance dashboard icon with bar graph template pdf. This PPT design covers four stages, thus making it a great tool to use. It also caters to a variety of topics including company performance dashboard icon with bar graph. Download this PPT design now to present a convincing pitch that not only emphasizes the topic but also showcases your presentation skills.
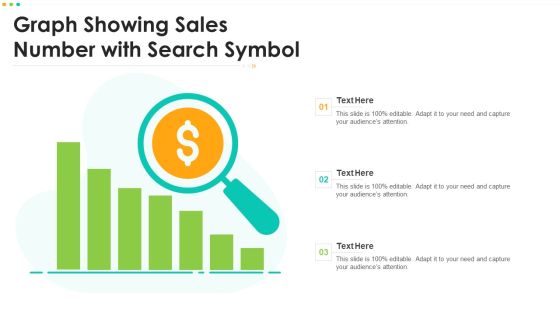
Graph Showing Sales Number With Search Symbol Professional PDF
Persuade your audience using this Graph Showing Sales Number With Search Symbol Professional PDF. This PPT design covers three stages, thus making it a great tool to use. It also caters to a variety of topics including Graph Showing Sales Number With Search Symbol. Download this PPT design now to present a convincing pitch that not only emphasizes the topic but also showcases your presentation skills.
Employee Productivity Enhancement Plan Icon With Bar Graph Slides PDF
Persuade your audience using this Employee Productivity Enhancement Plan Icon With Bar Graph Slides PDF This PPT design covers three stages, thus making it a great tool to use. It also caters to a variety of topics including Employee Productivity, Enhancement Plan, Bar Graph Download this PPT design now to present a convincing pitch that not only emphasizes the topic but also showcases your presentation skills.
Line Graph Icon Representing Growth In Internet Trend Rules PDF
Persuade your audience using this Line Graph Icon Representing Growth In Internet Trend Rules PDF This PPT design covers Four stages, thus making it a great tool to use. It also caters to a variety of topics including Line Graph, Icon Representing, Growth Internet Trend Download this PPT design now to present a convincing pitch that not only emphasizes the topic but also showcases your presentation skills.

Firm Marketing Dashboard Icon With Graph Ppt Summary Guide PDF
Persuade your audience using this Firm Marketing Dashboard Icon With Graph Ppt Summary Guide PDF. This PPT design covers three stages, thus making it a great tool to use. It also caters to a variety of topics including Firm Marketing, Dashboard Icon, Graph. Download this PPT design now to present a convincing pitch that not only emphasizes the topic but also showcases your presentation skills.
Yearly Comparison Graph Icon For Operating Profit Margin Topics PDF
Persuade your audience using this Yearly Comparison Graph Icon For Operating Profit Margin Topics PDF. This PPT design covers four stages, thus making it a great tool to use. It also caters to a variety of topics including Yearly Comparison Graph, Icon For Operating, Profit Margin. Download this PPT design now to present a convincing pitch that not only emphasizes the topic but also showcases your presentation skills.
Human Resource Graph Icon For Workforce Development Brochure PDF
Persuade your audience using this Human Resource Graph Icon For Workforce Development Brochure PDF. This PPT design covers three stages, thus making it a great tool to use. It also caters to a variety of topics including Workforce Development, Graph Icon, Human Resource. Download this PPT design now to present a convincing pitch that not only emphasizes the topic but also showcases your presentation skills.

2 Year Digital Evolution Icon With Bar Graph Demonstration PDF
Persuade your audience using this 2 Year Digital Evolution Icon With Bar Graph Demonstration PDF. This PPT design covers Four stages, thus making it a great tool to use. It also caters to a variety of topics including 2 Year Digital, Evolution Icon, Bar Graph. Download this PPT design now to present a convincing pitch that not only emphasizes the topic but also showcases your presentation skills.

Graph Clustering 2d PowerPoint Slides And Ppt Diagram Templates
Graph Clustering 2D PowerPoint Slides And PPT Diagram Templates-These high quality, editable pre-designed powerpoint slides have been carefully created by our professional team to help you impress your audience. Each graphic in every slide is vector based and is 100% editable in powerpoint. Each and every property of any slide - color, size, shading etc can be modified to build an effective powerpoint presentation. Use these slides to convey complex business concepts in a simplified manner. Any text can be entered at any point in the powerpoint slide. Simply DOWNLOAD, TYPE and PRESENT!
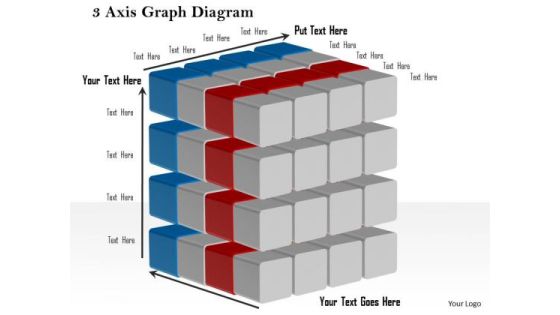
Business Framework 3 Axis Graph Diagram PowerPoint Presentation
This business diagram displays 3 axis graphs with cubes. This editable slide contains the concept of business and success. Use this diagram in your business presentations to display data in graphical manner.
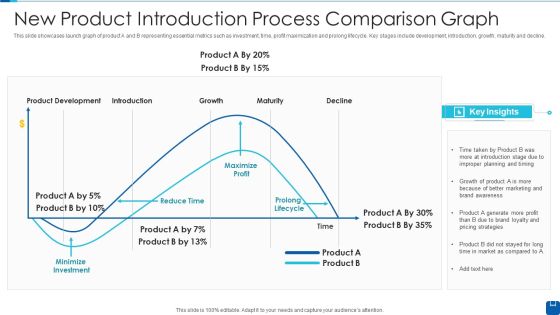
New Product Introduction Process Comparison Graph Slides PDF
This slide showcases launch graph of product A and B representing essential metrics such as investment, time, profit maximization and prolong lifecycle. Key stages include development, introduction, growth, maturity and decline.Showcasing this set of slides titled New Product Introduction Process Comparison Graph Slides PDF The topics addressed in these templates are Product Development, Improper Planning, Minimize Investment All the content presented in this PPT design is completely editable. Download it and make adjustments in color, background, font etc. as per your unique business setting.

Phases Of Business Partner Lifecycle With Graph Information PDF
The following slide highlights the phases of partner lifecycle with graph illustrating key headings which includes lifecycle phases, activity and comments, where lifecycle phases depicts initiation, formation, growth, maturity and final. Pitch your topic with ease and precision using this Phases Of Business Partner Lifecycle With Graph Information PDF. This layout presents information on Growth, Maturity, Targets. It is also available for immediate download and adjustment. So, changes can be made in the color, design, graphics or any other component to create a unique layout.

Business Graph Success PowerPoint Templates And PowerPoint Backgrounds 0211
Microsoft PowerPoint Template and Background with multiple business graphs displaying data

Abstract Bar Graph Business PowerPoint Templates And PowerPoint Backgrounds 0811
Microsoft PowerPoint Template and Background with abstract background with bar graphs

Business Graph Success PowerPoint Themes And PowerPoint Slides 0211
Microsoft PowerPoint Theme and Slide with multiple business graphs displaying data

Abstract Bar Graph Business PowerPoint Themes And PowerPoint Slides 0811
Microsoft PowerPoint Theme and Slide with abstract Slide with bar graphs
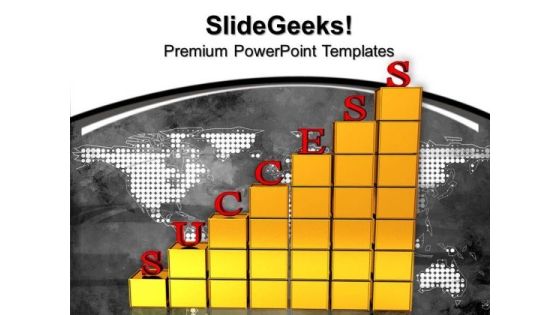
Success Graph Business PowerPoint Templates And PowerPoint Themes 1012
The above template displays a diagram of a bar graph showing success. This image represents the concept of growth in business. This image has been conceived to enable you to emphatically communicate your ideas in your Business PPT presentations. Create captivating presentations to deliver comparative and weighted arguments.

Business Graph Success PowerPoint Templates Ppt Backgrounds For Slides 1212
We present our Business Graph Success PowerPoint Templates PPT Backgrounds For Slides 1212.Download our Sales PowerPoint Templates because this slide can help to bullet point your views. Download and present our Business PowerPoint Templates because this template helps you to grab the attention of your listeners. Download and present our Marketing PowerPoint Templates because you are the Champion of your team shall anoint. Present our Finance PowerPoint Templates because this one depicts the popular chart. Download our Success PowerPoint Templates because your quest has taken you well onto the path of success.Use these PowerPoint slides for presentations relating to Business Growth Colorful Bar Diagram, Sales, Business, Marketing, Finance, Success. The prominent colors used in the PowerPoint template are Green, Blue, Red. Professionals tell us our Business Graph Success PowerPoint Templates PPT Backgrounds For Slides 1212 are Radiant. Use our Finance PowerPoint templates and PPT Slides are Lush. We assure you our Business Graph Success PowerPoint Templates PPT Backgrounds For Slides 1212 are Ultra. We assure you our Colorful PowerPoint templates and PPT Slides are Pleasant. Presenters tell us our Business Graph Success PowerPoint Templates PPT Backgrounds For Slides 1212 are the best it can get when it comes to presenting. PowerPoint presentation experts tell us our Diagram PowerPoint templates and PPT Slides are designed by a team of presentation professionals.

Business Graph 2013 PowerPoint Templates Ppt Backgrounds For Slides 1212
We present our Business Graph 2013 PowerPoint Templates PPT Backgrounds For Slides 1212.Use our Global PowerPoint Templates because so that you can Lead the way to spread good cheer to one and all. Download our Arrows PowerPoint Templates because they highlight the depth of your thought process. Use our New year PowerPoint Templates because you can Employ the right colours for your brilliant ideas. Present our Finance PowerPoint Templates because let this slide illustrates others piggyback on you to see well over the horizon. Use our Business PowerPoint Templates because watch the excitement levels rise as they realise their worth.Use these PowerPoint slides for presentations relating to Business growth of profits in 2013, global, arrows, new year, money, finance . The prominent colors used in the PowerPoint template are Blue, Red, Green. Professionals tell us our Business Graph 2013 PowerPoint Templates PPT Backgrounds For Slides 1212 are Endearing. You can be sure our 2013 PowerPoint templates and PPT Slides are second to none. PowerPoint presentation experts tell us our Business Graph 2013 PowerPoint Templates PPT Backgrounds For Slides 1212 are Radiant. Use our in PowerPoint templates and PPT Slides will get their audience's attention. Professionals tell us our Business Graph 2013 PowerPoint Templates PPT Backgrounds For Slides 1212 will get their audience's attention. People tell us our arrows PowerPoint templates and PPT Slides are Radiant.

Successful Business Men 3d Lifting Graph PowerPoint Slides
We present our successful business men 3d lifting graph PowerPoint Slides.Download our Business PowerPoint Templates because Our PowerPoint Templates and Slides are aesthetically designed to attract attention. We gaurantee that they will grab all the eyeballs you need. Download and present our People PowerPoint Templates because Our PowerPoint Templates and Slides are created by a hardworking bunch of busybees. Always flitting around with solutions gauranteed to please. Present our Finance PowerPoint Templates because It is Aesthetically crafted by artistic young minds. Our PowerPoint Templates and Slides are designed to display your dexterity. Download our Success PowerPoint Templates because You can Connect the dots. Fan expectations as the whole picture emerges. Download and present our Marketing PowerPoint Templates because You are well armed with penetrative ideas. Our PowerPoint Templates and Slides will provide the gunpowder you need.Use these PowerPoint slides for presentations relating to 3d, abstract, accounting, achievement, advantage, bar, bar graph, bar-chart, bar-graph, business, cartoon, chart, company, concept, corporate, financial, graph, growth, help, icon, idiom, lifting, lifting the bar, market, meeting, men, metaphor, partnership, people, performance, presentation, progress, report, strength, team, teamwork. The prominent colors used in the PowerPoint template are Red, Yellow, Green.

Bar Graph For Business Growth Ppt Plan PowerPoint Slides
Drum up support with our bar graph for business growth ppt plan PowerPoint Slides. They will come in droves to stand by you. Drum it up with our Arrows PowerPoint templates. Your thoughts will raise the tempo. Be the drummer with our Process and Flows PowerPoint templates. Let your thoughts create the beat.
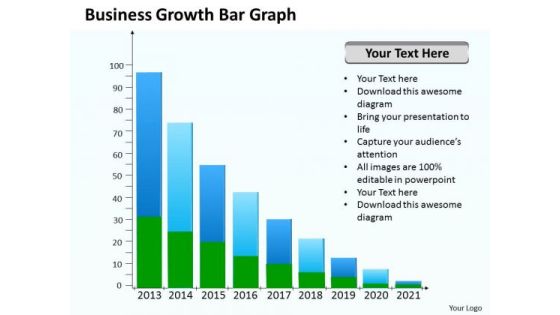
Business PowerPoint Template Growth Bar Graph Ppt Templates
Our Business powerpoint template growth bar graph ppt templates make good beasts of burden. Place all your demands on them. Deliver the right dose with our Arrows PowerPoint Templates. Your ideas will get the correct illumination. Your abilities have been lying dormant. Awaken them with our Marketing PowerPoint Templates.

World Growth Graph PowerPoint Templates Ppt Backgrounds For Slides 0713
Be the drummer with our World Growth Graph PowerPoint Templates PPT Backgrounds For Slides. Let your thoughts create the beat. Drum out your message on our finance PowerPoint Templates. It will be heard by all far and wide. Up the ante with our globe PowerPoint Templates. Drum it up to a crescendo.

Financial Growth Graph PowerPoint Templates Ppt Backgrounds For Slides 0713
Motivate the disheartened with our Financial Growth Graph PowerPoint Templates PPT Backgrounds For Slides. Inspire them with the goodness in you. Discover decisive moments with our Arrows PowerPoint Templates. They help make that crucial difference. Our Money PowerPoint Templates will help make your dreams come true. Your thoughts will weave the magic for you.
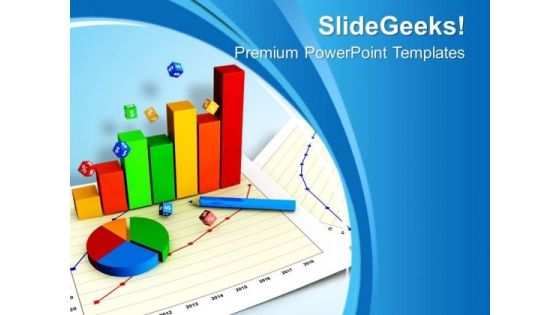
Statistical Graph Illustration PowerPoint Templates Ppt Backgrounds For Slides 0713
Draw away from doubts with our Statistical Graph Illustration PowerPoint Templates PPT Backgrounds For Slides 0713. Connect your thoughts to the positives. Attract a crowd with our Pie charts PowerPoint Templates. They will drop it all and come to hear you. They will come in droves to hear your views. Our Sales PowerPoint Templates will have them dripping excitement.

Growth Bar Graph PowerPoint Templates Ppt Backgrounds For Slides 0813
Rely on our Growth Bar Graph PowerPoint Templates PPT Backgrounds For Slides in any duel. They will drive home your point. There is never a dull moment with our Marketing PowerPoint Templates. They will keep the excitement at high pitch. Be the Duke of the dais with our People PowerPoint Templates. Acquire royalty status with your thoughts.

Business Strategy Plan 3d Man Climbs On Bar Graph Character
Good Camaraderie Is A Key To Teamwork. Our Business Strategy Plan 3d Man Climbs On Bar Graph Character Powerpoint Templates Can Be A Cementing Force. Our People Powerpoint Templates Are An Agent Of Change. Let Your Thoughts Go Down Uncharted Courses.
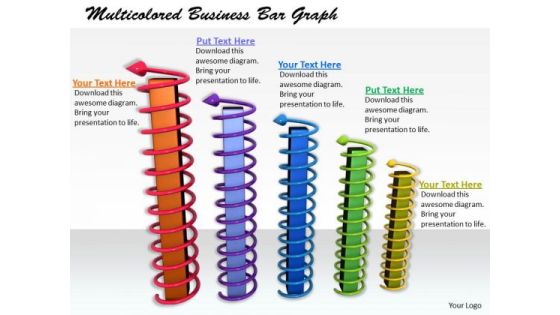
Stock Photo New Business Strategy Multicolored Bar Graph
Draw Out The Best In You With Our Stock Photo New Business Strategy Multicolored Bar Graph Powerpoint Templates. Let Your Inner Brilliance Come To The Surface. Draw Out The Talents Of Your Team. Use Our success Powerpoint Templates To Give Them An Incentive.

Ppt Slide Bar Graph For Growth Of Business Plan
Edit Your Work With Our PPT Slide bar graph for growth of business plan Powerpoint Templates. They Will Help You Give The Final Form. Be Your Own Editor With Our Business Plan Powerpoint Templates. Align Your Thoughts As Per Your Wishes.
Consulting Slides Graph With Abc Steps And Icons Business Presentation
This diagram displays bar graph with ABC steps and business icons. This diagram may be used in your presentations to depict any information and data which requires visual presentation. Use this diagram, in your presentations to express view on growth, progress and success. Create eye-catching presentations using this diagram.

Stock Photo Pie And Bar Graph With 2015 PowerPoint Slide
This Power Point image template slide has been crafted with graphic of pie and bar graph and 2015 year text. This PPT slide contains the concept of business and financial analysis. Use this image slide and build quality presentation for your viewers.
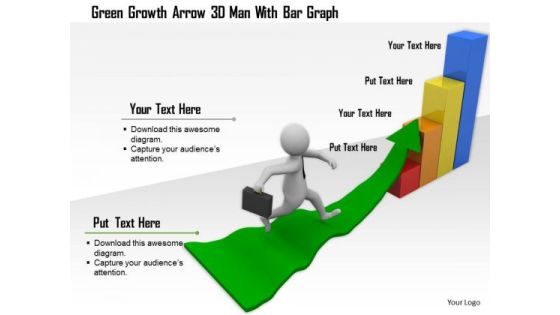
Green Growth Arrow 3d Man With Bar Graph
Our above image slide displays 3d man climbing on growth arrow. This conceptual image contains the concept of growth. We have also used graphic of bar graph which can be used to display business progress. Build an innovative presentation using this professional image slide.
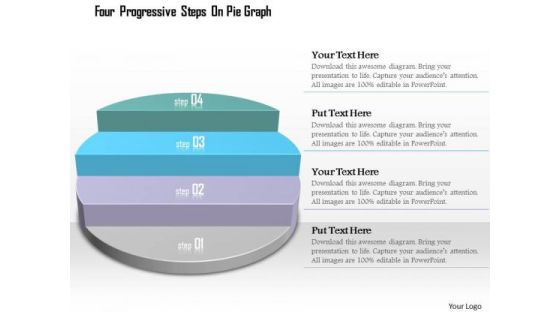
Business Diagram Four Progressive Steps On Pie Graph Presentation Template
This diagram displays progressive steps on pie chart. It contains graphic of pie graph with four steps. Use this diagram, in your presentations to express views on process, steps, stages, progress, targets, goals, success and achievements. Give professional appearance to your presentations using this business slide.

Financial Highlights Graph Ppt PowerPoint Presentation Ideas Good
Presenting this set of slides with name financial highlights graph ppt powerpoint presentation ideas good. This is a six stage process. The stages in this process are finance, marketing, management, investment, analysis. This is a completely editable PowerPoint presentation and is available for immediate download. Download now and impress your audience.
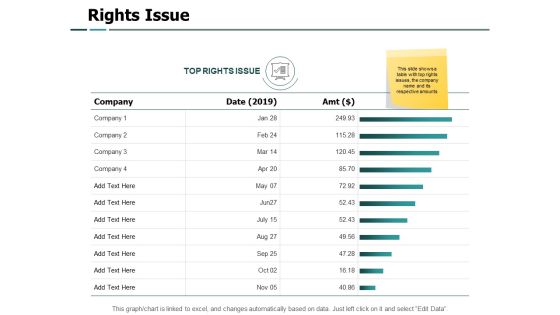
Rights Issue Bar Graph Ppt PowerPoint Presentation Slides Designs Download
Presenting this set of slides with name rights issue bar graph ppt powerpoint presentation slides designs download. The topics discussed in these slides are marketing, business, management, planning, strategy. This is a completely editable PowerPoint presentation and is available for immediate download. Download now and impress your audience.

Clustered Bar Graph Ppt PowerPoint Presentation Ideas Example
Presenting this set of slides with name clustered bar graph ppt powerpoint presentation ideas example. The topics discussed in these slides are marketing, business, management, planning, strategy. This is a completely editable PowerPoint presentation and is available for immediate download. Download now and impress your audience.
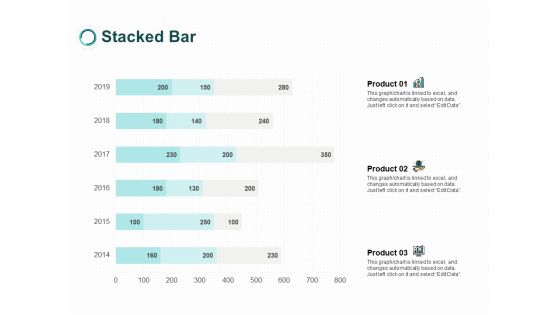
Stacked Bar Graph Chat Ppt PowerPoint Presentation File Shapes
Presenting this set of slides with name stacked bar graph chat ppt powerpoint presentation file shapes. The topics discussed in these slides are marketing, business, management, planning, strategy. This is a completely editable PowerPoint presentation and is available for immediate download. Download now and impress your audience.

Area Chart Graph Ppt PowerPoint Presentation Infographics Slide Download
Presenting this set of slides with name area chart graph ppt powerpoint presentation infographics slide download. The topics discussed in these slides are marketing, business, management, planning, strategy. This is a completely editable PowerPoint presentation and is available for immediate download. Download now and impress your audience.

Clustered Column Bar Graph Ppt PowerPoint Presentation Outline Ideas
Presenting this set of slides with name clustered column bar graph ppt powerpoint presentation outline ideas. The topics discussed in these slides are marketing, business, management, planning, strategy. This is a completely editable PowerPoint presentation and is available for immediate download. Download now and impress your audience.

Competition Market Share Analysis Graph Ppt PowerPoint Presentation Portfolio Inspiration
Presenting this set of slides with name competition market share analysis graph ppt powerpoint presentation portfolio inspiration. The topics discussed in these slides are business, planning, strategy, marketing, management. This is a completely editable PowerPoint presentation and is available for immediate download. Download now and impress your audience.

 Home
Home