Errc Graph

Blue Ocean Leadership ERRC Grid Ppt Summary Brochure PDF
This template cover leadership ERRC analytic tool. This leadership canvas helps organizations formulate blue ocean leadership profile that can unlock the ocean of unrealized talent and energy in firm. If you are looking for a format to display your unique thoughts, then the professionally designed Blue Ocean Leadership ERRC Grid Ppt Summary Brochure PDF is the one for you. You can use it as a Google Slides template or a PowerPoint template. Incorporate impressive visuals, symbols, images, and other charts. Modify or reorganize the text boxes as you desire. Experiment with shade schemes and font pairings. Alter, share or cooperate with other people on your work. Download Blue Ocean Leadership ERRC Grid Ppt Summary Brochure PDF and find out how to give a successful presentation. Present a perfect display to your team and make your presentation unforgettable.

Detailed Analysis Of Red Ocean Vs Blue Ocean Approach Blue Ocean Leadership ERRC Grid Introduction PDF
This template cover leadership ERRC analytic tool. This leadership canvas helps organizations formulate blue ocean leadership profile that can unlock the ocean of unrealized talent and energy in firm. Do you have an important presentation coming up Are you looking for something that will make your presentation stand out from the rest Look no further than Detailed Analysis Of Red Ocean Vs Blue Ocean Approach Blue Ocean Leadership ERRC Grid Introduction PDF. With our professional designs, you can trust that your presentation will pop and make delivering it a smooth process. And with Slidegeeks, you can trust that your presentation will be unique and memorable. So why wait Grab Detailed Analysis Of Red Ocean Vs Blue Ocean Approach Blue Ocean Leadership ERRC Grid Introduction PDF today and make your presentation stand out from the rest.

Blue Ocean Plan Of Tesla Blue Ocean Leadership ERRC Grid Ppt Summary Grid PDF
This template cover leadership ERRC analytic tool. This leadership canvas helps organizations formulate blue ocean leadership profile that can unlock the ocean of unrealized talent and energy in firm. Here you can discover an assortment of the finest PowerPoint and Google Slides templates. With these templates, you can create presentations for a variety of purposes while simultaneously providing your audience with an eye catching visual experience. Download Blue Ocean Plan Of Tesla Blue Ocean Leadership ERRC Grid Ppt Summary Grid PDF to deliver an impeccable presentation. These templates will make your job of preparing presentations much quicker, yet still, maintain a high level of quality. Slidegeeks has experienced researchers who prepare these templates and write high quality content for you. Later on, you can personalize the content by editing the Blue Ocean Plan Of Tesla Blue Ocean Leadership ERRC Grid Ppt Summary Grid PDF.

5 Step Guide For Transitioning To Blue Ocean Strategy Blue Ocean Leadership ERRC Grid Demonstration PDF
This template cover leadership ERRC analytic tool. This leadership canvas helps organizations formulate blue ocean leadership profile that can unlock the ocean of unrealized talent and energy in firm. If you are looking for a format to display your unique thoughts, then the professionally designed 5 Step Guide For Transitioning To Blue Ocean Strategy Blue Ocean Leadership ERRC Grid Demonstration PDF is the one for you. You can use it as a Google Slides template or a PowerPoint template. Incorporate impressive visuals, symbols, images, and other charts. Modify or reorganize the text boxes as you desire. Experiment with shade schemes and font pairings. Alter, share or cooperate with other people on your work. Download 5 Step Guide For Transitioning To Blue Ocean Strategy Blue Ocean Leadership ERRC Grid Demonstration PDF and find out how to give a successful presentation. Present a perfect display to your team and make your presentation unforgettable.

Blue Ocean Tactics Blue Ocean Leadership Errc Grid Ppt Summary Examples PDF
This template cover leadership ERRC analytic tool. This leadership canvas helps organizations formulate blue ocean leadership profile that can unlock the ocean of unrealized talent and energy in firm. Boost your pitch with our creative Blue Ocean Tactics Blue Ocean Leadership Errc Grid Ppt Summary Examples PDF. Deliver an awe-inspiring pitch that will mesmerize everyone. Using these presentation templates you will surely catch everyones attention. You can browse the ppts collection on our website. We have researchers who are experts at creating the right content for the templates. So you dont have to invest time in any additional work. Just grab the template now and use them.

Blue Ocean Leadership Errc Grid Ppt PowerPoint Presentation Diagram Lists PDF
This template cover leadership ERRC analytic tool. This leadership canvas helps organizations formulate blue ocean leadership profile that can unlock the ocean of unrealized talent and energy in firm. Boost your pitch with our creative Blue Ocean Leadership Errc Grid Ppt PowerPoint Presentation Diagram Lists PDF. Deliver an awe inspiring pitch that will mesmerize everyone. Using these presentation templates you will surely catch everyones attention. You can browse the ppts collection on our website. We have researchers who are experts at creating the right content for the templates. So you do not have to invest time in any additional work. Just grab the template now and use them.

Unconstrained Market Growth Using Blue Ocean Strategies Blue Ocean Leadership ERRC Grid Download PDF
This template cover leadership ERRC analytic tool. This leadership canvas helps organizations formulate blue ocean leadership profile that can unlock the ocean of unrealized talent and energy in firm. Make sure to capture your audiences attention in your business displays with our gratis customizable Unconstrained Market Growth Using Blue Ocean Strategies Blue Ocean Leadership ERRC Grid Download PDF. These are great for business strategies, office conferences, capital raising or task suggestions. If you desire to acquire more customers for your tech business and ensure they stay satisfied, create your own sales presentation with these plain slides.
Bar Graph PowerPoint Icon C
3D style of a vector bar graph .
Bar Graph PowerPoint Icon Cc
3D style of a vector bar graph .
Bar Graph PowerPoint Icon S
3D style of a vector bar graph .

Dollar Graph PowerPoint Icon C
3d yellow graph showing rise in dollar benefits or earnings

Dollar Graph PowerPoint Icon S
3d yellow graph showing rise in dollar benefits or earnings
Economic Graph PowerPoint Icon C
economic graph blue background for business and finance
Economic Graph PowerPoint Icon S
economic graph blue background for business and finance

Graph Business PowerPoint Template 0810
An illustration of 3d colorful graph design element

Graph Business PowerPoint Template 0910
Business 3d graph multi colored with spiral arrows around bars.

Graph Business PowerPoint Template 1110
colorful tube graph of business on white background
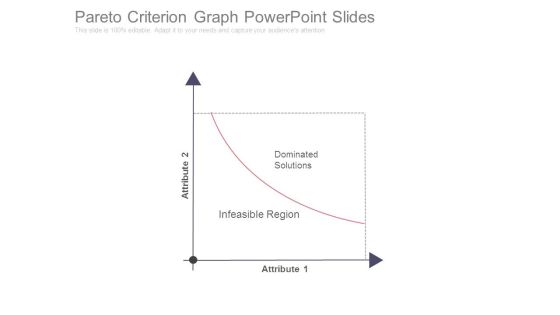
Pareto Criterion Graph Powerpoint Slides
This is a pareto criterion graph powerpoint slides. This is a two stage process. The stages in this process are dominated solutions, infeasible region, business, graph, marketing.

Timeline Graph PowerPoint Presentation Template
Our Timeline Graph PowerPoint Presentation Template Powerpoint Templates Enjoy Drama. They Provide Entertaining Backdrops. Our Business Plan Powerpoint Templates Help To Make A Draft. They Give You A Good Place To Start.
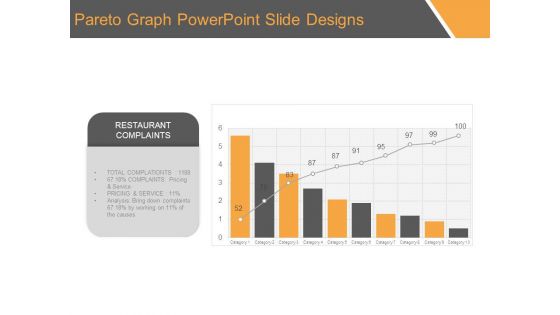
Pareto Graph Powerpoint Slide Designs
This is a pareto graph powerpoint slide designs. This is a ten stage process. The stages in this process are restaurant complaints, total complaints, complaints pricing and service, pricing and service, analysis bring down complaints, category.
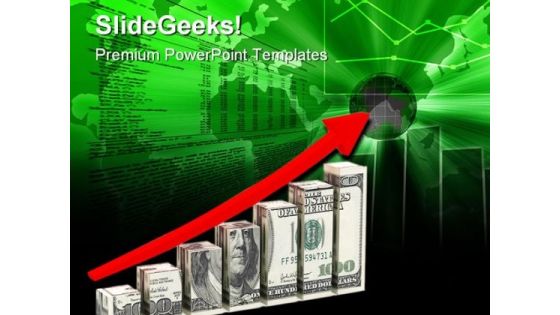
Graph Business PowerPoint Template 1010
Business graph. Red arrow and cubes with texture of the dollar isolated on white background. High quality 3d render.

Graph Business PowerPoint Template 0510
3d illustration of a magnifying glass hovering over a three-dimensional multi-colored bar chart

Graph Success PowerPoint Template 0810
business success concept computer generated illustration for special design

Business Graph PowerPoint Template 0910
Abstract background with blue arrow on blue background
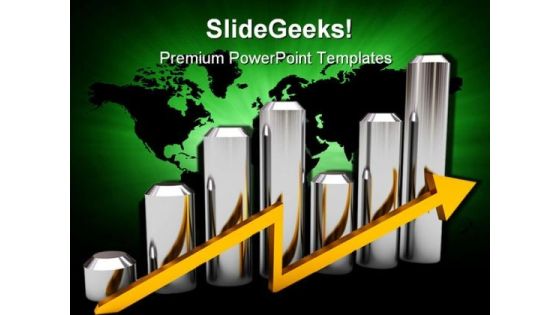
Bar Graph Business PowerPoint Template 0810
3d illustration of growing graph and arrow
Shiny Bar Graph Business PowerPoint Template 0910
Shiny colorful abstract bar graph indicating growth

Bar Graph Ppt PowerPoint Presentation Ideas Sample
This is a bar graph ppt powerpoint presentation ideas sample. This is a four stage process. The stages in this process are business, strategy, marketing, analysis, chart and graph, bar graph.
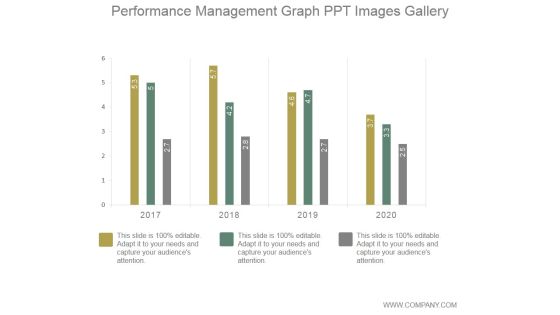
Performance Management Graph Ppt PowerPoint Presentation Template
This is a performance management graph ppt powerpoint presentation template. This is a four stage process. The stages in this process are graph, growth, performance, years, finance.

Bar Graph Ppt PowerPoint Presentation Slides
This is a bar graph ppt powerpoint presentation slides. This is a four stage process. The stages in this process are bar graph, business, management, marketing, success.

Bar Graph Ppt PowerPoint Presentation Example 2015
This is a bar graph ppt powerpoint presentation example 2015. This is a two stage process. The stages in this process are bar graph, finance, marketing, analysis, business.

Bar Graph Ppt PowerPoint Presentation Template
This is a bar graph ppt powerpoint presentation template. This is a six stage process. The stages in this process are graph, business, marketing, finance.

Bar Graph Ppt PowerPoint Presentation Designs Download
This is a bar graph ppt powerpoint presentation designs download. This is a eight stage process. The stages in this process are bar graph, business, strategy, management, marketing.

Bar Graph Ppt PowerPoint Presentation Slides Model
This is a bar graph ppt powerpoint presentation slides model. This is a eight stage process. The stages in this process are business, marketing, bar graph, management, timeline.

Bar Graph Ppt PowerPoint Presentation Pictures Graphics
This is a bar graph ppt powerpoint presentation pictures graphics. This is a four stage process. The stages in this process are business, marketing, bar graph, success, growth.

Bar Graph Ppt Powerpoint Presentation Show Backgrounds
This is a bar graph ppt powerpoint presentation show backgrounds. This is a four stage process. The stages in this process are graph, finance, marketing, management, business.

Bar Graph Ppt PowerPoint Presentation Slides Portfolio
This is a bar graph ppt powerpoint presentation slides portfolio. This is a three stage process. The stages in this process are business, marketing, management, bar graph, product.

Bar Graph Ppt PowerPoint Presentation File Show
This is a bar graph ppt powerpoint presentation file show. This is a four stage process. The stages in this process are business, marketing, graph, growth, finance.

Bar Graph Ppt Powerpoint Presentation File Graphics
This is a bar graph ppt powerpoint presentation file graphics. This is a three stage process. The stages in this process are product, graph, management, business, marketing.

Bar Graph Ppt PowerPoint Presentation Show Inspiration
This is a bar graph ppt powerpoint presentation show inspiration. This is a six stage process. The stages in this process are business, marketing, bar, graph, success.

Bar Graph Ppt Powerpoint Presentation Outline Shapes
This is a bar graph ppt powerpoint presentation outline shapes. This is a four stage process. The stages in this process are product, graph, finance, marketing, business.

Bar Graph Ppt PowerPoint Presentation Outline Aids
This is a bar graph ppt powerpoint presentation outline aids. This is a four stage process. The stages in this process are bar, graph, finance, marketing, strategy.

Bar Graph Ppt PowerPoint Presentation Slides Designs
This is a bar graph ppt powerpoint presentation slides designs. This is a five stage process. The stages in this process are bar graph, business, marketing, plan, financial.

Bar Graph Ppt PowerPoint Presentation Layouts Professional
This is a bar graph ppt powerpoint presentation layouts professional. This is a five stage process. The stages in this process are product, business, marketing, finance, graph.

Bar Graph Ppt PowerPoint Presentation File Tips
This is a bar graph ppt powerpoint presentation file tips. This is a twelve stage process. The stages in this process are business, marketing, finance, graph, strategy.

Bar Graph Ppt PowerPoint Presentation Show Guidelines
This is a bar graph ppt powerpoint presentation show guidelines. This is a four stage process. The stages in this process are product, growth, business, finance, bar graph.

Bar Graph Ppt PowerPoint Presentation File Demonstration
This is a bar graph ppt powerpoint presentation file demonstration. This is a four stage process. The stages in this process are graph, year, success, growth, business.

Bar Graph Ppt PowerPoint Presentation Summary Inspiration
This is a bar graph ppt powerpoint presentation summary inspiration. This is a four stage process. The stages in this process are graph, business, marketing, growth, years.

Bar Graph Ppt PowerPoint Presentation Styles Show
This is a bar graph ppt powerpoint presentation styles show. This is a one stage process. The stages in this process are bar graph, finance, marketing, investment, business.

Bar Graph Ppt PowerPoint Presentation Model Vector
This is a bar graph ppt powerpoint presentation model vector. This is a two stage process. The stages in this process are graph, financial, year, business, marketing.

Bar Graph Ppt PowerPoint Presentation Outline Tips
This is a bar graph ppt powerpoint presentation outline tips. This is a three stage process. The stages in this process are bar graph, growth, success, business, product.

Bar Graph Ppt PowerPoint Presentation Layouts Portrait
This is a bar graph ppt powerpoint presentation layouts portrait. This is a three stage process. The stages in this process are bar graph, finance, marketing, strategy, business.

Bar Graph Ppt PowerPoint Presentation File Display
This is a bar graph ppt powerpoint presentation file display. This is a four stage process. The stages in this process are bar graph, marketing, strategy, finance, analysis.

Bar Graph Ppt PowerPoint Presentation Professional Background
This is a bar graph ppt powerpoint presentation professional background. This is a two stage process. The stages in this process are bar graph, finance, marketing, strategy, business.

Bar Graph Ppt PowerPoint Presentation Ideas Display
This is a bar graph ppt powerpoint presentation ideas display. This is a two stage process. The stages in this process are product, sales in percentage, bar graph.

Bar Graph Ppt PowerPoint Presentation Layouts Backgrounds
This is a bar graph ppt powerpoint presentation layouts backgrounds. This is a one stage process. The stages in this process are business, marketing, finance, bar graph, strategy.

Bar Graph Ppt PowerPoint Presentation Inspiration Brochure
This is a bar graph ppt powerpoint presentation inspiration brochure. This is a three stage process. The stages in this process are bar graph, product, finance, business.

Bar Graph Ppt PowerPoint Presentation Styles Picture
This is a bar graph ppt powerpoint presentation styles picture. This is a four stage process. The stages in this process are business, strategy, marketing, analysis, chart and graph, bar graph.

Bar Graph Ppt PowerPoint Presentation Background Images
This is a bar graph ppt powerpoint presentation background images. This is a twelve stage process. The stages in this process are bar graph, months, finance, growth, success.

Bar Graph Ppt PowerPoint Presentation Professional
This is a bar graph ppt powerpoint presentation professional. This is a five stage process. The stages in this process are business, bar graph, strategy, growth, success.

Competitor Analysis Graph Ppt PowerPoint Presentation Styles
This is a competitor analysis graph ppt powerpoint presentation styles. This is a five stage process. The stages in this process are graph, business, marketing, competitor.

Bar Graph Ppt PowerPoint Presentation Examples
This is a bar graph ppt powerpoint presentation examples. This is a three stage process. The stages in this process are business, strategy, marketing, analysis, finance, bar graph.

Bar Graph Ppt PowerPoint Presentation Microsoft
This is a bar graph ppt powerpoint presentation microsoft. This is a five stage process. The stages in this process are bar graph, finance, marketing, strategy, analysis, business.

Bar Graph Ppt PowerPoint Presentation Information
This is a bar graph ppt powerpoint presentation information. This is a five stage process. The stages in this process are finance, percentage, success, growth, bar graph.

Bar Graph Ppt PowerPoint Presentation Summary Skills
This is a bar graph ppt powerpoint presentation summary skills. This is a three stage process. The stages in this process are bar graph, business, marketing, success, growth.

Bar Graph Ppt PowerPoint Presentation Gallery Show
This is a bar graph ppt powerpoint presentation gallery show. This is a four stage process. The stages in this process are bar graph, business, marketing, management, planning.

Bar Graph Ppt PowerPoint Presentation Icon Inspiration
This is a bar graph ppt powerpoint presentation icon inspiration. This is a five stage process. The stages in this process are bar graph, financials, years, planning, business.

Bar Graph Ppt PowerPoint Presentation Portfolio Vector
This is a bar graph ppt powerpoint presentation portfolio vector. This is a nine stage process. The stages in this process are business, marketing, graph, finance, growth.

Bar Graph Ppt PowerPoint Presentation Gallery Portfolio
This is a bar graph ppt powerpoint presentation gallery portfolio. This is a five stage process. The stages in this process are business, marketing, graph, line chart, growth.

Bar Graph Ppt PowerPoint Presentation Ideas Objects
This is a bar graph ppt powerpoint presentation ideas objects. This is a four stage process. The stages in this process are management, business, marketing, bar graph, success.
Business Data Graph PowerPoint Icon C
Increasing Bar Chart - Business Data Graph With World Map
Business Data Graph PowerPoint Icon Cc
Increasing Bar Chart - Business Data Graph With World Map
Business Data Graph PowerPoint Icon S
Increasing Bar Chart - Business Data Graph With World Map
Cylindrical Bar Graph PowerPoint Icon C
Colorful 3d cylindrical bar graph isolated on white
Cylindrical Bar Graph PowerPoint Icon S
Colorful 3d cylindrical bar graph isolated on white
Golden Graph Chart PowerPoint Icon C
Golden graph chart good better best on white background
Golden Graph Chart PowerPoint Icon S
Golden graph chart good better best on white background
Graph With Money PowerPoint Icon C
3D colored graph with paper currency.High quality render
Graph With Money PowerPoint Icon S
3D colored graph with paper currency.High quality render

Large Graph Business PowerPoint Template 0910
Businesspeople are standing in a large graph conceptual business illustration.

Success Graph Business PowerPoint Template 0910
Success in gold against a green bar graph
Bar Graph Business PowerPoint Template 0910
Colorful 3d cylindrical bar graph isolated on white

Dices On Financial Graph PowerPoint Icon C
Microsoft PowerPoint Template and Background with dices on financial graph

Dices On Financial Graph PowerPoint Icon Cc
Microsoft PowerPoint Template and Background with dices on financial graph

Dices On Financial Graph PowerPoint Icon F
Microsoft PowerPoint Template and Background with dices on financial graph

Dices On Financial Graph PowerPoint Icon R
Microsoft PowerPoint Template and Background with dices on financial graph

Dices On Financial Graph PowerPoint Icon S
Microsoft PowerPoint Template and Background with dices on financial graph

Business Graph With Arrow PowerPoint Icon Cc
Microsoft PowerPoint Template and Background with business graph

Business Graph With Arrow PowerPoint Icon F
Microsoft PowerPoint Template and Background with business graph

Business Graph With Arrow PowerPoint Icon R
Microsoft PowerPoint Template and Background with business graph

Business Graph With Arrow PowerPoint Icon C
Microsoft PowerPoint Template and Background with business graph

Business Graph With Arrow PowerPoint Icon S
Microsoft PowerPoint Template and Background with business graph

Abstract Business Graph PowerPoint Icon Cc
Microsoft PowerPoint Template and Background with business graph with profits rising off the chart. Graph on a white reflective backgroun

Abstract Business Graph PowerPoint Icon F
Microsoft PowerPoint Template and Background with business graph with profits rising off the chart. Graph on a white reflective backgroun

Abstract Business Graph PowerPoint Icon R
Microsoft PowerPoint Template and Background with business graph with profits rising off the chart. Graph on a white reflective backgroun

Abstract Business Graph PowerPoint Icon C
Microsoft PowerPoint Template and Background with business graph with profits rising off the chart. Graph on a white reflective backgroun

Abstract Business Graph PowerPoint Icon S
Microsoft PowerPoint Template and Background with business graph with profits rising off the chart. Graph on a white reflective backgroun

Bar Graph Ppt PowerPoint Presentation Introduction
This is a bar graph ppt powerpoint presentation introduction. This is a eleven stage process. The stages in this process are management, marketing, business, fy, graph, sales in percentage.

Bar Graph Ppt PowerPoint Presentation Portfolio Example
This is a bar graph ppt powerpoint presentation portfolio example. This is a three stage process. The stages in this process are sales in percentage, year, business, product, business, graph.

Bar Graph Ppt PowerPoint Presentation File Slides
This is a bar graph ppt powerpoint presentation file slides. This is a three stage process. The stages in this process are product, sales in percentage, bar graph, growth, success.

Bar Graph Ppt PowerPoint Presentation Summary Format
This is a bar graph ppt powerpoint presentation summary format. This is a three stage process. The stages in this process are bar graph, business, marketing, years, percentage, finance.

Bar Graph Ppt PowerPoint Presentation Infographics Icon
This is a bar graph ppt powerpoint presentation infographics icon. This is a two stage process. The stages in this process are business, marketing, financial year, in percentage, graph.

Bar Graph Ppt PowerPoint Presentation Layouts Influencers
This is a bar graph ppt powerpoint presentation layouts influencers. This is a two stage process. The stages in this process are business, marketing, in bar graph, sales in percentage, finance.

Bar Graph Ppt PowerPoint Presentation Styles Skills
This is a bar graph ppt powerpoint presentation styles skills. This is a two stage process. The stages in this process are bar graph, product, in year, in percentage, business.
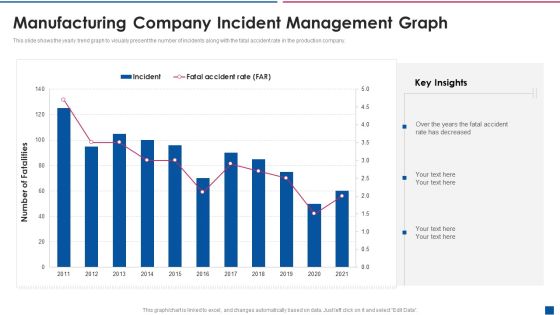
Manufacturing Company Incident Management Graph Information PDF
This slide shows the yearly trend graph to visually present the number of incidents along with the fatal accident rate in the production company. Showcasing this set of slides titled manufacturing company incident management graph information pdf. The topics addressed in these templates are manufacturing company incident management graph. All the content presented in this PPT design is completely editable. Download it and make adjustments in color, background, font etc. as per your unique business setting.
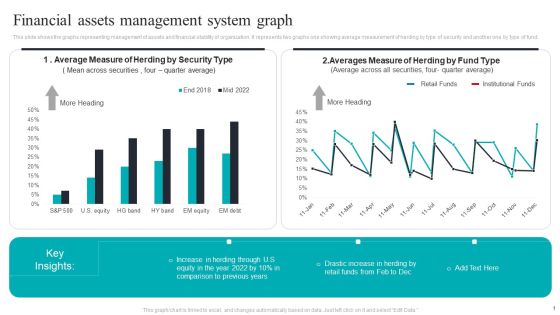
Financial Assets Management System Graph Structure PDF
This slide shows the graphs representing management of assets and financial stability of organization. It represents two graphs one showing average measurement of herding by type of security and another one by type of fund. Pitch your topic with ease and precision using this Financial Assets Management System Graph Structure PDF. This layout presents information on Financial Assets, Management System Graph. It is also available for immediate download and adjustment. So, changes can be made in the color, design, graphics or any other component to create a unique layout.

Bar Graph Ppt PowerPoint Presentation File Vector
This is a bar graph ppt powerpoint presentation file vector. This is a four stage process. The stages in this process are in percentage, bar graph, growth, business, process.

Bar Graph Ppt PowerPoint Presentation Gallery Skills
This is a bar graph ppt powerpoint presentation gallery skills. This is a four stage process. The stages in this process are in percentage, bar graph, business, marketing, product.

Bar Graph Ppt PowerPoint Presentation Model Clipart
This is a bar graph ppt powerpoint presentation model clipart. This is a six stage process. The stages in this process are sales in percentage, product, bar graph, business, marketing.

Bar Graph Ppt PowerPoint Presentation Outline Layout
This is a bar graph ppt powerpoint presentation outline layout. This is a four stage process. The stages in this process are sales in percentage, product, bar graph, business, marketing.

Bar Graph Ppt PowerPoint Presentation Styles Model
This is a bar graph ppt powerpoint presentation styles model. This is a four stage process. The stages in this process are bar graph, finance, marketing, analysis, investment, business.

Bar Graph Ppt PowerPoint Presentation Professional Guide
This is a bar graph ppt powerpoint presentation professional guide. This is a eight stage process. The stages in this process are axis title, bar graph, business, marketing, management.

Bar Graph Ppt PowerPoint Presentation Summary Brochure
This is a bar graph ppt powerpoint presentation summary brochure. This is a four stage process. The stages in this process are business, market strategy, management, bar graph, product
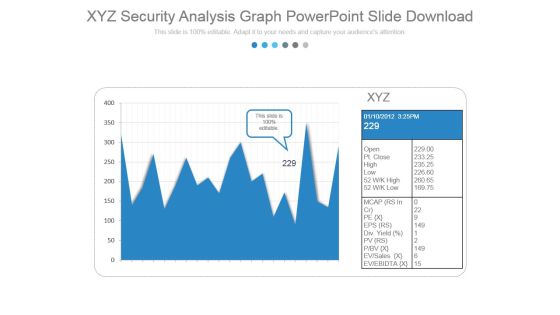
Xyz Security Analysis Graph Powerpoint Slide Download
This is a xyz security analysis graph powerpoint slide download. This is a two stage process. The stages in this process are business, marketing, growth, graph.

Distribution Growth Bar Graph Powerpoint Slide Background
This is a distribution growth bar graph powerpoint slide background. This is a eight stage process. The stages in this process are growth, bar graph, business, marketing, success.

Market Cap Analysis Graph Powerpoint Slide Deck
This is a market cap analysis graph powerpoint slide deck. This is a three stage process. The stages in this process are business, finance, marketing, graph, management.

Bar Graph Ppt PowerPoint Presentation Background Image
This is a bar graph ppt powerpoint presentation background image. This is a four stage process. The stages in this process are bar graph, growth, business, marketing, strategy.

Bar Graph Ppt PowerPoint Presentation Files
This is a bar graph ppt powerpoint presentation files. This is a five stage process. The stages in this process are business, graph, growth, success, management.

Bar Graph Ppt PowerPoint Presentation Example
This is a bar graph ppt powerpoint presentation example. This is a five stage process. The stages in this process are graph, growth, icons, strategy, success.

Bar Graph Ppt PowerPoint Presentation Styles
This is a bar graph ppt powerpoint presentation styles. This is a five stage process. The stages in this process are bar graph, business, marketing, strategy, growth.

Bar Graph Ppt PowerPoint Presentation Show
This is a bar graph ppt powerpoint presentation show. This is a five stage process. The stages in this process are business, marketing, management, bar graph, growth.

Bar Graph Ppt PowerPoint Presentation Designs
This is a bar graph ppt powerpoint presentation designs. This is a five stage process. The stages in this process are bar graph, marketing, analysis, strategy, business.

Bar Graph Ppt PowerPoint Presentation Infographics
This is a bar graph ppt powerpoint presentation infographics. This is a five stage process. The stages in this process are business, management, marketing, bar graph, analysis.

Bar Graph Ppt PowerPoint Presentation Portfolio
This is a bar graph ppt powerpoint presentation portfolio. This is a five stage process. The stages in this process are bar graph, marketing, analysis, finance, business, investment.

Bar Graph Ppt PowerPoint Presentation Good
This is a bar graph ppt powerpoint presentation good. This is a four stage process. The stages in this process are bar graph, growth, business, marketing, management, percentage.

Bar Graph Ppt PowerPoint Presentation Slide
This is a bar graph ppt powerpoint presentation slide. This is a six stage process. The stages in this process are bar graph, analysis, marketing, strategy, business, finance.

Bar Graph Ppt PowerPoint Presentation Guide
This is a bar graph ppt powerpoint presentation guide. This is a five stage process. The stages in this process are bar graph, finance, marketing, analysis, strategy, business.

Bar Graph Ppt PowerPoint Presentation Background Designs
This is a bar graph ppt powerpoint presentation background designs. This is a three stage process. The stages in this process are series, graph, growth, success, business.

Bar Graph Ppt PowerPoint Presentation Ideas
This is a bar graph ppt powerpoint presentation ideas. This is a two stage process. The stages in this process are computer, graph, growth, success, social.

Bar Graph Ppt PowerPoint Presentation Sample
This is a bar graph ppt powerpoint presentation sample. This is a four stage process. The stages in this process are bar graph, finance, marketing, strategy, analysis, business.

Competitor Analysis Graph Ppt PowerPoint Presentation Outline
This is a competitor analysis graph ppt powerpoint presentation outline. This is a five stage process. The stages in this process are bar graph, marketing, strategy, analysis, business.

Bar Graph Ppt PowerPoint Presentation Icon Diagrams
This is a bar graph ppt powerpoint presentation icon diagrams. This is a nine stage process. The stages in this process are product, bar graph, marketing, success.

Bar Graph Ppt PowerPoint Presentation Model Layouts
This is a bar graph ppt powerpoint presentation model layouts. This is a two stage process. The stages in this process are business, product, bar graph, growth, management.

Bar Graph Ppt PowerPoint Presentation Model Templates
This is a bar graph ppt powerpoint presentation model templates. This is a eight stage process. The stages in this process are graph, business, finance, growth, marketing.

Bar Graph Ppt PowerPoint Presentation Infographics Pictures
This is a bar graph ppt powerpoint presentation infographics pictures. This is a six stage process. The stages in this process are bar graph, business, marketing, success, growth.

Bar Graph Ppt PowerPoint Presentation Gallery Good
This is a bar graph ppt powerpoint presentation gallery good. This is a seven stage process. The stages in this process are graph, finance, business, marketing.

Bar Graph Ppt PowerPoint Presentation Layouts Graphics
This is a bar graph ppt powerpoint presentation layouts graphics. This is a four stage process. The stages in this process are bar graph, finance, marketing, strategy, business.

Bar Graph Ppt PowerPoint Presentation Gallery Graphics
This is a bar graph ppt powerpoint presentation gallery graphics. This is a four stage process. The stages in this process are bar graph, management, planning, marketing, business.

Bar Graph Ppt PowerPoint Presentation Layouts Good
This is a bar graph ppt powerpoint presentation layouts good. This is a two stage process. The stages in this process are bar graph, finance, success, strategy, management.

Bar Graph Ppt Powerpoint Presentation Slides Example
This is a bar graph ppt powerpoint presentation slides example. This is a five stage process. The stages in this process are graph, business, marketing, finance.

Bar Graph Ppt PowerPoint Presentation Professional Templates
This is a bar graph ppt powerpoint presentation professional templates. This is a four stage process. The stages in this process are bar graph, finance, marketing, analysis, business.

Bar Graph Ppt PowerPoint Presentation Pictures Background
This is a bar graph ppt powerpoint presentation pictures background. This is a four stage process. The stages in this process are bar graph, marketing, management, planning, strategy.

Bar Graph Ppt PowerPoint Presentation File Skills
This is a bar graph ppt powerpoint presentation file skills. This is a four stage process. The stages in this process are bar graph, growth, success, business, finance.

Bar Graph Ppt PowerPoint Presentation Professional Clipart
This is a bar graph ppt powerpoint presentation professional clipart. This is a six stage process. The stages in this process are bar graph, finance, marketing, strategy, business.

Bar Graph Ppt PowerPoint Presentation Inspiration Microsoft
This is a bar graph ppt powerpoint presentation inspiration microsoft. This is a five stage process. The stages in this process are business, marketing, graph, management, growth.

Bar Graph Ppt PowerPoint Presentation Styles Influencers
This is a bar graph ppt powerpoint presentation styles influencers. This is a four stage process. The stages in this process are bar, graph, business, marketing, finance.

Bar Graph Ppt PowerPoint Presentation Pictures Templates
This is a bar graph ppt powerpoint presentation pictures templates. This is a one stage process. The stages in this process are business, marketing, graph, management, growth.

Bar Graph Ppt PowerPoint Presentation Layouts Layouts
This is a bar graph ppt powerpoint presentation layouts layouts. This is a five stage process. The stages in this process are product, financial years, business, graph, marketing.

Bar Graph Ppt PowerPoint Presentation Ideas Topics
This is a bar graph ppt powerpoint presentation ideas topics. This is a six stage process. The stages in this process are graph, business, growth, success, marketing.

Bar Graph Ppt PowerPoint Presentation Layouts Inspiration
This is a bar graph ppt powerpoint presentation layouts inspiration. This is a four stage process. The stages in this process are bar graph, process, growth, marketing, business.

Bar Graph Ppt PowerPoint Presentation Ideas Show
This is a bar graph ppt powerpoint presentation ideas show. This is a three stage process. The stages in this process are product, percentage, business, year, graph.

Bar Graph Ppt PowerPoint Presentation Infographics Clipart
This is a bar graph ppt powerpoint presentation infographics clipart. This is a three stage process. The stages in this process are product, graph, finance, business, marketing.

Bar Graph Ppt PowerPoint Presentation Summary Infographics
This is a bar graph ppt powerpoint presentation summary infographics. This is a two stage process. The stages in this process are Bar Graph, Finance, Marketing, Management, Investment.

Bar Graph Ppt PowerPoint Presentation File Rules
Presenting this set of slides with name bar graph ppt powerpoint presentation file rules. The topics discussed in these slide is bar graph. This is a completely editable PowerPoint presentation and is available for immediate download. Download now and impress your audience.

Bar Graph Ppt PowerPoint Presentation Styles Smartart
Presenting this set of slides with name bar graph ppt powerpoint presentation styles smartart. The topics discussed in these slide is bar graph. This is a completely editable PowerPoint presentation and is available for immediate download. Download now and impress your audience.

Bar Graph Ppt PowerPoint Presentation Portfolio Slide
Presenting this set of slides with name bar graph ppt powerpoint presentation portfolio slide. The topics discussed in these slide is bar graph. This is a completely editable PowerPoint presentation and is available for immediate download. Download now and impress your audience.

Bar Graph Ppt PowerPoint Presentation File Microsoft
Presenting this set of slides with name bar graph ppt powerpoint presentation file microsoft. The topics discussed in these slide is bar graph. This is a completely editable PowerPoint presentation and is available for immediate download. Download now and impress your audience.

Enterprise Management Company Sales Graph Themes PDF
Deliver and pitch your topic in the best possible manner with this enterprise management company sales graph themes pdf. Use them to share invaluable insights on company sales graph and impress your audience. This template can be altered and modified as per your expectations. So, grab it now.
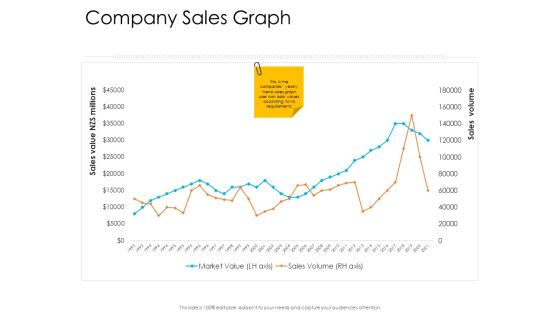
Enterprise Governance Company Sales Graph Topics PDF
Deliver an awe-inspiring pitch with this creative enterprise governance company sales graph topics pdf bundle. Topics like company sales graph can be discussed with this completely editable template. It is available for immediate download depending on the needs and requirements of the user.

Corporate Governance Company Sales Graph Background PDF
Deliver an awe inspiring pitch with this creative corporate governance company sales graph background pdf bundle. Topics like company sales graph can be discussed with this completely editable template. It is available for immediate download depending on the needs and requirements of the user.

Company Profit Accomplishment Rate Graph Template PDF
Showcasing this set of slides titled company profit accomplishment rate graph template pdf. The topics addressed in these templates are company profit accomplishment rate graph. All the content presented in this PPT design is completely editable. Download it and make adjustments in color, background, font etc. as per your unique business setting.

Marketing Kpi Accomplishment Rate Graph Mockup PDF
Showcasing this set of slides titled marketing kpi accomplishment rate graph mockup pdf. The topics addressed in these templates are marketing kpi accomplishment rate graph. All the content presented in this PPT design is completely editable. Download it and make adjustments in color, background, font etc. as per your unique business setting.
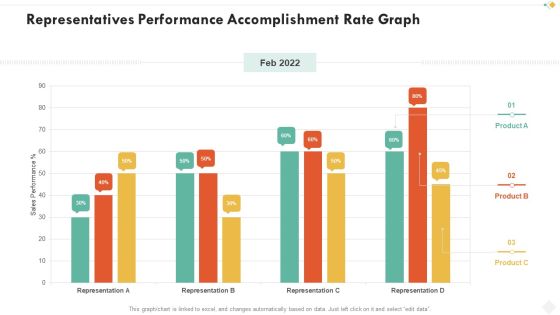
Representatives Performance Accomplishment Rate Graph Template PDF
Showcasing this set of slides titled representatives performance accomplishment rate graph template pdf. The topics addressed in these templates are representatives performance accomplishment rate graph. All the content presented in this PPT design is completely editable. Download it and make adjustments in color, background, font etc. as per your unique business setting.

Staff Task Accomplishment Rate Graph Inspiration PDF
Showcasing this set of slides titled staff task accomplishment rate graph inspiration pdf. The topics addressed in these templates are staff task accomplishment rate graph. All the content presented in this PPT design is completely editable. Download it and make adjustments in color, background, font etc. as per your unique business setting.
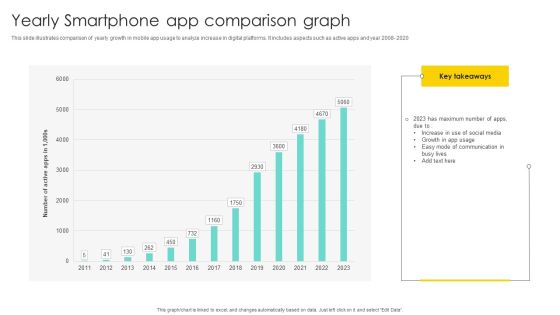
Yearly Smartphone App Comparison Graph Diagrams PDF
Showcasing this set of slides titled Yearly Smartphone App Comparison Graph Diagrams PDF. The topics addressed in these templates are Comparison Graph, Comparison Of Yearly, Growth In App . All the content presented in this PPT design is completely editable. Download it and make adjustments in color, background, font etc. as per your unique business setting.

Graph 2011 Business PowerPoint Template 0810
2010 2011 Business graph with world background. Vector File also available

Graph Business PowerPoint Backgrounds And Templates 1210
Microsoft PowerPoint Template and Background with 3D business graph with up and fall
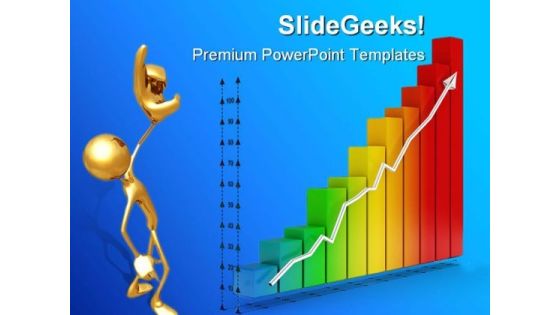
Financial Graph PowerPoint Backgrounds And Templates 0111
Microsoft PowerPoint Template and Background with 3d rendered rainbow colored financial graph showing strong growth
Bar Graph Business PowerPoint Presentation Slides C
Microsoft PowerPoint Slides and Backgrounds with style of a vector bar graph
Bar Graph Business PowerPoint Presentation Slides Cc
Microsoft PowerPoint Slides and Backgrounds with style of a vector bar graph
Bar Graph Business PowerPoint Presentation Slides F
Microsoft PowerPoint Slides and Backgrounds with style of a vector bar graph
Bar Graph Business PowerPoint Presentation Slides R
Microsoft PowerPoint Slides and Backgrounds with style of a vector bar graph
Bar Graph Business PowerPoint Presentation Slides S
Microsoft PowerPoint Slides and Backgrounds with style of a vector bar graph

Success Graph Business PowerPoint Presentation Slides C
Microsoft Powerpoint Slides and Backgrounds with three dimensional shape of bussiness graph on a white background
Success Graph Business PowerPoint Presentation Slides Cc
Microsoft Powerpoint Slides and Backgrounds with three dimensional shape of bussiness graph on a white background
Success Graph Business PowerPoint Presentation Slides F
Microsoft Powerpoint Slides and Backgrounds with three dimensional shape of bussiness graph on a white background

Success Graph Business PowerPoint Presentation Slides R
Microsoft Powerpoint Slides and Backgrounds with three dimensional shape of bussiness graph on a white background
Success Graph Business PowerPoint Presentation Slides S
Microsoft Powerpoint Slides and Backgrounds with three dimensional shape of bussiness graph on a white background
Coin Graph Finance PowerPoint Presentation Slides C
Microsoft PowerPoint Slides and Backgrounds with bar graph made of gold coins
Coin Graph Finance PowerPoint Presentation Slides Cc
Microsoft PowerPoint Slides and Backgrounds with bar graph made of gold coins
Coin Graph Finance PowerPoint Presentation Slides F
Microsoft PowerPoint Slides and Backgrounds with bar graph made of gold coins

 Home
Home