Errc Graph

Puzzle Pieces In Bar Graph Shape For Result Growth Presentation Template
Define the growth factor for any business and sales activity with this unique PPT. this PPT has been crafted with graphic of bar graph made with puzzle pieces. Use this PPT for your business and sales presentations.
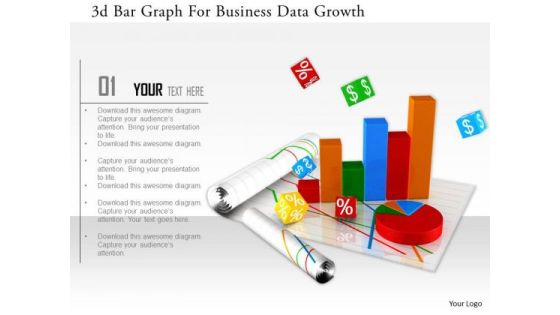
Stock Photo 3d Bar Graph For Business Data Growth Image Graphics For PowerPoint Slide
This image slide has graphics of financial charts and reports. This contains bar graph and pie chart to present business reports. Build an innovative presentations using this professional image slide.
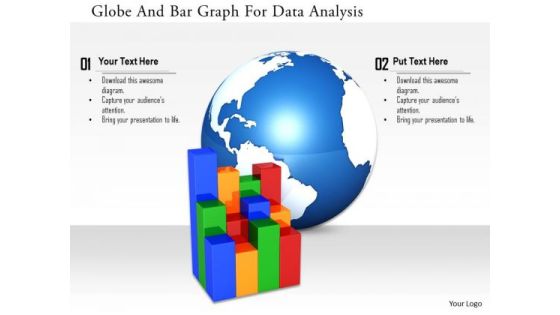
Stock Photo Globe And Bar Graph For Data Analysis Image Graphics For PowerPoint Slide
This image slide has been designed with business graph with globe in background. This image slide represents topics like global business, economic growth. This image will enhance the quality of your presentations.

Business Diagram Bar Graph For Result Display On Mobile Presentation Template
This Power Point template has been designed with graphic of bar graph on mobile phone. This business diagram can be used to make business reports. Download this Power Point slide to build quality presentation for your viewers.

Business Diagram Key Shaped Pie Graph For Result Display Presentation Template
Key shaped pie graph has been used to design this business diagram. This slide has key graphic with abcd options. Use this amazing slide to present a business plan. Download this slide to impress your viewers.

Stock Photo Business Growth Bar Graph And Arrow And Tablet PowerPoint Slide
This PowerPoint template has been designed with graphic of bar graph and arrow with tablet. This unique image slide depicts the concept of business growth and success. Use this image slide to build exclusive presentation for your viewers.

Stock Photo Bar Graph And Us Map With Financial Growth PowerPoint Slide
This image displays American map with business graph in background. This image slide contains the concept of American economy, business growth and reports. Use this amazing slide to make professional presentations.
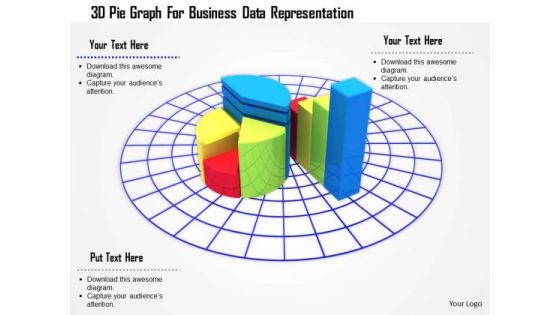
Stock Photo 3d Pie Graph For Business Data Representation PowerPoint Slide
3D business graph has been used to design this PowerPoint template. This Image slide is suitable to make business reports and charts. This slide can be used for business and marketing presentations.
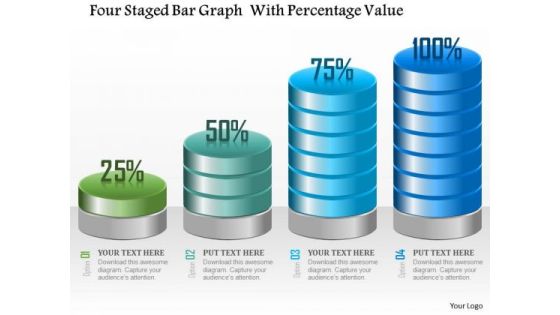
Business Diagram Four Staged Bar Graph With Percentage Value Presentation Template
Four staged bar graph with percentage value has been used to craft this power point template. This PPT contains the concept of making financial timeline and result analysis. This PPT can be used for business and finance related presentations.

Stock Photo Bar Graph With Cubes For Financial Data PowerPoint Slide
Graphic of bar graph and cubes are used to decorate this image template. This PPT contains the concept of financial data analysis. Use this PPT for finance and business related presentations.

Business Diagram Globe Bar Graph And Bulb For International Business Diagram Presentation Template
Graphic of globe and bar graph with bulb has been used to craft this power point template diagram. This PPT diagram contains the concept of international business growth analysis. Use this PPT for global business and sales related presentations.

Business Diagram Linear Bar Graph With Apps Made With Pencils Presentation Template
This power point template has been crafted with graphic of linear bar graph and apps made with pencils. This PPT diagram can be used for business growth analysis and result analysis. Use this PPT for business and marketing related presentations.

Bar Graph With Arrow For Career Planning Ppt PowerPoint Presentation Gallery
This is a bar graph with arrow for career planning ppt powerpoint presentation gallery. This is a six stage process. The stages in this process are business, finance, marketing, strategy, planning, success, arrow.

Bar Graph For Sales Revenue Over The Years Ppt PowerPoint Presentation Professional
This is a bar graph for sales revenue over the years ppt powerpoint presentation professional. This is a nine stage process. The stages in this process are business, marketing, growth, bar, years.

Competitor Analysis Competitor Revenue And Profit Graph Ppt PowerPoint Presentation Inspiration
This is a competitor analysis competitor revenue and profit graph ppt powerpoint presentation inspiration. This is a five stage process. The stages in this process are business, marketing, management, profit, revenue.

Magnifier With Tools And Bar Graph Ppt PowerPoint Presentation Portfolio Templates
This is a magnifier with tools and bar graph ppt powerpoint presentation portfolio templates. This is a four stage process. The stages in this process are magnifier, search, marketing, strategy, business.

Six Gears Business Growth Factors Ppt PowerPoint Presentation Diagram Graph Charts
This is a six gears business growth factors ppt powerpoint presentation diagram graph charts. This is a seven stage process. The stages in this process are growth opportunity, growth drivers, market drivers.
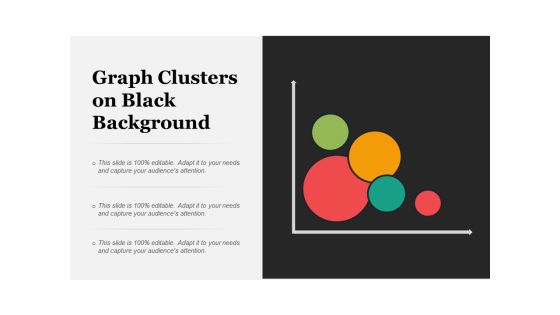
Graph Clusters On Black Background Ppt PowerPoint Presentation Ideas Slide Portrait
This is a graph clusters on black background ppt powerpoint presentation ideas slide portrait. This is a four stage process. The stages in this process are radial cluster diagram, radial circular diagram, radial circle diagram.

Improve Sales Performance And Productivity Ppt PowerPoint Presentation Diagram Graph Charts
This is a improve sales performance and productivity ppt powerpoint presentation diagram graph charts. This is a four stage process. The stages in this process are marketing effort, branding initiative, marketing initiatives.

Smart Grid Architectural Framework Information And Communication Technology Ppt Powerpoint Presentation Diagram Graph Charts
This is a smart grid architectural framework information and communication technology ppt powerpoint presentation diagram graph charts. This is a three stage process. The stages in this process are functional architecture, functional planning, functional designing.

Stock Market Trend Dollar Sign On Bar Graph Ppt Powerpoint Presentation Show Deck
This is a stock market trend dollar sign on bar graph ppt powerpoint presentation show deck. This is a four stage process. The stages in this process are stock market, financial market, bull market.

Stock Trading Graph With Bull Showing Upward Trend Ppt Powerpoint Presentation Pictures Outfit
This is a stock trading graph with bull showing upward trend ppt powerpoint presentation pictures outfit. This is a four stage process. The stages in this process are stock market, financial market, bull market.

Learning And Experience Graph With Three Milestones Ppt PowerPoint Presentation Model Introduction
This is a learning and experience graph with three milestones ppt powerpoint presentation model introduction. This is a three stage process. The stages in this process are experience curve, learning curve.

Learning Graph Showing Time And Competence Ppt PowerPoint Presentation Slides Format Ideas
This is a learning graph showing time and competence ppt powerpoint presentation slides format ideas. This is a four stage process. The stages in this process are experience curve, learning curve.
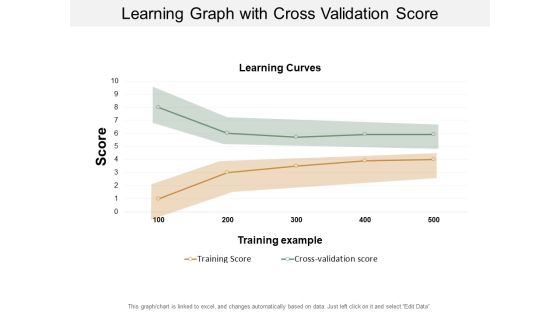
Learning Graph With Cross Validation Score Ppt PowerPoint Presentation Visual Aids Inspiration
This is a learning graph with cross validation score ppt powerpoint presentation visual aids inspiration. This is a two stage process. The stages in this process are experience curve, learning curve.
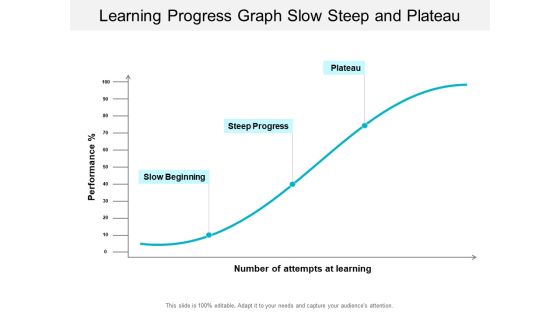
Learning Progress Graph Slow Steep And Plateau Ppt PowerPoint Presentation Professional Gallery
This is a learning progress graph slow steep and plateau ppt powerpoint presentation professional gallery. This is a three stage process. The stages in this process are experience curve, learning curve.
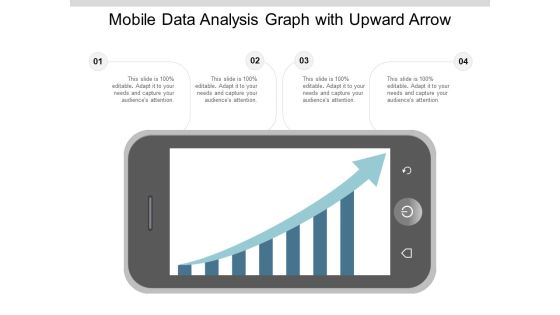
Mobile Data Analysis Graph With Upward Arrow Ppt PowerPoint Presentation Summary Styles
This is a mobile data analysis graph with upward arrow ppt powerpoint presentation summary styles. This is a four stage process. The stages in this process are mobile analytics, mobile tracking, mobile web analytics.
Financial Reporting Icon Computer Screen With Graph And Dollar Ppt Powerpoint Presentation Layouts Model
This is a financial reporting icon computer screen with graph and dollar ppt powerpoint presentation layouts model. This is a four stage process. The stages in this process are financial statements icon, accounting ratio icon, balance sheet icon.
Growth Arrow On Bar Graph Icon Ppt Powerpoint Presentation Infographic Template Clipart
This is a growth arrow on bar graph icon ppt powerpoint presentation infographic template clipart. This is a three stage process. The stages in this process are financial statements icon, accounting ratio icon, balance sheet icon.
Bar Graph Icon Showing Operating Rhythm Ppt Powerpoint Presentation Ideas Templates
This is a bar graph icon showing operating rhythm ppt powerpoint presentation ideas templates. This is a three stage process. The stages in this process are six sigma, operating rhythm, business rhythm.
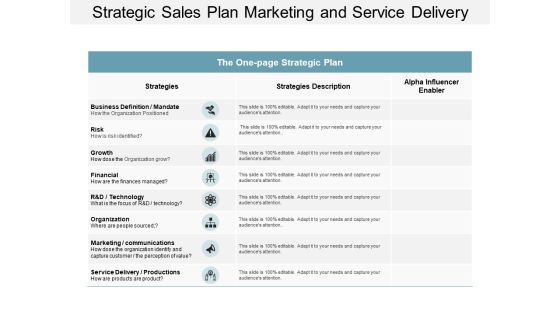
Strategic Sales Plan Marketing And Service Delivery Ppt Powerpoint Presentation Diagram Graph Charts
This is a strategic sales plan marketing and service delivery ppt powerpoint presentation diagram graph charts. This is a three stage process. The stages in this process are one page strategy, one page plan, one page approach.

Business Outcomes Vector Icons Showing Pie And Bar Graph Ppt Powerpoint Presentation File Graphic Images
This is a business outcomes vector icons showing pie and bar graph ppt powerpoint presentation file graphic images. This is a three stage process. The stages in this process are business outcomes, business results, business output.

Bar Graph To Present Financial Information Ppt PowerPoint Presentation Show Tips
This is a bar graph to present financial information ppt powerpoint presentation show tips. This is a four stage process. The stages in this process are stock market, financial markets, bull market.

Business Man With Graph Made Of Puzzle Pieces Ppt PowerPoint Presentation Professional Clipart
This is a business man with graph made of puzzle pieces ppt powerpoint presentation professional clipart. This is a four stage process. The stages in this process are puzzle, business, growth, success, pieces.
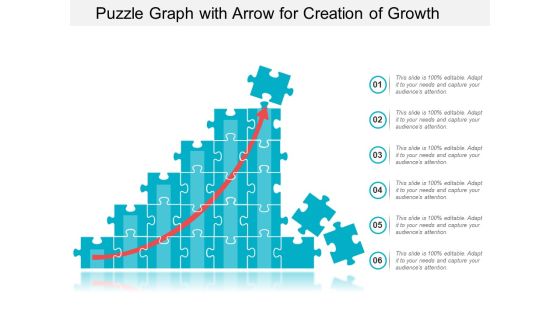
Puzzle Graph With Arrow For Creation Of Growth Ppt PowerPoint Presentation Infographics Professional
This is a puzzle graph with arrow for creation of growth ppt powerpoint presentation infographics professional. This is a six stage process. The stages in this process are puzzle, business, growth, success, pieces.
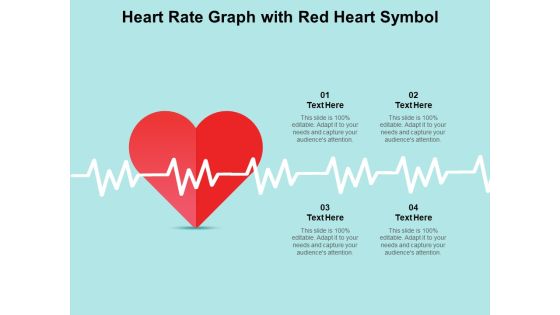
Heart Rate Graph With Red Heart Symbol Ppt PowerPoint Presentation Styles Themes
This is a heart rate graph with red heart symbol ppt powerpoint presentation styles themes. This is a four stage process. The stages in this process are health, heartbeat, pulse.

Financial Analysis Vector Bar Graph With Magnifying Glass Ppt PowerPoint Presentation Gallery Design Ideas
This is a financial analysis vector bar graph with magnifying glass ppt powerpoint presentation gallery design ideas. This is a four stage process. The stages in this process are marketing analytics, marketing performance, marketing discovery.

Worldwide Market Trends Mobile With Bar Graph And Globe Ppt PowerPoint Presentation Styles Demonstration
This is a worldwide market trends mobile with bar graph and globe ppt powerpoint presentation styles demonstration. This is a four stage process. The stages in this process are marketing analytics, marketing performance, marketing discovery.

Bar Graph With Downward Arrow For Business Failure Ppt PowerPoint Presentation Inspiration Graphics
This is a bar graph with downward arrow for business failure ppt powerpoint presentation inspiration graphics. This is a four stage process. The stages in this process are business failure, unsuccessful business, business non success.

Downward Arrow On Bar Graph For Financial Loss Ppt PowerPoint Presentation Infographics Sample
This is a downward arrow on bar graph for financial loss ppt powerpoint presentation infographics sample. This is a three stage process. The stages in this process are business failure, unsuccessful business, business non success.
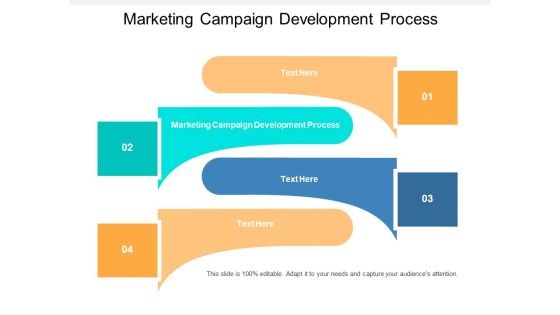
Marketing Campaign Development Process Ppt PowerPoint Presentation Diagram Graph Charts Cpb
This is a marketing campaign development process ppt powerpoint presentation diagram graph charts cpb. This is a four stage process. The stages in this process are marketing campaign development process.
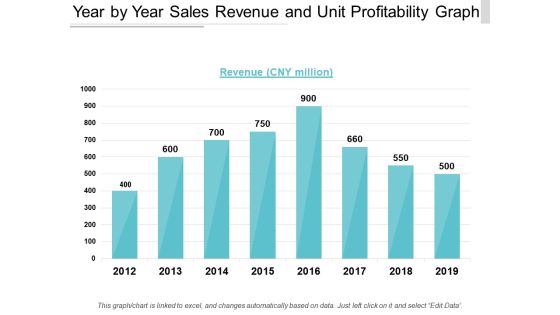
Year By Year Sales Revenue And Unit Profitability Graph Ppt PowerPoint Presentation Show Professional
This is a year by year sales revenue and unit profitability graph ppt powerpoint presentation show professional. This is a eight stage process. The stages in this process are business unit profitability, profitable organization, corporate unit profitability.
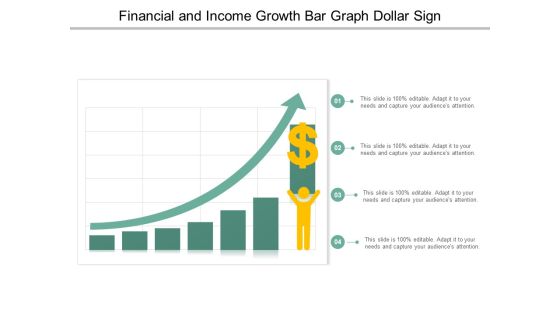
Financial And Income Growth Bar Graph Dollar Sign Ppt PowerPoint Presentation Professional Shapes
This is a financial and income growth bar graph dollar sign ppt powerpoint presentation professional shapes. This is a four stage process. The stages in this process are growth, increase sales, increase revenue.
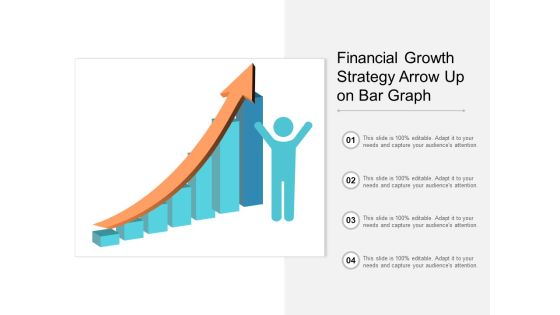
Financial Growth Strategy Arrow Up On Bar Graph Ppt PowerPoint Presentation Gallery Example
This is a financial growth strategy arrow up on bar graph ppt powerpoint presentation gallery example. This is a four stage process. The stages in this process are growth, increase sales, increase revenue.
Profit Growth Bar Graph With Rising Arrow And Dollar Sign Ppt PowerPoint Presentation Icon Designs
This is a profit growth bar graph with rising arrow and dollar sign ppt powerpoint presentation icon designs. This is a five stage process. The stages in this process are growth, increase sales, increase revenue.
Return On Capital Employed Graph Vector Icon Ppt PowerPoint Presentation Portfolio Design Inspiration
This is a return on capital employed graph vector icon ppt powerpoint presentation portfolio design inspiration. This is a three stage process. The stages in this process are accounting ratio, roce, return on capital employed.
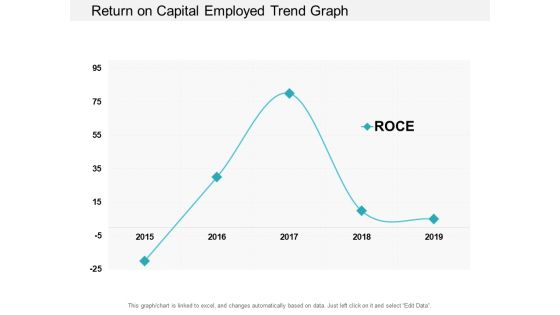
Return On Capital Employed Trend Graph Ppt PowerPoint Presentation Professional Example Topics
This is a return on capital employed trend graph ppt powerpoint presentation professional example topics. This is a one stage process. The stages in this process are accounting ratio, roce, return on capital employed.

Timeline For Application Development Design Implement And Release Ppt PowerPoint Presentation Diagram Graph Charts
This is a timeline for application development design implement and release ppt powerpoint presentation diagram graph charts. This is a five stage process. The stages in this process are overlapping timeline, overlapping roadmap, overlapping linear roadmap.

Growth Arrow On Bar Graph Vector Ppt Powerpoint Presentation Layouts Master Slide
This is a growth arrow on bar graph vector ppt powerpoint presentation layouts master slide. This is a three stage process. The stages in this process are increasing arrows, improving arrows, growing arrows.
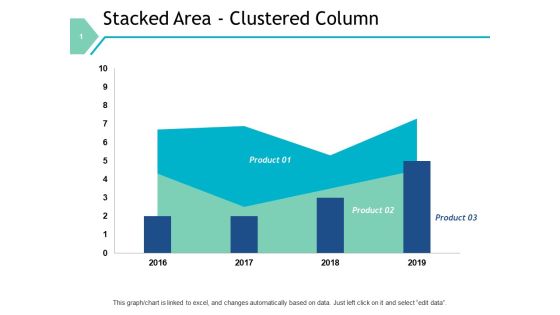
Stacked Area Clustered Column Graph Ppt PowerPoint Presentation File Designs Download
This is a stacked area clustered column graph ppt powerpoint presentation file designs download. This is a three stage process. The stages in this process are finance, marketing, management, investment, analysis.

Bar Graph With Upward Arrow For Financial Success Ppt PowerPoint Presentation Infographic Template Model
This is a bar graph with upward arrow for financial success ppt powerpoint presentation infographic template model. This is a five stage process. The stages in this process are rising arrow, growing arrow, increasing arrow.

Economic Growth Arrow With Bar Graph On Human Hand Ppt PowerPoint Presentation Infographics Ideas
This is a economic growth arrow with bar graph on human hand ppt powerpoint presentation infographics ideas. This is a four stage process. The stages in this process are rising arrow, growing arrow, increasing arrow.
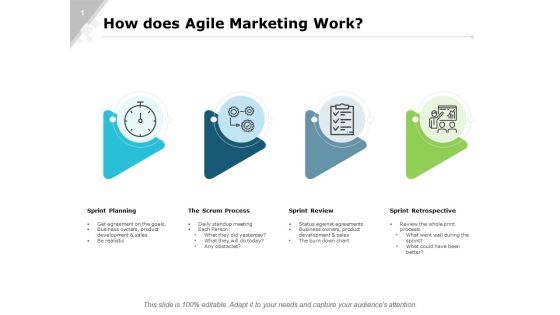
How Does Agile Marketing Work Ppt PowerPoint Presentation Diagram Graph Charts
This is a how does agile marketing work ppt powerpoint presentation diagram graph charts. This is a four stage process. The stages in this process are business, planning, strategy, marketing, management.

Two Men Moving On Growth Graph Vector Ppt PowerPoint Presentation Professional Microsoft
This is a two men moving on growth graph vector ppt powerpoint presentation professional microsoft. This is a three stage process. The stages in this process are benefits icon, advantage icon, plus point icon.
Financial Gain Growth Graph Vector Icon Ppt Powerpoint Presentation File Show
This is a financial gain growth graph vector icon ppt powerpoint presentation file show. The topics discussed in this diagram are increase icon, improved icon, growth icon. This is a completely editable PowerPoint presentation, and is available for immediate download.

Business Progress Upward Arrow Graph Vector Icon Ppt Powerpoint Presentation Model Images
This is a business progress upward arrow graph vector icon ppt powerpoint presentation model images. This is a four stage process. The stages in this process are market growth, market opportunity, market profitability.
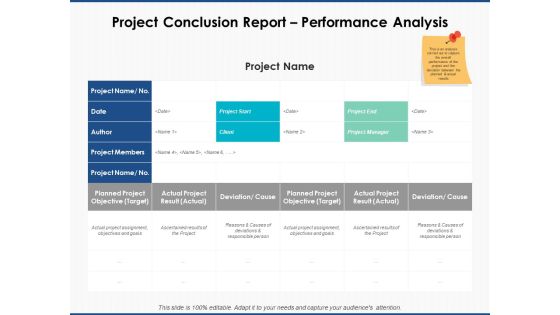
Project Conclusion Report Performance Analysis Ppt PowerPoint Presentation Diagram Graph Charts
This is a project conclusion report performance analysis ppt powerpoint presentation diagram graph charts. The topics discussed in this diagram are marketing, business, management, planning, strategy This is a completely editable PowerPoint presentation, and is available for immediate download.
Statistical Assessment Business Graph With Magnifying Glass Vector Icon Ppt Powerpoint Presentation Styles
This is a statistical assessment business graph with magnifying glass vector icon ppt powerpoint presentation styles. This is a one stage process. The stages in this process are feedback loop icon, evaluation icon, assessment icon.

Fixed Income Securities Top Performing Bonds Ppt PowerPoint Presentation Diagram Graph Charts
This is a fixed income securities top performing bonds ppt powerpoint presentation diagram graph charts. This is a two stage process. The stages in this process are compare, marketing, business, management, planning.
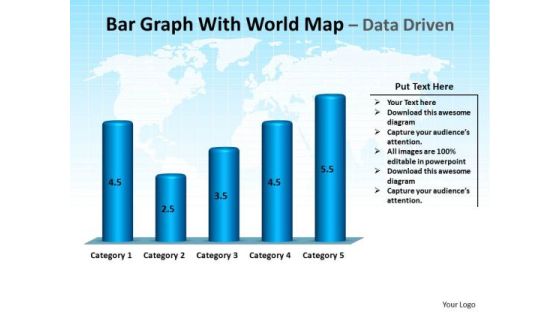
Business Success PowerPoint Templates Business Bar Graph With World Map Ppt Slides
Business Success PowerPoint Templates Business bar graph with world map PPT Slides-This PowerPoint Template is a illustration of bar garph with world map on blue background -Business Success PowerPoint Templates Business bar graph with world map PPT Slides-This ppt can be used for concepts relating to-animated, business, finance, sales, marketing, accounting, future, education, america, Antarctica, arrow, Asia, charts, statistics, budget, investment, abstract, australia, background, bar, blue, calculation, company and continents.
 Home
Home