Errc Graph

Monthly Sales Growth Graph Of A Business Ppt PowerPoint Presentation Ideas File Formats PDF
Presenting this set of slides with name monthly sales growth graph of a business ppt powerpoint presentation ideas file formats pdf. The topics discussed in these slides are sales growth, cumulative sales year. This is a completely editable PowerPoint presentation and is available for immediate download. Download now and impress your audience.

High And Low Levels Adoption Graph Ppt PowerPoint Presentation Gallery Inspiration PDF
Showcasing this set of slides titled high and low levels adoption graph ppt powerpoint presentation gallery inspiration pdf. The topics addressed in these templates are high, mean, low. All the content presented in this PPT design is completely editable. Download it and make ajustments in color, background, font etc. as per your unique business setting.

Sprint Burndown Complexity Graph With Effort Time And Tasks Ppt PowerPoint Presentation File Visuals PDF
Showcasing this set of slides titled sprint burndown complexity graph with effort time and tasks ppt powerpoint presentation file visuals pdf. The topics addressed in these templates are effort, tasks, time. All the content presented in this PPT design is completely editable. Download it and make ajustments in color, background, font etc. as per your unique business setting.

Downturn Graph Indicating Business Share Value Decline Ppt PowerPoint Presentation Professional Elements PDF
Showcasing this set of slides titled downturn graph indicating business share value decline ppt powerpoint presentation professional elements pdf. The topics addressed in these templates are per share value, 2016 to 2020. All the content presented in this PPT design is completely editable. Download it and make adjustments in color, background, font etc. as per your unique business setting.

Downturn Graph Indicating Reduction In Carbon Omission Ppt PowerPoint Presentation Outline Inspiration PDF
Showcasing this set of slides titled downturn graph indicating reduction in carbon omission ppt powerpoint presentation outline inspiration pdf. The topics addressed in these templates are carbon omission, year, 2015 to 2020. All the content presented in this PPT design is completely editable. Download it and make adjustments in color, background, font etc. as per your unique business setting.

Downturn Graph Showing Company Comparison Ppt PowerPoint Presentation Professional Graphics Design PDF
Pitch your topic with ease and precision using this downturn graph showing company comparison ppt powerpoint presentation professional graphics design pdf. This layout presents information on company growth rate, red bull, pepsi. It is also available for immediate download and adjustment. So, changes can be made in the color, design, graphics or any other component to create a unique layout.
Startup Pitch To Raise Capital From Crowdfunding Shareholding Structure Graph Pre And Post Funding Icons PDF
Deliver an awe-inspiring pitch with this creative startup pitch to raise capital from crowdfunding shareholding structure graph pre and post funding icons pdf bundle. Topics like founder, employee, seed investors, crowdfunding investors can be discussed with this completely editable template. It is available for immediate download depending on the needs and requirements of the user.
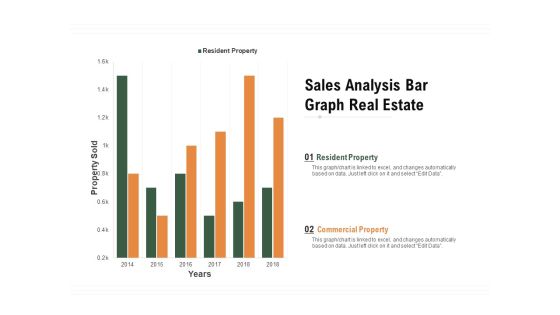
Sales Analysis Bar Graph Real Estate Ppt PowerPoint Presentation Infographic Template Show PDF
Pitch your topic with ease and precision using this sales analysis bar graph real estate ppt powerpoint presentation infographic template show pdf. This layout presents information on resident property, commercial property, property sold, 2014 to 2018. It is also available for immediate download and adjustment. So, changes can be made in the color, design, graphics or any other component to create a unique layout.

Activity Based Costing Bag Graph With Vendor Fees Ppt PowerPoint Presentation Portfolio Inspiration PDF
Pitch your topic with ease and precision using this activity based costing bag graph with vendor fees ppt powerpoint presentation portfolio inspiration pdf. This layout presents information on vendor fees, patient recruitment. It is also available for immediate download and adjustment. So, changes can be made in the color, design, graphics or any other component to create a unique layout.
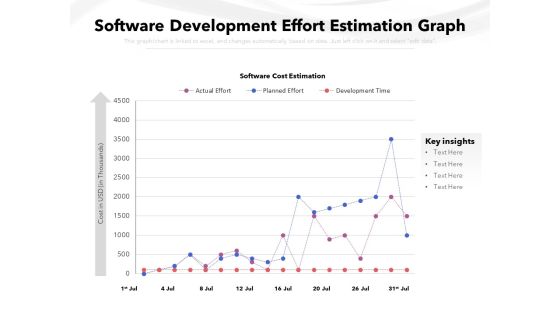
Software Development Effort Estimation Graph Ppt PowerPoint Presentation Styles Show PDF
Showcasing this set of slides titled software development effort estimation graph ppt powerpoint presentation styles show pdf. The topics addressed in these templates are key insights, cost, software cost estimation, actual effort, planned effort, development time. All the content presented in this PPT design is completely editable. Download it and make adjustments in color, background, font etc. as per your unique business setting.

Sprint Burndown Graph With Completed Tasks Ppt PowerPoint Presentation Show Styles PDF
Pitch your topic with ease and precision using this sprint burndown graph with completed tasks ppt powerpoint presentation show styles pdf. This layout presents information on completed tasks, ideal burndown, remaining effort2, remaining task. It is also available for immediate download and adjustment. So, changes can be made in the color, design, graphics or any other component to create a unique layout.

Convertible Market Notes Financial Graph Historical And Projection Ppt Summary Show PDF
Deliver an awe inspiring pitch with this creative convertible market notes financial graph historical and projection ppt summary show pdf bundle. Topics like revenue, operating income, net income, financial can be discussed with this completely editable template. It is available for immediate download depending on the needs and requirements of the user.
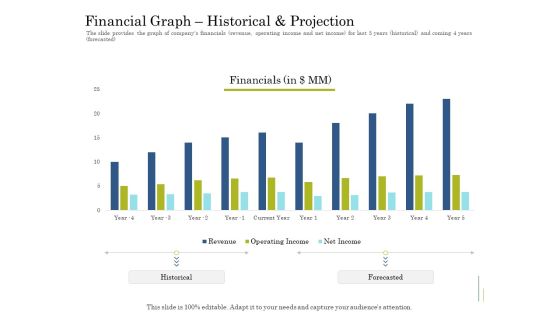
Supplementary Debt Financing Pitch Deck Financial Graph Historical And Projection Brochure PDF
Deliver an awe inspiring pitch with this creative supplementary debt financing pitch deck financial graph historical and projection brochure pdf bundle. Topics like financial, revenue, operating income, net income can be discussed with this completely editable template. It is available for immediate download depending on the needs and requirements of the user.

Business Assessment Outline Company Sales Graph Ppt Inspiration Graphics Example PDF
Deliver an awe-inspiring pitch with this creative business assessment outline company sales graph ppt inspiration graphics example pdf bundle. Topics like market value, sales volume can be discussed with this completely editable template. It is available for immediate download depending on the needs and requirements of the user.
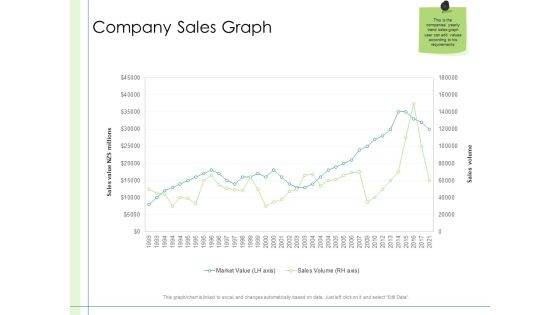
In Depth Business Assessment Company Sales Graph Ppt PowerPoint Presentation Layouts Design Templates PDF
Deliver an awe-inspiring pitch with this creative in depth business assessment company sales graph ppt powerpoint presentation layouts design templates pdf bundle. Topics like market value, sales volume can be discussed with this completely editable template. It is available for immediate download depending on the needs and requirements of the user.
Profit Margin Growth Graph With Percentage Ratio Ppt PowerPoint Presentation Professional Icon PDF
Showcasing this set of slides titled profit margin growth graph with percentage ratio ppt powerpoint presentation professional icon pdf. The topics addressed in these templates are profit margin per sale, target per sales rep, 2017 to 2027. All the content presented in this PPT design is completely editable. Download it and make adjustments in color, background, font etc. as per your unique business setting.

Convertible Debt Financing Pitch Deck Financial Graph Historical And Projection Clipart PDF
Deliver an awe-inspiring pitch with this creative convertible debt financing pitch deck financial graph historical and projection clipart pdf bundle. Topics like revenue, operating income, net income can be discussed with this completely editable template. It is available for immediate download depending on the needs and requirements of the user.
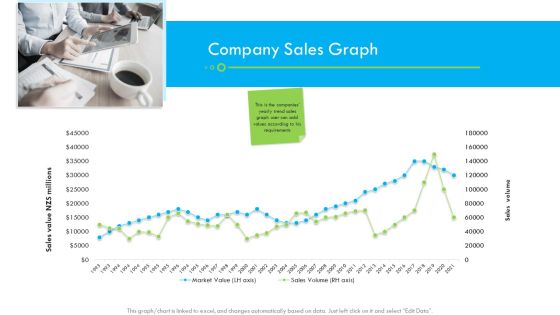
Enterprise Tactical Planning Company Sales Graph Ppt Portfolio Design Inspiration PDF
Deliver an awe-inspiring pitch with this creative enterprise tactical planning company sales graph ppt portfolio design inspiration pdf bundle. Topics like market volume, sales volume can be discussed with this completely editable template. It is available for immediate download depending on the needs and requirements of the user.
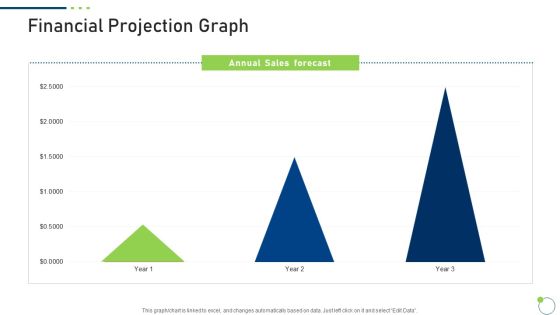
Investor Pitch Deck New Venture Capital Raising Financial Projection Graph Slide2 Portrait PDF
Deliver and pitch your topic in the best possible manner with this investor pitch deck new venture capital raising financial projection graph slide2 portrait pdf. Use them to share invaluable insights on annual sales, gross margin, net profit and impress your audience. This template can be altered and modified as per your expectations. So, grab it now.

Bar Graph Depicting Hike In Price Rate In Recent Years Ppt PowerPoint Presentation Gallery Guidelines PDF
Showcasing this set of slides titled bar graph depicting hike in price rate in recent years ppt powerpoint presentation gallery guidelines pdf. The topics addressed in these templates are prices, target, inflation rate. All the content presented in this PPT design is completely editable. Download it and make adjustments in color, background, font etc. as per your unique business setting.
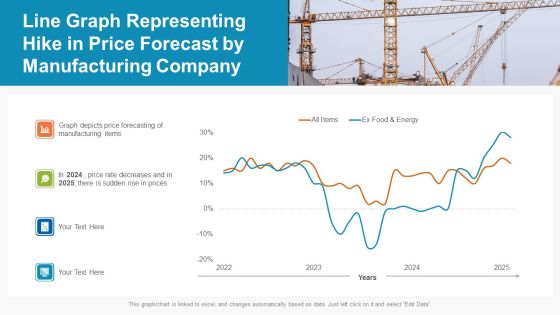
Line Graph Representing Hike In Price Forecast By Manufacturing Company Ppt PowerPoint Presentation File Skills PDF
Pitch your topic with ease and precision using this line graph representing hike in price forecast by manufacturing company ppt powerpoint presentation file skills pdf. This layout presents information on manufacturing, price, price rate decreases. It is also available for immediate download and adjustment. So, changes can be made in the color, design, graphics or any other component to create a unique layout.
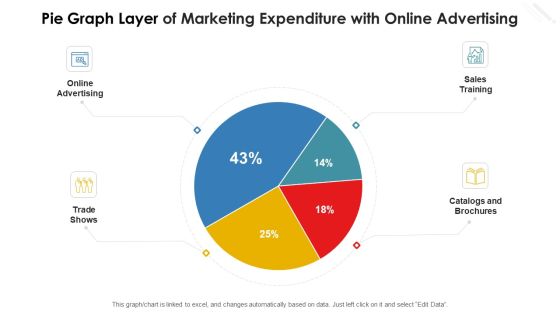
Pie Graph Layer Of Marketing Expenditure With Online Advertising Graphics PDF
Showcasing this set of slides titled pie graph layer of marketing expenditure with online advertising graphics pdf. The topics addressed in these templates are online advertising, trade shows, catalogs and brochures, sales training. All the content presented in this PPT design is completely editable. Download it and make adjustments in color, background, font etc. as per your unique business setting.

Pie Graph Layer Showing Sector Wise Sales In 2022 Microsoft PDF
Pitch your topic with ease and precision using this pie graph layer showing sector wise sales in 2022 microsoft pdf. This layout presents information on consumer goods, information technology, automobile, financial services, engineering. It is also available for immediate download and adjustment. So, changes can be made in the color, design, graphics or any other component to create a unique layout.
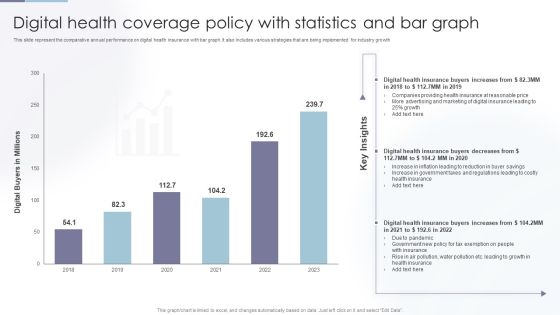
Digital Health Coverage Policy With Statistics And Bar Graph Clipart PDF
Showcasing this set of slides titled Digital Health Coverage Policy With Statistics And Bar Graph Clipart PDF. The topics addressed in these templates are Digital Health, Health Insurance, Insurance At Reasonable. All the content presented in this PPT design is completely editable. Download it and make adjustments in color, background, font etc. as per your unique business setting.

Accounting Ratio Assessment Graph With Cash Flow Ppt PowerPoint Presentation Model Samples PDF
Pitch your topic with ease and precision using this Accounting Ratio Assessment Graph With Cash Flow Ppt PowerPoint Presentation Model Samples PDF. This layout presents information on Cash Flow, Improvement, Total. It is also available for immediate download and adjustment. So, changes can be made in the color, design, graphics or any other component to create a unique layout.

Business Diagram 3d Colorful Pie Graph With Magnifier Data Search PowerPoint Slide
This business slide displays 3d colorful pie graph with magnifier. This diagram is a data visualization tool that gives you a simple way to present statistical information. This slide helps your audience examine and interpret the data you present.

Horizontal Bar Graph With Profit Percentage Of Company Ppt PowerPoint Presentation Shapes
This is a horizontal bar graph with profit percentage of company ppt powerpoint presentation shapes. This is a five stage process. The stages in this process are business, strategy, marketing, analysis, slide bar, target.
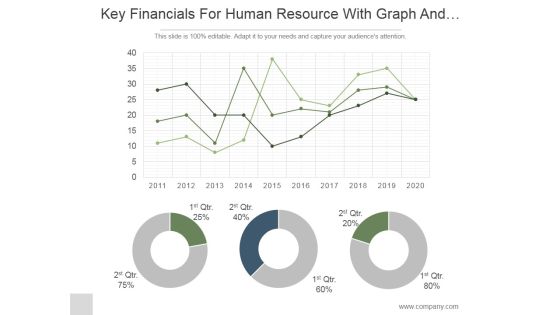
Key Financials For Human Resource With Graph And Pie Chart Ppt PowerPoint Presentation Ideas
This is a key financials for human resource with graph and pie chart ppt powerpoint presentation ideas. This is a three stage process. The stages in this process are business, strategy, marketing, analysis, donut, growth.
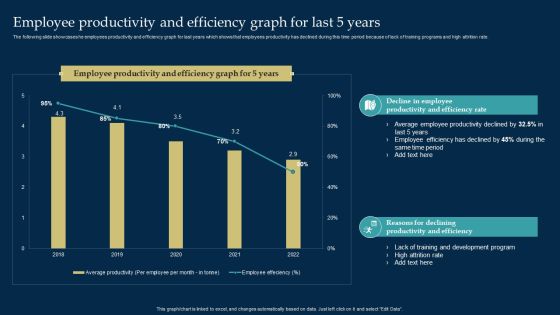
Employee Training And Development Strategy Employee Productivity And Efficiency Graph For Last 5 Years Graphics PDF
The following slide showcases he employees productivity and efficiency graph for last years which shows that employees productivity has declined during this time period because of lack of training programs and high attrition rate. Do you know about Slidesgeeks Employee Training And Development Strategy Employee Productivity And Efficiency Graph For Last 5 Years Graphics PDF These are perfect for delivering any kind od presentation. Using it, create PowerPoint presentations that communicate your ideas and engage audiences. Save time and effort by using our pre designed presentation templates that are perfect for a wide range of topic. Our vast selection of designs covers a range of styles, from creative to business, and are all highly customizable and easy to edit. Download as a PowerPoint template or use them as Google Slides themes.

Graph Highlighting Cost Involved In Multiple Clinical Trial Phases New Clinical Drug Trial Process Mockup PDF
This slide visually represents the money spent in each phase of the clinical trial procedure to check the safety and efficacy of the newly developed drug. Find highly impressive Graph Highlighting Cost Involved In Multiple Clinical Trial Phases New Clinical Drug Trial Process Mockup PDF on Slidegeeks to deliver a meaningful presentation. You can save an ample amount of time using these presentation templates. No need to worry to prepare everything from scratch because Slidegeeks experts have already done a huge research and work for you. You need to download Graph Highlighting Cost Involved In Multiple Clinical Trial Phases New Clinical Drug Trial Process Mockup PDF for your upcoming presentation. All the presentation templates are 100 percent editable and you can change the color and personalize the content accordingly. Download now.
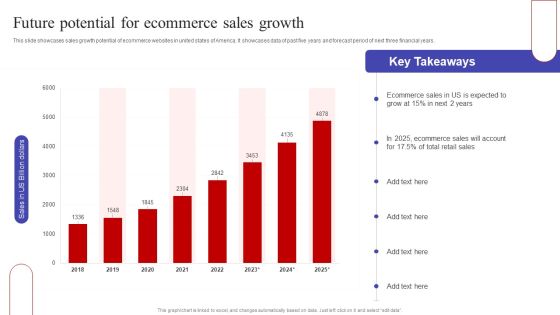
Future Potential For Ecommerce Sales Growth Ppt PowerPoint Presentation Diagram Graph Charts PDF
This slide showcases sales growth potential of ecommerce websites in united states of America. It showcases data of past five years and forecast period of next three financial years. Here you can discover an assortment of the finest PowerPoint and Google Slides templates. With these templates, you can create presentations for a variety of purposes while simultaneously providing your audience with an eye catching visual experience. Download Future Potential For Ecommerce Sales Growth Ppt PowerPoint Presentation Diagram Graph Charts PDF to deliver an impeccable presentation. These templates will make your job of preparing presentations much quicker, yet still, maintain a high level of quality. Slidegeeks has experienced researchers who prepare these templates and write high quality content for you. Later on, you can personalize the content by editing the Future Potential For Ecommerce Sales Growth Ppt PowerPoint Presentation Diagram Graph Charts PDF.

Problems Related To Current Product Positioning Ppt PowerPoint Presentation Diagram Graph Charts PDF
This slide highlights the problems related to current product positioning which showcases in graphical format depicting downgrading product sales and changing consumer trends. Do you have an important presentation coming up Are you looking for something that will make your presentation stand out from the rest Look no further than Problems Related To Current Product Positioning Ppt PowerPoint Presentation Diagram Graph Charts PDF. With our professional designs, you can trust that your presentation will pop and make delivering it a smooth process. And with Slidegeeks, you can trust that your presentation will be unique and memorable. So why wait Grab Problems Related To Current Product Positioning Ppt PowerPoint Presentation Diagram Graph Charts PDF today and make your presentation stand out from the rest
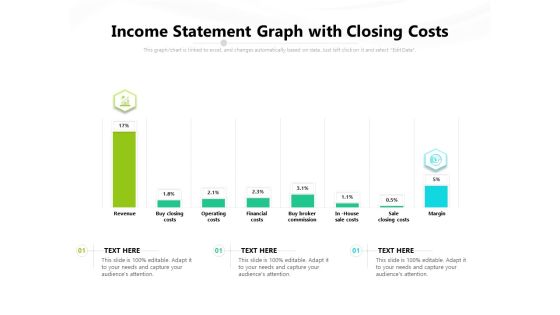
Income Statement Graph With Closing Costs Ppt PowerPoint Presentation Gallery Example Topics PDF
Presenting this set of slides with name income statement graph with closing costs ppt powerpoint presentation gallery example topics pdf. The topics discussed in these slides are revenue, buy closing costs, operating costs, financial costs, buy broker commission, in house sale costs, sale closing costs, margin. This is a completely editable PowerPoint presentation and is available for immediate download. Download now and impress your audience.

Business Case Summary With Graph And Key Findings Ppt PowerPoint Presentation Outline Design Templates PDF
Pitch your topic with ease and precision using this business case summary with graph and key findings ppt powerpoint presentation outline design templates pdf. This layout presents information on business case highlights, market value, time, approach followed, key findings, year 2020, cost. It is also available for immediate download and adjustment. So, changes can be made in the color, design, graphics or any other component to create a unique layout.
Downturn Graph Showing Decrease In Income Over The Years Ppt PowerPoint Presentation Icon File Formats PDF
Showcasing this set of slides titled downturn graph showing decrease in income over the years ppt powerpoint presentation icon file formats pdf. The topics addressed in these templates are middle class share of total income, middle class share of income, union membership rate, 2013 to 2020. All the content presented in this PPT design is completely editable. Download it and make adjustments in color, background, font etc. as per your unique business setting.

Pie Graph Representing United States Coast Guard Soldiers Ethic Diversity Ppt PowerPoint Presentation Layouts Backgrounds PDF
Pitch your topic with ease and precision using this pie graph representing united states coast guard soldiers ethic diversity ppt powerpoint presentation layouts backgrounds pdf. This layout presents information on hispanic, latino, asian, african american, ethnicity unknown, non resident alien. It is also available for immediate download and adjustment. So, changes can be made in the color, design, graphics or any other component to create a unique layout.

Product Graph Showing Cost Of Bad Quality At Various Levels Ppt PowerPoint Styles Model PDF
Pitch your topic with ease and precision using this product graph showing cost of bad quality at various levels ppt powerpoint styles model pdf. This layout presents information on minimum quality cost, minimum quality for minimum cost, total quality cost. It is also available for immediate download and adjustment. So, changes can be made in the color, design, graphics or any other component to create a unique layout.
Expenses And Income Comparison Graph With Budget Summary Ppt PowerPoint Presentation Icon Inspiration PDF
This slide illustrates budget summary of expenditure of a company. it includes income and expenditure comparative data and expenditure chart etc.Pitch your topic with ease and precision using this Expenses And Income Comparison Graph With Budget Summary Ppt PowerPoint Presentation Icon Inspiration PDF. This layout presents information on Budget Summary, Expenditure Comparative, Actual Income. It is also available for immediate download and adjustment. So, changes can be made in the color, design, graphics or any other component to create a unique layout.

Departmental Workforce Increase Graph Of Organization Ppt Infographics Graphics Pictures PDF
This slide shows increase in headcount of various departments of corporate. It includes departments such as marketing, finance, production, sales, etc. Showcasing this set of slides titled Departmental Workforce Increase Graph Of Organization Ppt Infographics Graphics Pictures PDF. The topics addressed in these templates are Customer Support Department, Number Customers, Highest Headcount. All the content presented in this PPT design is completely editable. Download it and make adjustments in color, background, font etc. as per your unique business setting.
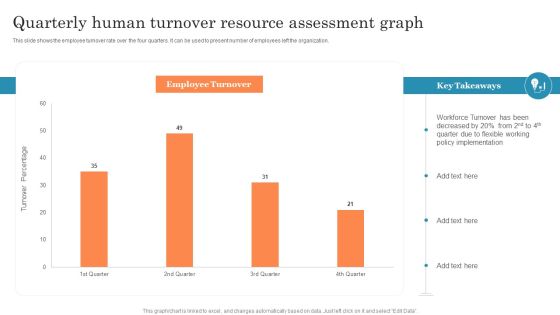
Quarterly Human Turnover Resource Assessment Graph Ppt PowerPoint Presentation Styles Infographic Template PDF
This slide shows the employee turnover rate over the four quarters. It can be used to present number of employees left the organization. Showcasing this set of slides titled Quarterly Human Turnover Resource Assessment Graph Ppt PowerPoint Presentation Styles Infographic Template PDF. The topics addressed in these templates are Flexible Working, Policy Implementation, Turnover Been. All the content presented in this PPT design is completely editable. Download it and make adjustments in color, background, font etc. as per your unique business setting.

Cost Reduction Bar Graph For Organization Optimization Ppt Inspiration Vector PDF
This slide represent cost saving with benefits in an organization and areas where more efficiencies are utilized. It includes travel, administrative and hiring. Pitch your topic with ease and precision using this Cost Reduction Bar Graph For Organization Optimization Ppt Inspiration Vector PDF. This layout presents information on Total Cost Benefits, Promoting Employees, Providing Perks. It is also available for immediate download and adjustment. So, changes can be made in the color, design, graphics or any other component to create a unique layout.

Circular Bar Graph Business Success PowerPoint Templates And PowerPoint Themes 1012
Circular Bar Graph Business Success PowerPoint Templates And PowerPoint Themes 1012-The above template displays a diagram of blue circular progress bars. This image represent the concept of business growth and success. This template imitates economy, finance, global, goal, growth, ideas, information, management, profit and statistics. This image has been conceived to enable you to emphatically communicate your ideas in your Business and Marketing PPT presentations. Use this template for financial analysis, business reviews and statistics. Go ahead and add charm to your presentations with our high quality template.-Circular Bar Graph Business Success PowerPoint Templates And PowerPoint Themes 1012-This PowerPoint template can be used for presentations relating to-Circular success graph, marketing, business, finance, success, circle charts

Stakeholder Assessment Analysis Graph With Power And Interest Ppt Gallery Skills PDF
This slide shows the stakeholder assessment analysis graph with interest and power positions such as procurement, technicians, supervisors, operators, etc. This is a stakeholder assessment analysis graph with power and interest ppt gallery skills pdf. template with various stages. Focus and dispense information on four stages using this creative set, that comes with editable features. It contains large content boxes to add your information on topics like technicians, procurement, supervisors, operators. You can also showcase facts, figures, and other relevant content using this PPT layout. Grab it now.

Substitute Financing Pitch Deck Shareholding Structure Graph Pre And Post Funding Rules PDF
The slide provides the graph of shareholding structure at the time of founding, before crowdfunding and after crowdfunding. Deliver an awe inspiring pitch with this creative substitute financing pitch deck shareholding structure graph pre and post funding rules pdf bundle. Topics like shareholding structure graph pre and post funding can be discussed with this completely editable template. It is available for immediate download depending on the needs and requirements of the user.
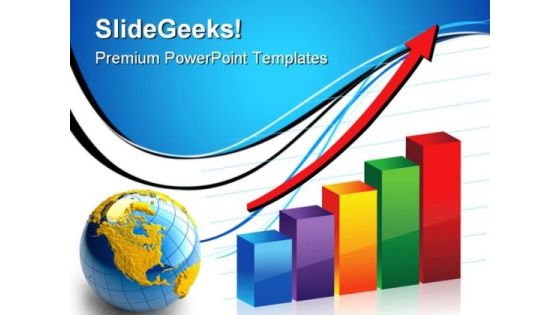
Bar Graph With Globe Business PowerPoint Templates And PowerPoint Backgrounds 1211
Microsoft PowerPoint Template and Background with a rising chart graph predicts global worldwide growth with a globe as symbol of success

Lego Bar Graph Building Business PowerPoint Templates And PowerPoint Themes 0512
Lego Bar Graph Building Business PowerPoint Templates And PowerPoint Themes PPT designs-Microsoft Powerpoint Templates and Background with achievement chart from building blocks

Lego Bar Graph Steps Business PowerPoint Templates And PowerPoint Themes 0512
Lego Bar Graph Steps Business PowerPoint Templates And PowerPoint Themes PPT designs-Microsoft Powerpoint Templates and Background with achievement chart from building blocks

Pie Graph 15 85 Percent Business PowerPoint Templates And PowerPoint Themes 0512
Pie Graph 15 85 Percent Business PowerPoint Templates And PowerPoint Themes PPT designs-Microsoft Powerpoint Templates and Background with fifteen and eighty five percent proportion pie chart
Bar Graph And Pie Chart Global PowerPoint Templates And PowerPoint Themes 0612
Bar Graph And Pie Chart Global PowerPoint Templates And PowerPoint Themes Business PPT Templates-Bar and pie chart, background, business, success, finance, marketing
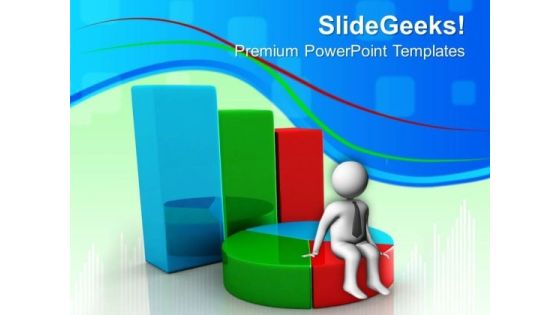
Bar Graph And Pie Chart Marketing PowerPoint Templates And PowerPoint Themes 0612
Bar Graph And Pie Chart Marketing PowerPoint Templates And PowerPoint Themes 0612-Microsoft Powerpoint Templates and Background with bar and pie chart

Bar Graph And Pie Chat Business PowerPoint Templates And PowerPoint Themes 0712
Bar Graph And Pie Chat Business PowerPoint Templates And PowerPoint Themes 0712-Microsoft Powerpoint Templates and Background with bar and pie chart
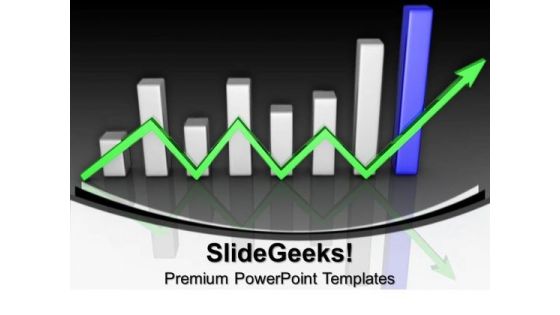
Graph With Success Arrow Finance PowerPoint Templates And PowerPoint Themes 0912
Graph With Success Arrow Finance PowerPoint Templates And PowerPoint Themes 0912-Microsoft Powerpoint Templates and Background with business success with arrow-Business success with arrow, finance, marketing, business, arrows, success
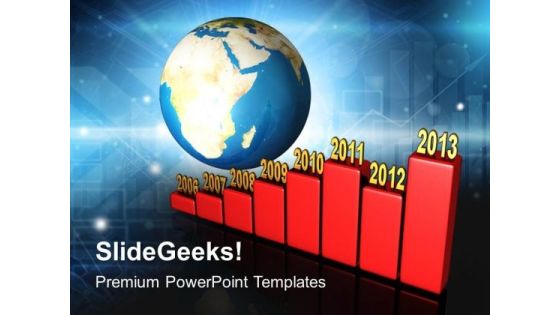
Bar Graph Yearly Along Earth PowerPoint Templates And PowerPoint Themes 1012
Bar Graph Yearly Along Earth PowerPoint Templates And PowerPoint Themes 1012-This PowerPoint Template shows the Annual growth Chart from 2006 to 2013 in the Graphical manner. It imitates the concept of Money, Business, Profit, Loss etc. Use this Template for Increasing and decreasing Bar Graph. Clarity of thought has been the key to your growth. Use our templates to illustrate your ability-Bar Graph Yearly Along Earth PowerPoint Templates And PowerPoint Themes 1012-This PowerPoint template can be used for presentations relating to-Bar graph showing the growth of profits, business, finance, success, earth, globe

White And Yellow Bar Graph Business Shapes PowerPoint Templates And PowerPoint Themes 1012
White And Yellow Bar Graph Business Shapes PowerPoint Templates And PowerPoint Themes 1012-Use this Above PowerPoint Template Displaying the Bar Graph in Circular Manner. It indicates beefing up, boost, buildup, crop, cultivation, enlargement, evolution, gain, heightening, hike, improvement, increase. Original thinking is the need of the hour. We provide the means to project your views.-White And Yellow Bar Graph Business Shapes PowerPoint Templates And PowerPoint Themes 1012-This PowerPoint template can be used for presentations relating to-Bar graph showing the growth, business, finance, success, marketing, shapes

Bar Graph With Dollar Marketing PowerPoint Templates And PowerPoint Themes 1012
Bar Graph with Dollar Marketing PowerPoint Templates And PowerPoint Themes 1012-Emphatically define your message with our above template which contains a graphic of bar graph with dollar notes. This image clearly defines the concept of business statistics and financial reviews. Our stunning image makes your presentations professional showing that you care about even the smallest details. Create captivating presentations to deliver comparative and weighted arguments.-Bar Graph with Dollar Marketing PowerPoint Templates And PowerPoint Themes 1012-This PowerPoint template can be used for presentations relating to-Business graph and dollar, money, finance, success, business, marketing
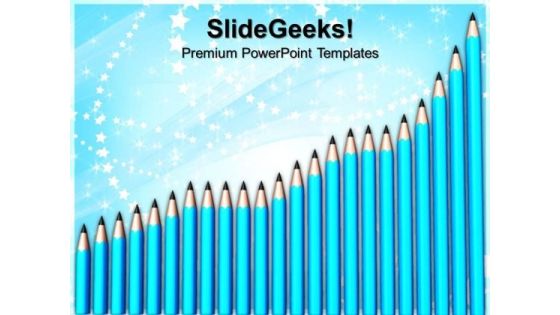
Group Of Pencils Forming Graph PowerPoint Templates And PowerPoint Themes 1012
Group Of Pencils Forming Graph PowerPoint Templates And PowerPoint Themes 1012-Use this PowerPoint Template to illustrate the business concept. This Template shows group of pencils forming bar graph symbolizing growth and success. The ideas and plans are on your fingertips. Now imprint them on the minds of your audience via our slides. This image has been conceived to enable you to emphatically communicate your ideas in your Marketing and Business PPT presentations.-Group Of Pencils Forming Graph PowerPoint Templates And PowerPoint Themes 1012-This PowerPoint template can be used for presentations relating to-Pencils forming a graph, business, education, children, shapes, success
A Corporate Business Growth Graph PowerPoint Templates And PowerPoint Themes 1012
A Corporate Business Growth Graph PowerPoint Templates And PowerPoint Themes 1012-This PowerPoint Template shows the Bar Graph with increasing percentage which signifies the Financial or Business Growth. The Template signifies business concept. It signifies teamwork and team leader. Use this template for Global Business. The structure of our templates allows you to effectively highlight the key issues concerning the growth of your business.-A Corporate Business Growth Graph PowerPoint Templates And PowerPoint Themes 1012-This PowerPoint template can be used for presentations relating to-Business bar graph chart, technology, finance, arrows, business, success

Business Strategy And Policy 3d Man With Money Market Graph Characters
Connect The Dots With Our business strategy and policy 3d man with money market graph characters Powerpoint Templates. Watch The Whole Picture Clearly Emerge.

Business Strategy Plan Bar Graph And Currency Symbol Foreign Exchange Clipart
Plan For All Contingencies With Our Business Strategy Plan Bar Graph And Currency Symbol Foreign Exchange Clipart Powerpoint Templates. Douse The Fire Before It Catches.

Business Strategy Plan Bar Graph And Yen Symbol Currency Value Clipart
Good Camaraderie Is A Key To Teamwork. Our Business Strategy Plan Bar Graph And Yen Symbol Currency Value Clipart Powerpoint Templates Can Be A Cementing Force.
 Home
Home