Errc Graph

Data Analysis Template Driven Line Chart Business Graph PowerPoint Slides Templates
Bottle Your Thoughts In Our data analysis template driven line chart business graph powerpoint slides Templates . Pass It Around For Your Audience To Sip.
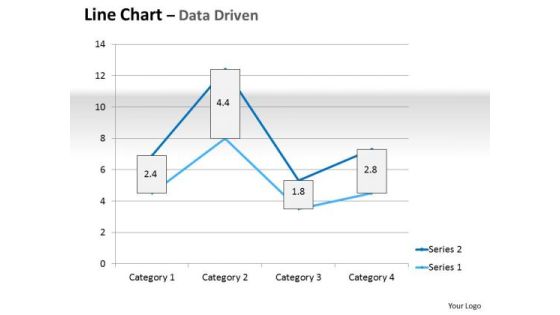
Multivariate Data Analysis Driven Line Chart Market Graph PowerPoint Slides Templates
Plan For All Contingencies With Our multivariate data analysis driven line chart market graph powerpoint slides Templates . Douse The Fire Before It Catches.

Business Education PowerPoint Templates Business Bar Graph Data Driven Ppt Slides
Business Education PowerPoint Templates Business bar graph data driven PPT Slides-This PowerPoint slide is a data driven Columns Chart. The number of columns depend on the data.-Business Editable PowerPoint Templates Business beveled column chart PPT Slides-This ppt can be used for concepts relating to-chart,, graph, growth, investment, , market, percentage, , presentation report, results, statistics, stock, success and business.

Graph Showing Technical Analysis Of Stock Trading Ppt PowerPoint Presentation Infographic Template Portrait PDF
Presenting this set of slides with name graph showing technical analysis of stock trading ppt powerpoint presentation infographic template portrait pdf. This is a three stage process. The stages in this process are graph showing technical analysis of stock trading. This is a completely editable PowerPoint presentation and is available for immediate download. Download now and impress your audience.

cost volume profit analysis break even point graph ppt powerpoint presentation professional shapes
This is a cost volume profit analysis break even point graph ppt powerpoint presentation professional shapes. This is a four stage process. The stages in this process are break even point,break even analysis,break even level.

Data Driven Economic Facts And Insights Graph For Product Ppt PowerPoint Presentation Pictures Slide Download PDF
Pitch your topic with ease and precision using this data driven economic facts and insights graph for product ppt powerpoint presentation pictures slide download pdf. This layout presents information on year 2021, product, data driven economic. It is also available for immediate download and adjustment. So, changes can be made in the color, design, graphics or any other component to create a unique layout.
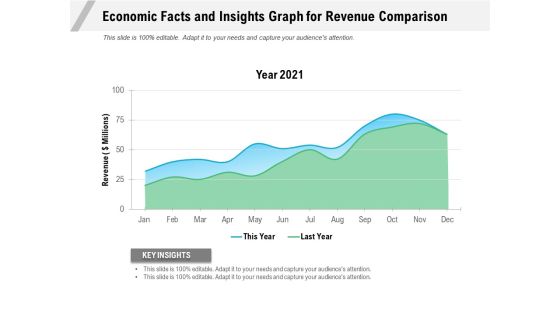
Economic Facts And Insights Graph For Revenue Comparison Ppt PowerPoint Presentation Gallery Portfolio PDF
Pitch your topic with ease and precision using this economic facts and insights graph for revenue comparison ppt powerpoint presentation gallery portfolio pdf. This layout presents information on year 2021, revenue, key insights. It is also available for immediate download and adjustment. So, changes can be made in the color, design, graphics or any other component to create a unique layout.

Business Development Program Employee Productivity And Efficiency Graph For Last 5 Years Ideas PDF
The following slide showcases he employees productivity and efficiency graph for last years which shows that employees productivity has declined during this time period because of lack of training programs and high attrition rate. Whether you have daily or monthly meetings, a brilliant presentation is necessary. Business Development Program Employee Productivity And Efficiency Graph For Last 5 Years Ideas PDF can be your best option for delivering a presentation. Represent everything in detail using Business Development Program Employee Productivity And Efficiency Graph For Last 5 Years Ideas PDF and make yourself stand out in meetings. The template is versatile and follows a structure that will cater to your requirements. All the templates prepared by Slidegeeks are easy to download and edit. Our research experts have taken care of the corporate themes as well. So, give it a try and see the results.
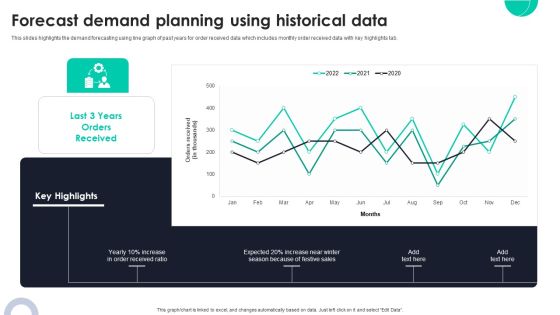
Forecast Demand Planning Using Historical Data Ppt PowerPoint Presentation Diagram Graph Charts PDF
This slides highlights the demand forecasting using line graph of past years for order received data which includes monthly order received data with key highlights tab. Crafting an eye catching presentation has never been more straightforward. Let your presentation shine with this tasteful yet straightforward Forecast Demand Planning Using Historical Data Ppt PowerPoint Presentation Diagram Graph Charts PDF template. It offers a minimalistic and classy look that is great for making a statement. The colors have been employed intelligently to add a bit of playfulness while still remaining professional. Construct the ideal Forecast Demand Planning Using Historical Data Ppt PowerPoint Presentation Diagram Graph Charts PDF that effortlessly grabs the attention of your audience. Begin now and be certain to wow your customers.
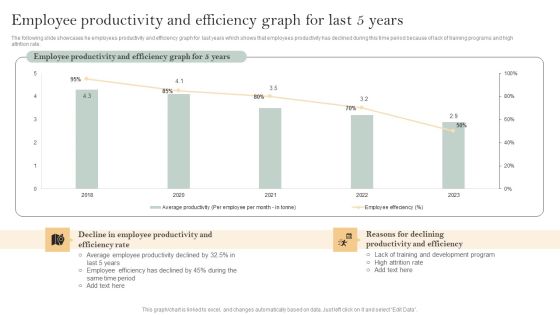
Skill Enhancement Plan Employee Productivity And Efficiency Graph For Last 5 Years Microsoft PDF
The following slide showcases he employees productivity and efficiency graph for last years which shows that employees productivity has declined during this time period because of lack of training programs and high attrition rate. Find highly impressive Skill Enhancement Plan Employee Productivity And Efficiency Graph For Last 5 Years Microsoft PDF on Slidegeeks to deliver a meaningful presentation. You can save an ample amount of time using these presentation templates. No need to worry to prepare everything from scratch because Slidegeeks experts have already done a huge research and work for you. You need to download Skill Enhancement Plan Employee Productivity And Efficiency Graph For Last 5 Years Microsoft PDF for your upcoming presentation. All the presentation templates are 100 percent editable and you can change the color and personalize the content accordingly. Download now
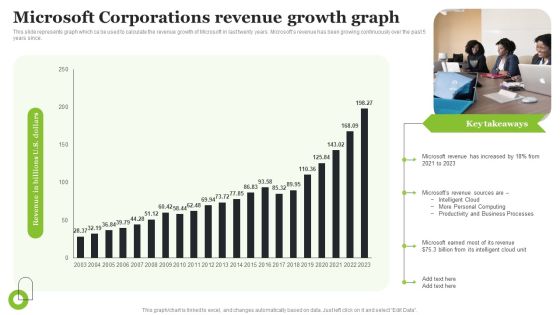
Microsoft Strategic Plan To Become Market Leader Microsoft Corporations Revenue Growth Graph Portrait PDF
This slide represents graph which ca be used to calculate the revenue growth of Microsoft in last twenty years. Microsofts revenue has been growing continuously over the past 5 years since. Whether you have daily or monthly meetings, a brilliant presentation is necessary. Microsoft Strategic Plan To Become Market Leader Microsoft Corporations Revenue Growth Graph Portrait PDF can be your best option for delivering a presentation. Represent everything in detail using Microsoft Strategic Plan To Become Market Leader Microsoft Corporations Revenue Growth Graph Portrait PDF and make yourself stand out in meetings. The template is versatile and follows a structure that will cater to your requirements. All the templates prepared by Slidegeeks are easy to download and edit. Our research experts have taken care of the corporate themes as well. So, give it a try and see the results.

Stock Photo 3d Ecg Graph And Red Heart For Heart Health Image Graphics For PowerPoint Slide
This exclusive power point image has been designed with graphic of heart in the centre of graph. This graph is can be used as ECG for heart beat. This template is suitable for medical and heart issues related presentations.

Stock Photo 3d Heart Beat Graph For Heart Health Image Graphics For PowerPoint Slide
This exclusive power point image has been designed with graphic of heart in the centre of graph. This graph may be used as ECG for heart beat. This template is suitable for medical and heart issues related presentations.
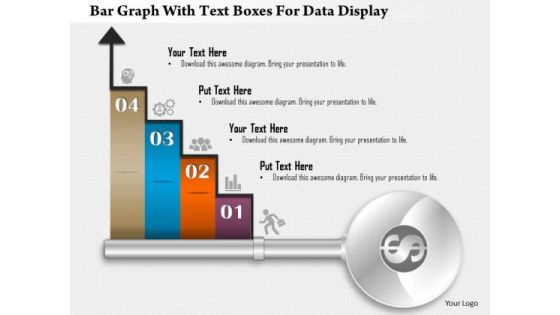
Business Diagram Bar Graph With Text Boxes For Data Display Presentation Template
Our above business diagram displays bar graph. It contains four steps on bar graph with icons. Use this diagram to display four stages of business growth. Download this Power Point slide to build quality presentation for your viewers.

Financial Projection Graph Template 1 Ppt PowerPoint Presentation Professional Example Introduction
This is a financial projection graph template 1 ppt powerpoint presentation professional example introduction. This is a three stage process. The stages in this process are business, bar graph, finance, marketing, strategy, analysis.

Financial Projection Graph Template 2 Ppt PowerPoint Presentation Infographic Template Gallery
This is a financial projection graph template 2 ppt powerpoint presentation infographic template gallery. This is a three stage process. The stages in this process are business, bar graph, finance, marketing, strategy, analysis.

Investor Funding Deck For Hybrid Financing Financial Graph Historical And Projection Ppt Layouts Slides PDF
The slide provides the graph of companys financials revenue, operating income and net income for last 5 years historical and coming 4 years forecasted. Deliver and pitch your topic in the best possible manner with this investor funding deck for hybrid financing financial graph historical and projection ppt layouts slides pdf. Use them to share invaluable insights on historical, forecasted, net income, operating income, financial and impress your audience. This template can be altered and modified as per your expectations. So, grab it now.

Investment Pitch To Generating Capital From Mezzanine Credit Financial Graph Historical And Projection Microsoft PDF
The slide provides the graph of companys financials revenue, operating income and net income for last 5 years historical and coming 4 years forecasted. Deliver and pitch your topic in the best possible manner with this investment pitch to generating capital from mezzanine credit financial graph historical and projection microsoft pdf. Use them to share invaluable insights on revenue, operating income, net income, current year, historical, forecasted and impress your audience. This template can be altered and modified as per your expectations. So, grab it now.
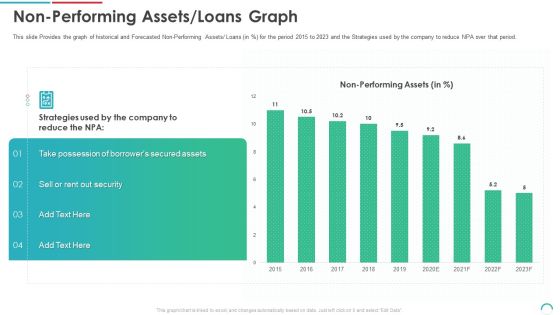
Post Initial Public Offering Equity Financing Pitch Non Performing Assets Loans Graph Infographics PDF
This slide Provides the graph of historical and Forecasted Non-Performing Assets Loans in percent for the period 2015 to 2023 and the Strategies used by the company to reduce NPA over that period. Deliver an awe inspiring pitch with this creative post initial public offering equity financing pitch non performing assets loans graph infographics pdf bundle. Topics like secured assets, performing assets, 2015 to 2023 can be discussed with this completely editable template. It is available for immediate download depending on the needs and requirements of the user.
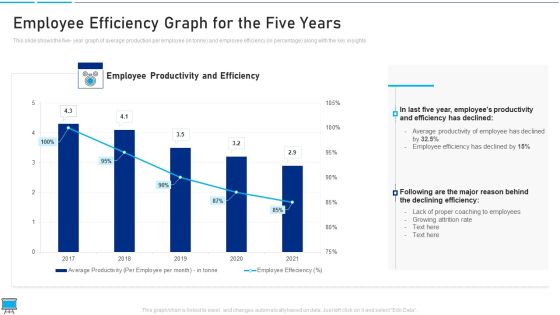
Performance Training Action Plan And Extensive Strategies Employee Efficiency Graph For The Five Years Guidelines PDF
This slide shows the five year graph of average production per employee in tonne and employee efficiency in percentage along with the key insights Deliver and pitch your topic in the best possible manner with this performance training action plan and extensive strategies employee efficiency graph for the five years guidelines pdf Use them to share invaluable insights on declining efficiency, proper coaching to employees, employee efficiency and impress your audience. This template can be altered and modified as per your expectations. So, grab it now.
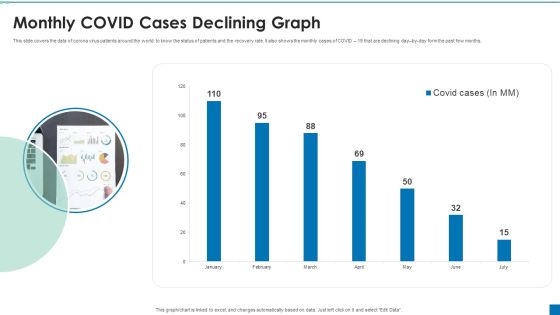
Monthly COVID Cases Declining Graph Ppt PowerPoint Presentation Ideas Slide Portrait PDF
This slide covers the data of corona virus patients around the world to know the status of patients and the recovery rate. It also shows the monthly cases of COVID 19 that are declining day by day form the past few months.Showcasing this set of slides titled Monthly COVID Cases Declining Graph Ppt PowerPoint Presentation Ideas Slide Portrait PDF. The topics addressed in these templates are Monthly Covid Cases, Declining Graph. All the content presented in this PPT design is completely editable. Download it and make adjustments in color, background, font etc. as per your unique business setting.

Monthly Comparison Graph For Operating And Gross Profit Margin Pictures PDF
This slide showcases monthly comparison graph that can help organization to compare the profits margin generated in different months. Its key components are gross, operating and net profit margin. Showcasing this set of slides titled Monthly Comparison Graph For Operating And Gross Profit Margin Pictures PDF. The topics addressed in these templates are Gross Profit Margin, Operating Profit Margin, Net Profit Margin. All the content presented in this PPT design is completely editable. Download it and make adjustments in color, background, font etc. as per your unique business setting.

Actual Vs Budgeted Expenses Graph For Human Resource Activities Guidelines PDF
This slide showcases graph that can help organization to compare the actual and budgeted expenses incurred in conducting human resource activities. Its key components are workplace safety, labour relations, recruitment and employee health. Showcasing this set of slides titled Actual Vs Budgeted Expenses Graph For Human Resource Activities Guidelines PDF. The topics addressed in these templates are Safety Equipment Webinars, Employee, Expenses. All the content presented in this PPT design is completely editable. Download it and make adjustments in color, background, font etc. as per your unique business setting.

Annual Human Resource Report With Employee Hiring And Promotion Graph Mockup PDF
This slide showcases HR report and graph that can help organization to identify number of of employees demoted and promoted in the company. It showcases comparison for a period of last three years. Pitch your topic with ease and precision using this Annual Human Resource Report With Employee Hiring And Promotion Graph Mockup PDF. This layout presents information on Technology, Product, Employees. It is also available for immediate download and adjustment. So, changes can be made in the color, design, graphics or any other component to create a unique layout.

Human Resource Graph To Compare Yearly Employee Count By Department Professional PDF
This slide showcases graph that can help organization to compare the yearly change in employees numbers of different departments. It showcases comparison for a period of two years. Showcasing this set of slides titled Human Resource Graph To Compare Yearly Employee Count By Department Professional PDF. The topics addressed in these templates are Marketing Department, Sales Department, Research Department. All the content presented in this PPT design is completely editable. Download it and make adjustments in color, background, font etc. as per your unique business setting.

Graph Highlighting Labor Relation Disputes For Different Years Ppt PowerPoint Presentation Gallery Sample PDF
This slide covers graph which shows strikes and Lockouts from the period of 2017 to 2021. This slide highlights strikes and Lockouts are the top main reasons for poor industrial relations. Showcasing this set of slides titled Graph Highlighting Labor Relation Disputes For Different Years Ppt PowerPoint Presentation Gallery Sample PDF. The topics addressed in these templates are Legends, Strikes, Lockouts. All the content presented in this PPT design is completely editable. Download it and make adjustments in color, background, font etc. as per your unique business setting.

Business Revenue Bar Graph With Business Operational Expenditure Details Summary PDF
This slide represents business revenue bar graph with OPEX details which can be referred by companies to earn more revenue by controlling expenditures. It also provides information about marketing and sales, research and development, administration, total revenue, etc. Pitch your topic with ease and precision using this Business Revenue Bar Graph With Business Operational Expenditure Details Summary PDF. This layout presents information on Cost Of Marketing, Sales, Highest Amount. It is also available for immediate download and adjustment. So, changes can be made in the color, design, graphics or any other component to create a unique layout.

E Commerce Business Sales Monthly Forecast Graph Ppt Infographics Show PDF
This slide shows the table and graph representing monthly sales forecast of an e-commerce business. It shows details related to the expected growth rate, historical data, projected data and actual growth of sales. Pitch your topic with ease and precision using this E Commerce Business Sales Monthly Forecast Graph Ppt Infographics Show PDF. This layout presents information on Expected Growth Rate, Historical, Actual Growth Rate. It is also available for immediate download and adjustment. So, changes can be made in the color, design, graphics or any other component to create a unique layout.

Bar Graph Depicting Liquidity Ratio Analysis For 5 Years Graphics PDF
This showcases bar graph that can help organization to compare the liquidity ratios and take mitigation actions in case of decline. It showcases comparison of cash, quick and current ratio for a period of 5 financial years. Showcasing this set of slides titled Bar Graph Depicting Liquidity Ratio Analysis For 5 Years Graphics PDF. The topics addressed in these templates are Organization To Compare, The Liquidity Ratios, Mitigation Action Decline. All the content presented in this PPT design is completely editable. Download it and make adjustments in color, background, font etc. as per your unique business setting.

Current And Quick Ratio Comparison Graph For Liquidity Assessment Structure PDF
This slide showcases current and quick ratio graph that can help to evaluate companys liquidity and and assess the company abilities to pay off debt. It also showcases comparison of ratio with previous financial year. Showcasing this set of slides titled Current And Quick Ratio Comparison Graph For Liquidity Assessment Structure PDF. The topics addressed in these templates are Short Term Debt, Delayed Payments, Cash Shortage. All the content presented in this PPT design is completely editable. Download it and make adjustments in color, background, font etc. as per your unique business setting.

Line Comparison Graph For Yearly Liquidity Ratio Analysis Comparison Topics PDF
This slide showcases liquidity ratios graph that can help in identifying cash richness and financial position of organization. It showcases comparison for last 6 years and it key components are current ratio, quick ratio and cash ratio. Showcasing this set of slides titled Line Comparison Graph For Yearly Liquidity Ratio Analysis Comparison Topics PDF. The topics addressed in these templates are Term Financing, Cash Shortage, Cash Ratio. All the content presented in this PPT design is completely editable. Download it and make adjustments in color, background, font etc. as per your unique business setting.

Charity Fundraising Marketing Plan Bar Graph Ppt PowerPoint Presentation File Example Introduction PDF
Find highly impressive Charity Fundraising Marketing Plan Bar Graph Ppt PowerPoint Presentation File Example Introduction PDF on Slidegeeks to deliver a meaningful presentation. You can save an ample amount of time using these presentation templates. No need to worry to prepare everything from scratch because Slidegeeks experts have already done a huge research and work for you. You need to download Charity Fundraising Marketing Plan Bar Graph Ppt PowerPoint Presentation File Example Introduction PDF for your upcoming presentation. All the presentation templates are 100 percent editable and you can change the color and personalize the content accordingly. Download now.

Corporate Training Program Employee Productivity And Efficiency Graph For Last 5 Years Elements PDF
The following slide showcases he employees productivity and efficiency graph for last years which shows that employees productivity has declined during this time period because of lack of training programs and high attrition rate. Make sure to capture your audiences attention in your business displays with our gratis customizable Corporate Training Program Employee Productivity And Efficiency Graph For Last 5 Years Elements PDF. These are great for business strategies, office conferences, capital raising or task suggestions. If you desire to acquire more customers for your tech business and ensure they stay satisfied, create your own sales presentation with these plain slides.
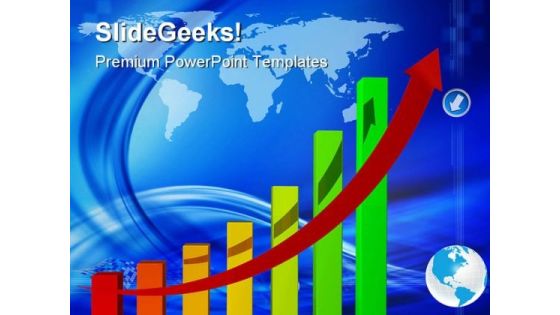
Statistique Of Business Graph Success PowerPoint Templates And PowerPoint Backgrounds 0411
Microsoft PowerPoint Template and Background with rainbow colored financial graph showing strong growth all the way up
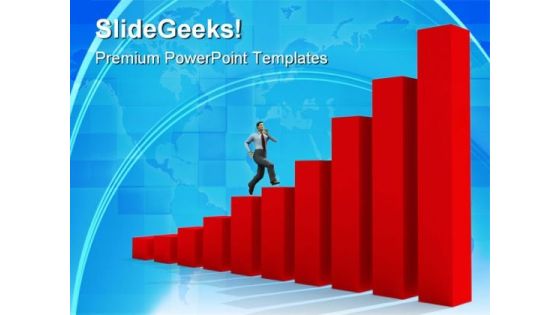
Man Run Up On Graph Business PowerPoint Templates And PowerPoint Backgrounds 0511
Microsoft PowerPoint Template and Background with man moving up on graph chart business growth success finances diagram improvement

Businessman Standing On Graph Success PowerPoint Templates And PowerPoint Backgrounds 0511
Microsoft PowerPoint Template and Background with a 3d image of happy businessman which stands on the top of higher graph

Statistique Of Business Graph Success PowerPoint Themes And PowerPoint Slides 0411
Microsoft PowerPoint Theme and Slide with rainbow colored financial graph showing strong growth all the way up

Man Run Up On Graph Business PowerPoint Themes And PowerPoint Slides 0511
Microsoft PowerPoint Slide and Theme with man moving up on graph chart business growth success finances diagram improvement

Oil Barrel With Finance Graph Business PowerPoint Templates And PowerPoint Themes 0812
Oil Barrel With Finance Graph Business PowerPoint Templates And PowerPoint Themes 0812-Microsoft Powerpoint Templates and Background with oil barrels

Graph Of Products Sale Business PowerPoint Templates And PowerPoint Themes 0912
Graph Of Products Sale Business PowerPoint Templates And PowerPoint Themes Presentations-Microsoft Powerpoint Templates and Background with graph of products sale-Graph Of Products Sale Business PowerPoint Templates And PowerPoint Themes PresentationsThis PPT can be used for presentations relating to-Graph of products sale, business, cylinders, success, finance, shapes
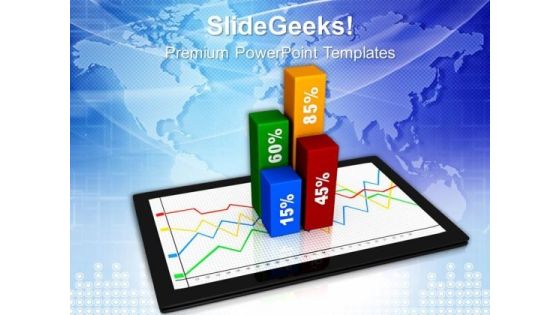
Graph On Ipad Business Growth PowerPoint Templates And PowerPoint Themes 1012
Graph On Ipad Business Growth PowerPoint Templates And PowerPoint Themes 1012-Microsoft Powerpoint Templates and Background with ipad showing success graph-Graph On Ipad Business Growth PowerPoint Templates And PowerPoint Themes 1012-This PowerPoint template can be used for presentations relating to-Ipad showing success graph, business, success, technology, finance, marketing

Stock Photo World Map On Bar Graph For Data Growth Image Graphics For PowerPoint Slide
This image is designed with blue graph with world map printed on it. This conceptual image portrays the concepts of global business and global economy. This image slide will help you express your views to target audience.

Business Diagram Graph Of Sustainable Environment With Business Growth Presentation Template
This diagram displays bar graph with globes and growth arrow. This image depicts concepts of green environment and business growth .Use this diagram to present your views in a wonderful manner.

Business Diagram Bar Graph Style Timeline Diagram For Business Presentation Template
This business slide has been designed with bar graph style timeline diagram. Download this diagram to depict business annual plans and growth on your presentations. Make your presentations outshine using this diagram slide.
Dollar Mobile Bar Graph And Monitor Icons In Circles Powerpoint Templates
Our above slide has been designed with dollar, mobile, bar graph and monitor icons. This infographic slide is best to describe text information. You can provide a fantastic explanation of the topic with this slide.

5 Level Bar Graph For Analysis With Icons Ppt PowerPoint Presentation Shapes
This is a 5 level bar graph for analysis with icons ppt powerpoint presentation shapes. This is a five stage process. The stages in this process are business, strategy, marketing, icons, growth, management.

Bar Graph To Show Company Sales Budget Ppt PowerPoint Presentation Sample
This is a bar graph to show company sales budget ppt powerpoint presentation sample. This is a four stage process. The stages in this process are business, finance, growth, success, marketing, arrow.

Bar Graph Shows Financial Values Ppt PowerPoint Presentation Infographic Template Gridlines
This is a bar graph shows financial values ppt powerpoint presentation infographic template gridlines. This is a two stage process. The stages in this process are bar, marketing, strategy, finance, planning.
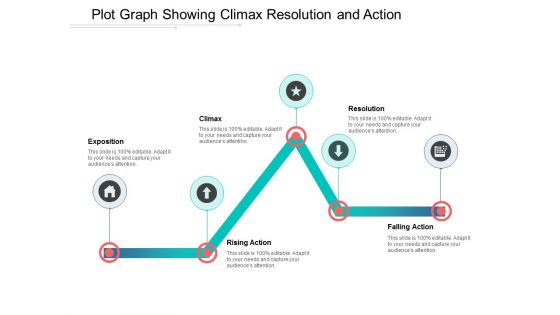
Plot Graph Showing Climax Resolution And Action Ppt Powerpoint Presentation Outline Themes
This is a plot graph showing climax resolution and action ppt powerpoint presentation outline themes. This is a five stage process. The stages in this process are scatter plot, probability plots, plot diagram.
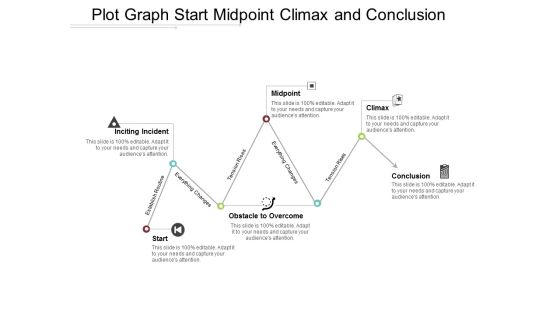
Plot Graph Start Midpoint Climax And Conclusion Ppt Powerpoint Presentation Portfolio Microsoft
This is a plot graph start midpoint climax and conclusion ppt powerpoint presentation portfolio microsoft. This is a six stage process. The stages in this process are scatter plot, probability plots, plot diagram.
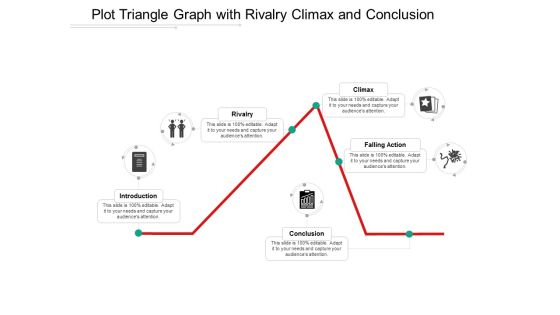
Plot Triangle Graph With Rivalry Climax And Conclusion Ppt Powerpoint Presentation Ideas Design Inspiration
This is a plot triangle graph with rivalry climax and conclusion ppt powerpoint presentation ideas design inspiration. This is a five stage process. The stages in this process are scatter plot, probability plots, plot diagram.
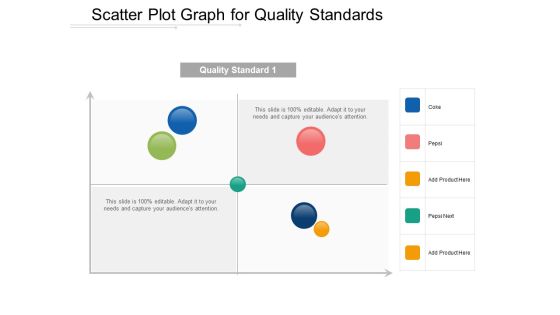
Scatter Plot Graph For Quality Standards Ppt Powerpoint Presentation Show Infographics
This is a scatter plot graph for quality standards ppt powerpoint presentation show infographics. This is a four stage process. The stages in this process are scatter plot, probability plots, plot diagram.

Area Graph Showing Sales Trends Over Time Ppt PowerPoint Presentation Model Background Designs
This is a area graph showing sales trends over time ppt powerpoint presentation model background designs. This is a three stage process. The stages in this process are financial analysis, quantitative, statistical modelling.

Bar Graph Icon For Data Analysis Ppt PowerPoint Presentation Pictures Ideas
This is a bar graph icon for data analysis ppt powerpoint presentation pictures ideas. This is a four stage process. The stages in this process are financial analysis, quantitative, statistical modelling.
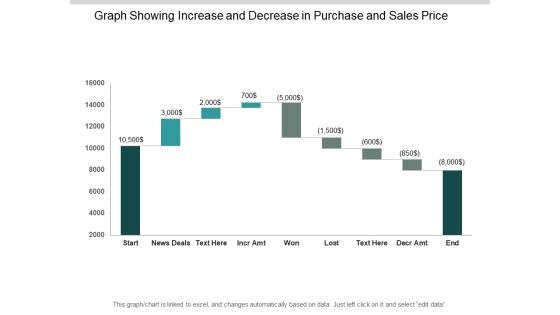
Graph Showing Increase And Decrease In Purchase And Sales Price Ppt PowerPoint Presentation Outline Gallery
This is a graph showing increase and decrease in purchase and sales price ppt powerpoint presentation outline gallery. This is a nine stage process. The stages in this process are sales waterfall, waterfall chart, business.

Sales Graph Showing Payouts Losses And Wins Ppt PowerPoint Presentation Pictures Designs Download
This is a sales graph showing payouts losses and wins ppt powerpoint presentation pictures designs download. This is a eight stage process. The stages in this process are sales waterfall, waterfall chart, business.

Waterfall Graph For Income And Expense Analysis Ppt PowerPoint Presentation File Deck
This is a waterfall graph for income and expense analysis ppt powerpoint presentation file deck. This is a eight stage process. The stages in this process are sales waterfall, waterfall chart, business.
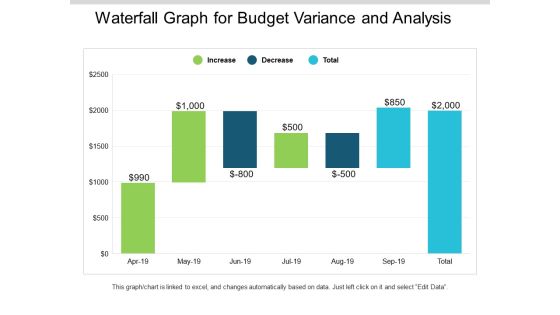
Waterfall Graph For Budget Variance And Analysis Ppt PowerPoint Presentation Slides Mockup
This is a waterfall graph for budget variance and analysis ppt powerpoint presentation slides mockup. This is a three stage process. The stages in this process are profit and loss, balance sheet, income statement, benefit and loss.

Waterfall Graph Showing Births Deaths And Population Change Ppt PowerPoint Presentation Infographic Template Visual Aids
This is a waterfall graph showing births deaths and population change ppt powerpoint presentation infographic template visual aids. This is a three stage process. The stages in this process are profit and loss, balance sheet, income statement, benefit and loss.

Waterfall Graph Showing Net Sales And Gross Profit Ppt PowerPoint Presentation Infographics Format
This is a waterfall graph showing net sales and gross profit ppt powerpoint presentation infographics format. This is a three stage process. The stages in this process are profit and loss, balance sheet, income statement, benefit and loss.
 Home
Home