Comparison Chart

Competitive Analysis Template 8 Matrix Chart Ppt PowerPoint Presentation Designs Download
This is a competitive analysis template 8 matrix chart ppt powerpoint presentation designs download. This is a six stage process. The stages in this process are product quality, product fidelity, after sales service, customer service, price, shipping speed.
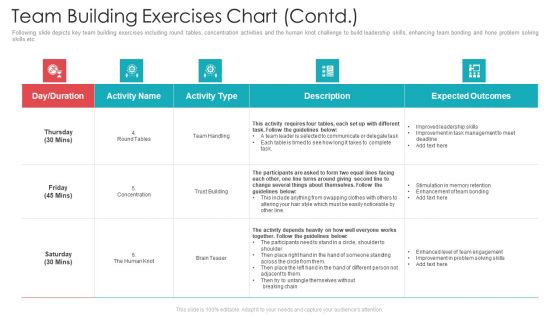
Official Team Collaboration Plan Team Building Exercises Chart Contd Mockup PDF
Mentioned slide covers multiple exercises for achieving confident people management and effective implementation of company practices, while aiming to achieve company-wide performance objectives and goals. Deliver an awe-inspiring pitch with this creative official team collaboration plan team building exercises chart contd mockup pdf bundle. Topics like team building exercises chart can be discussed with this completely editable template. It is available for immediate download depending on the needs and requirements of the user.

Strategy To Improve Team Proficiency Team Building Exercises Chart Skills Elements PDF
Mentioned slide covers multiple exercises for achieving confident people management and effective implementation of company practices, while aiming to achieve company wide performance objectives and goals. Deliver an awe inspiring pitch with this creative strategy to improve team proficiency team building exercises chart skills elements pdf bundle. Topics like team building exercises chart can be discussed with this completely editable template. It is available for immediate download depending on the needs and requirements of the user.

Project Timeline For Strategic Planning Gantt Chart Ppt PowerPoint Presentation Professional Ideas
This is a project timeline for strategic planning gantt chart ppt powerpoint presentation professional ideas. This is a three stage process. The stages in this process are Business, Strategy, Marketing, Analysis, Table.
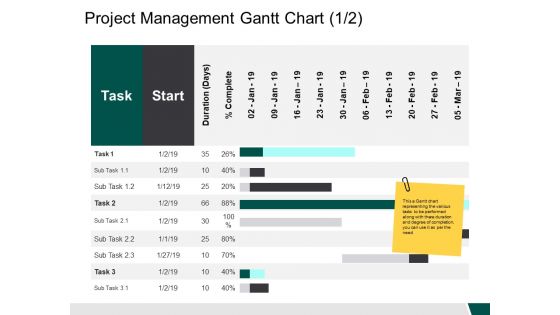
Project Management Gantt Chart Start Ppt PowerPoint Presentation Outline Example Introduction
This is a project management gantt chart start ppt powerpoint presentation outline example introduction. This is a two stage process. The stages in this process are business, management, strategy, analysis, marketing.
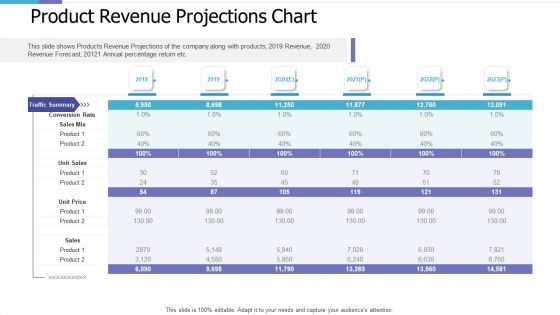
Product Revenue Projections Chart Investor Pitch Deck For PE Funding Brochure PDF
This slide shows Products Revenue Projections of the company along with products, 2019 Revenue, 2020 Revenue Forecast, 20121 Annual percentage return etc. Deliver an awe inspiring pitch with this creative product revenue projections chart investor pitch deck for pe funding brochure pdf bundle. Topics like product revenue projections chart can be discussed with this completely editable template. It is available for immediate download depending on the needs and requirements of the user.

Input Process Output Chart To Analyze Impact Of Technological Change Graphics PDF
This slide covers the IPO input-process-output chart depicting the impact on consumer behavior based on the changes in technology. The purpose of this IPO chart is to analyze the advancement of technology. It includes information related to the environmental factors, consumer details, etc. Pitch your topic with ease and precision using this Input Process Output Chart To Analyze Impact Of Technological Change Graphics PDF. This layout presents information on Input External Influences, Process Consumer, Output Results. It is also available for immediate download and adjustment. So, changes can be made in the color, design, graphics or any other component to create a unique layout.

Organizational Input Process Output Chart To Receive Products From Suppliers Topics PDF
This slide defines the IPO input-process-output chart used by the organization to receive products from suppliers. The purpose of this IPO chart is to explain the process of ordering and receiving products . It includes information related to the transactions, documents, reports etc. Pitch your topic with ease and precision using this Organizational Input Process Output Chart To Receive Products From Suppliers Topics PDF. This layout presents information on Data Collection And Input, Process, Output. It is also available for immediate download and adjustment. So, changes can be made in the color, design, graphics or any other component to create a unique layout.
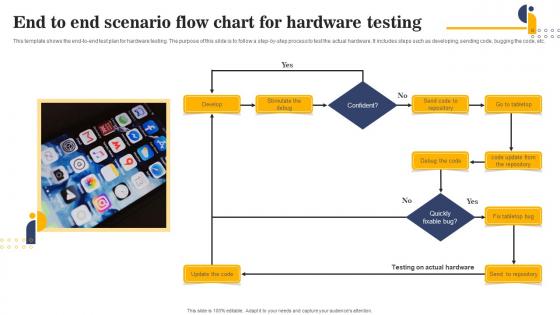
End To End Scenario Flow Chart For Hardware Testing Portrait Pdf
This template shows the end-to-end test plan for hardware testing. The purpose of this slide is to follow a step-by-step process to test the actual hardware. It includes steps such as developing, sending code, bugging the code, etc.Pitch your topic with ease and precision using this End To End Scenario Flow Chart For Hardware Testing Portrait Pdf This layout presents information on End To End, Scenario Flow Chart, Hardware Testing It is also available for immediate download and adjustment. So, changes can be made in the color, design, graphics or any other component to create a unique layout.
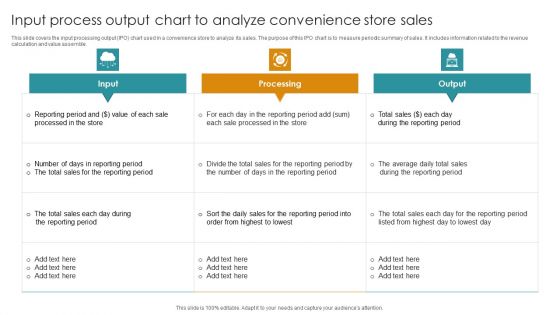
Input Process Output Chart To Analyze Convenience Store Sales Microsoft PDF
This slide covers the input processing output IPO chart used in a convenience store to analyze its sales. The purpose of this IPO chart is to measure periodic summary of sales. It includes information related to the revenue calculation and value assemble. Pitch your topic with ease and precision using this Input Process Output Chart To Analyze Convenience Store Sales Microsoft PDF. This layout presents information on Input, Processing, Output. It is also available for immediate download and adjustment. So, changes can be made in the color, design, graphics or any other component to create a unique layout.

Marketing Communication Channels For Increasing Brand Awarenes Product Capability Assessment Gantt Chart Download PDF
Understanding the capability of the product is a key point that helps the organization to better understand the market dynamic The following Gantt chart highlights the key stages of the process along with the time duration for executing the same This is a marketing communication channels for increasing brand awarenes product capability assessment gantt chart download pdf template with various stages. Focus and dispense information on one stages using this creative set, that comes with editable features. It contains large content boxes to add your information on topics like product capability assessment gantt chart. You can also showcase facts, figures, and other relevant content using this PPT layout. Grab it now.
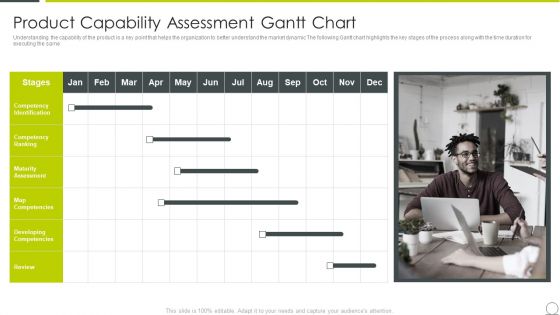
Examining Product Characteristics Brand Messaging Product Capability Assessment Gantt Chart Pictures PDF
Understanding the capability of the product is a key point that helps the organization to better understand the market dynamic The following Gantt chart highlights the key stages of the process along with the time duration for executing the same This is a examining product characteristics brand messaging product capability assessment gantt chart pictures pdf template with various stages. Focus and dispense information on one stages using this creative set, that comes with editable features. It contains large content boxes to add your information on topics like product capability assessment gantt chart. You can also showcase facts, figures, and other relevant content using this PPT layout. Grab it now.
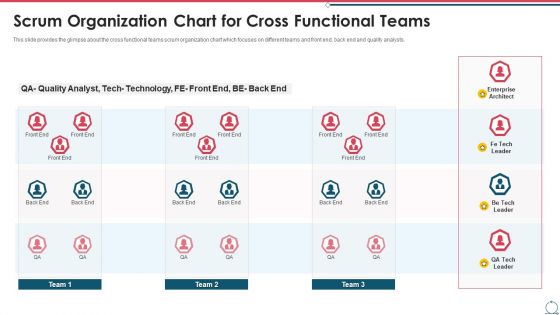
Building An Agile Development Scrum Team Scrum Organization Chart For Cross Functional Teams Mockup PDF
This slide provides the glimpse about the cross functional teams scrum organization chart which focuses on different teams and front end, back end and quality analysts. This is a building an agile development scrum team scrum organization chart for cross functional teams mockup pdf template with various stages. Focus and dispense information on one stages using this creative set, that comes with editable features. It contains large content boxes to add your information on topics like scrum organization chart for cross functional teams. You can also showcase facts, figures, and other relevant content using this PPT layout. Grab it now.
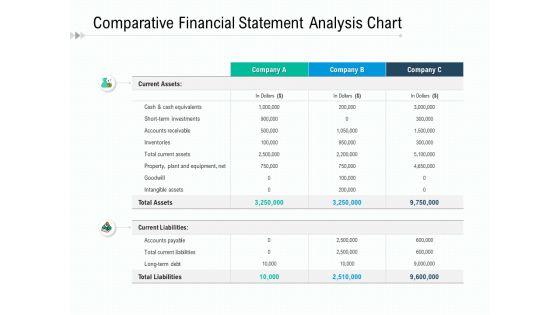
Comparative Financial Statement Analysis Chart Ppt PowerPoint Presentation Model Master Slide
Presenting this set of slides with name comparative financial statement analysis chart ppt powerpoint presentation model master slide. The topics discussed in these slides are current assets, current liabilities, equivalents, investments, inventories. This is a completely editable PowerPoint presentation and is available for immediate download. Download now and impress your audience.
Downturn Graph Icon With Bar Chart And Arrow Ppt PowerPoint Presentation Slides Design Templates PDF
Pitch your topic with ease and precision using this downturn graph icon with bar chart and arrow ppt powerpoint presentation slides design templates pdf. This layout presents information on downturn graph icon with bar chart and arrow. It is also available for immediate download and adjustment. So, changes can be made in the color, design, graphics or any other component to create a unique layout.
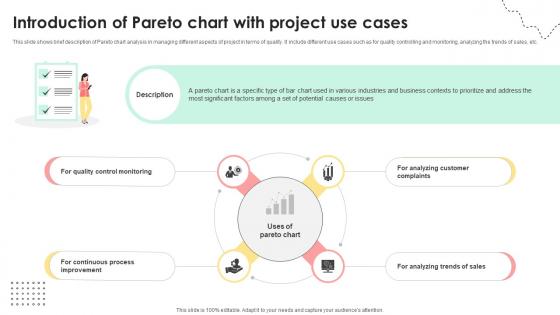
Administering Quality Assurance Introduction Of Pareto Chart With Project Use Cases PM SS V
This slide shows brief description of Pareto chart analysis in managing different aspects of project in terms of quality. It include different use cases such as for quality controlling and monitoring, analyzing the trends of sales, etc. This Administering Quality Assurance Introduction Of Pareto Chart With Project Use Cases PM SS V is perfect for any presentation, be it in front of clients or colleagues. It is a versatile and stylish solution for organizing your meetings. The Administering Quality Assurance Introduction Of Pareto Chart With Project Use Cases PM SS V features a modern design for your presentation meetings. The adjustable and customizable slides provide unlimited possibilities for acing up your presentation. Slidegeeks has done all the homework before launching the product for you. So, do not wait, grab the presentation templates today
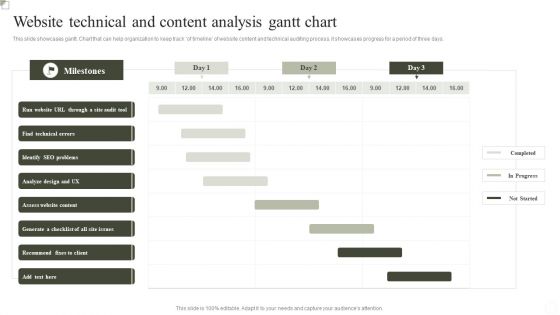
Website Technical And Content Analysis Gantt Chart Ppt Portfolio Example PDF
This slide showcases gantt. Chart that can help organization to keep track of timeline of website content and technical auditing process. it showcases progress for a period of three days. Pitch your topic with ease and precision using this Website Technical And Content Analysis Gantt Chart Ppt Portfolio Example PDF. This layout presents information on Find Technical Errors, Identify SEO Problems, Assess Website Content. It is also available for immediate download and adjustment. So, changes can be made in the color, design, graphics or any other component to create a unique layout.
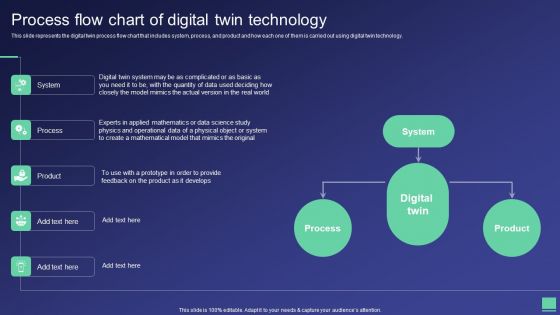
Digital Twin Tech IT Process Flow Chart Of Digital Twin Technology Structure PDF
This slide represents the digital twin process flow chart that includes system, process, and product and how each one of them is carried out using digital twin technology. Presenting this PowerPoint presentation, titled Digital Twin Tech IT Process Flow Chart Of Digital Twin Technology Structure PDF, with topics curated by our researchers after extensive research. This editable presentation is available for immediate download and provides attractive features when used. Download now and captivate your audience. Presenting this Digital Twin Tech IT Process Flow Chart Of Digital Twin Technology Structure PDF. Our researchers have carefully researched and created these slides with all aspects taken into consideration. This is a completely customizable Digital Twin Tech IT Process Flow Chart Of Digital Twin Technology Structure PDF that is available for immediate downloading. Download now and make an impact on your audience. Highlight the attractive features available with our PPTs.
Three Column Chart With Various Solutions And Icons Ppt PowerPoint Presentation Infographic Template Graphics Design PDF
Pitch your topic with ease and precision using this three column chart with various solutions and icons ppt powerpoint presentation infographic template graphics design pdf. This layout presents information on three column chart with various solutions and icons. It is also available for immediate download and adjustment. So, changes can be made in the color, design, graphics or any other component to create a unique layout.
Quarterly Sales By Areas Report With Pie Chart Vector Icon Ppt PowerPoint Presentation Layouts Gallery PDF
Pitch your topic with ease and precision using this quarterly sales by areas report with pie chart vector icon ppt powerpoint presentation layouts gallery pdf. This layout presents information on quarterly sales by areas report with pie chart vector icon. It is also available for immediate download and adjustment. So, changes can be made in the color, design, graphics or any other component to create a unique layout.
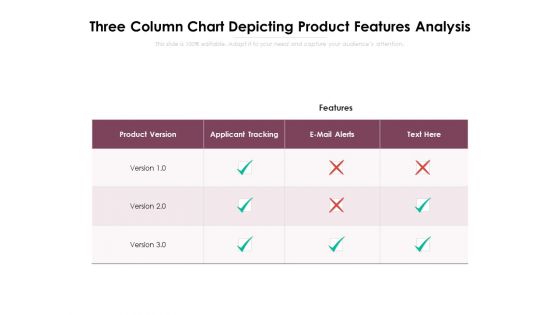
Three Column Chart Depicting Product Features Analysis Ppt PowerPoint Presentation File Slideshow PDF
Pitch your topic with ease and precision using this three column chart depicting product features analysis ppt powerpoint presentation file slideshow pdf. This layout presents information on product version, applicant tracking, e mail alerts. It is also available for immediate download and adjustment. So, changes can be made in the color, design, graphics or any other component to create a unique layout.
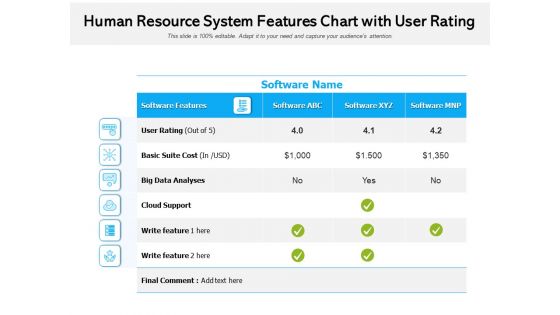
Human Resource System Features Chart With User Rating Ppt PowerPoint Presentation File Example PDF
Pitch your topic with ease and precision using this human resource system features chart with user rating ppt powerpoint presentation file example pdf. This layout presents information on basic suite cost, cloud support, big data analyses. It is also available for immediate download and adjustment. So, changes can be made in the color, design, graphics or any other component to create a unique layout.

Price Chart With Bronze Silver And Gold Plus Ppt PowerPoint Presentation Gallery Graphics Design PDF
Pitch your topic with ease and precision using this price chart with bronze silver and gold plus ppt powerpoint presentation gallery graphics design pdf. This layout presents information on price chart with bronze silver and gold plus. It is also available for immediate download and adjustment. So, changes can be made in the color, design, graphics or any other component to create a unique layout.
Chart Showing Benefits Of Buying Products Ppt PowerPoint Presentation Icon Files PDF
Showcasing this set of slides titled chart showing benefits of buying products ppt powerpoint presentation icon files pdf. The topics addressed in these templates are efficient, convenient, low cost. All the content presented in this PPT design is completely editable. Download it and make adjustments in colour, background, font etc. as per your unique business setting.
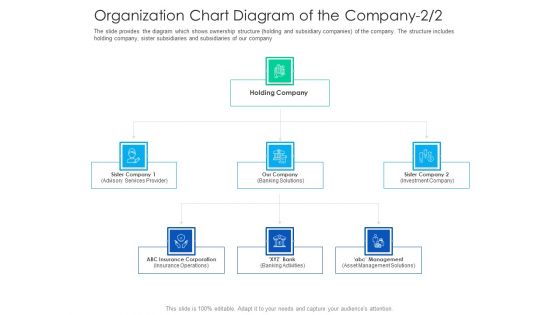
After Hours Trading Organization Chart Diagram Of The Company Holding Brochure PDF
This is a after hours trading organization chart diagram of the company holding brochure pdf template with various stages. Focus and dispense information on two stages using this creative set, that comes with editable features. It contains large content boxes to add your information on topics like organization chart diagram of the company. You can also showcase facts, figures, and other relevant content using this PPT layout. Grab it now.
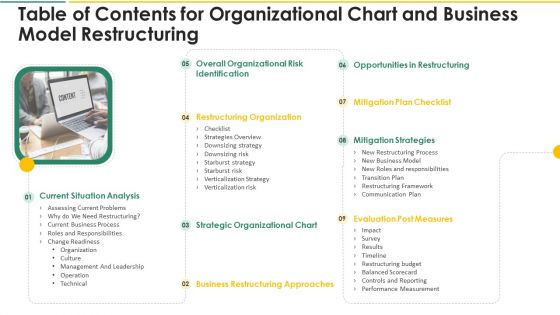
Table Of Contents For Organizational Chart And Business Model Restructuring Designs PDF
This is atable of contents for organizational chart and business model restructuring designs pdf template with various stages. Focus and dispense information on nine stages using this creative set, that comes with editable features. It contains large content boxes to add your information on topics like strategic organizational chart, business restructuring approaches, evaluation post measures, mitigation strategies, mitigation plan checklist. You can also showcase facts, figures, and other relevant content using this PPT layout. Grab it now.
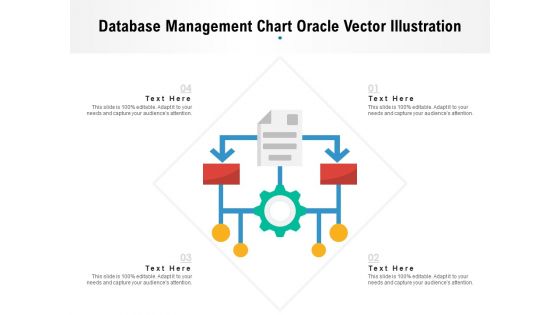
Database Management Chart Oracle Vector Illustration Ppt PowerPoint Presentation File Show PDF
This is a database management chart oracle vector illustration ppt powerpoint presentation file show pdf template with various stages. Focus and dispense information on four stages using this creative set, that comes with editable features. It contains large content boxes to add your information on topics like database management chart oracle vector illustration. You can also showcase facts, figures, and other relevant content using this PPT layout. Grab it now.

How Transform Segments Company Harmony And Achievement Organization Chart Rules PDF
This is a how transform segments company harmony and achievement organization chart rules pdf template with various stages. Focus and dispense information on five stages using this creative set, that comes with editable features. It contains large content boxes to add your information on topics like organization chart. You can also showcase facts, figures, and other relevant content using this PPT layout. Grab it now.
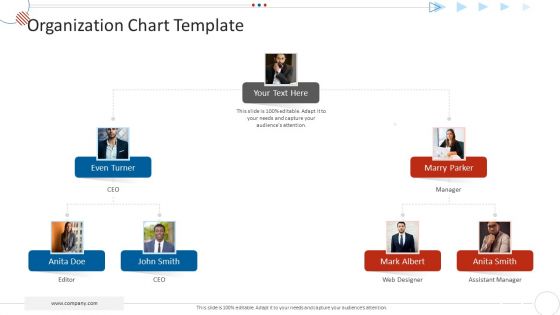
Mckinsey 7S Strategy Model For Project Management Organization Chart Template Guidelines PDF
This is a mckinsey 7s strategy model for project management organization chart template guidelines pdf template with various stages. Focus and dispense information on two stages using this creative set, that comes with editable features. It contains large content boxes to add your information on topics like organization chart template. You can also showcase facts, figures, and other relevant content using this PPT layout. Grab it now.
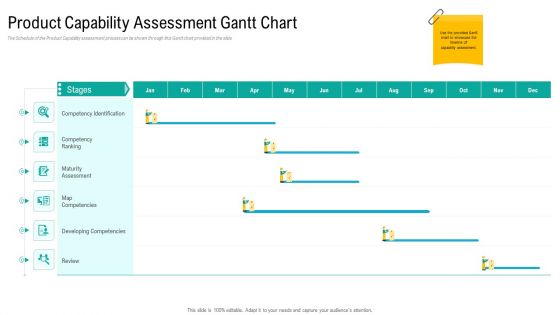
Product USP Product Capability Assessment Gantt Chart Ppt Infographics Pictures PDF
The Schedule of the Product Capability assessment process can be shown through this Gantt chart provided in the slide. Elucidate your project plan using our product usp product capability assessment gantt chart ppt infographics pictures pdf. Capture the timeframe for every release by outlining crucial details like project beginning and end date, status, and assigned team. Establish coordination with other team members, share your product plans, and discuss the project progress with the executives using this template. Furthermore, this task management chart helps you align your activities efficiently. Utilize the versatile nature of this template to initiate high-level resource planning and implement it flexibly for the benefit of your business. The slide is easy-to-edit so download it and schedule your projects resourcefully.
Issues And Impact Of Failure Mode And Effects Analysis Matrix Chart For FMEA Interpretation Icons PDF
This slide provides the matrix chart of potential severity and probability of occurrence to determine the high, medium and low priorities in order to take required actions.Deliver and pitch your topic in the best possible manner with this Issues And Impact Of Failure Mode And Effects Analysis Matrix Chart For FMEA Interpretation Icons PDF. Use them to share invaluable insights on Highest Priority, Medium Priority, Severity Occurrence and impress your audience. This template can be altered and modified as per your expectations. So, grab it now.
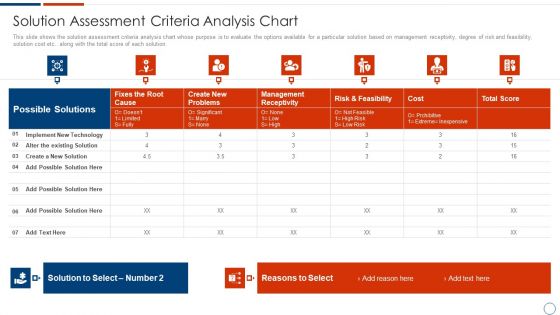
Solution Assessment And Validation To Determine Business Readiness Solution Assessment Criteria Analysis Chart Brochure PDF
This slide shows the solution assessment criteria analysis chart whose purpose is to evaluate the options available for a particular solution based on management receptivity, degree of risk and feasibility, solution cost etc. along with the total score of each solution. Deliver an awe inspiring pitch with this creative solution assessment and validation to determine business readiness solution assessment criteria analysis chart brochure pdf bundle. Topics like implement new technology, existing solution, possible solution can be discussed with this completely editable template. It is available for immediate download depending on the needs and requirements of the user.

Investor Pitch Stock Market Launch Financial Institutions Company Product Sales Forecast Chart Summary PDF
This slide shows the Product sales forecast table with Product names along with price per unit and total units sold for the current as well as the projected period till the year 2023. Deliver an awe inspiring pitch with this creative investor pitch stock market launch financial institutions company product sales forecast chart summary pdf bundle. Topics like company product sales forecast chart can be discussed with this completely editable template. It is available for immediate download depending on the needs and requirements of the user.

Raising Capital Banking Organizations Post Initial Public Offering Company Product Sales Forecast Chart Professional PDF
This slide shows the Product sales forecast table with Product names along with price per unit and total units sold for the current as well as the projected period till the year 2023. Deliver an awe inspiring pitch with this creative raising capital banking organizations post initial public offering company product sales forecast chart professional pdf bundle. Topics like company product sales forecast chart can be discussed with this completely editable template. It is available for immediate download depending on the needs and requirements of the user.
Three Column Chart Showing Icons Of Product Features Ppt PowerPoint Presentation Infographics Show PDF
Showcasing this set of slides titled three column chart showing icons of product features ppt powerpoint presentation infographics show pdf. The topics addressed in these templates are feature, product. All the content presented in this PPT design is completely editable. Download it and make adjustments in color, background, font etc. as per your unique business setting.
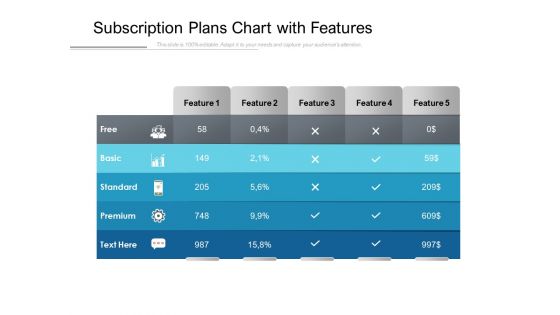
Subscription Plans Chart With Features Ppt PowerPoint Presentation Infographic Template Summary
Presenting this set of slides with name subscription plans chart with features ppt powerpoint presentation infographic template summary. The topics discussed in these slides are feature, free, basic, standard, premium. This is a completely editable PowerPoint presentation and is available for immediate download. Download now and impress your audience.

Chart Showing Products Features With Price Ppt PowerPoint Presentation Slides Infographic Template PDF
Presenting chart showing products features with price ppt powerpoint presentation slides infographic template pdf to dispense important information. This template comprises two stages. It also presents valuable insights into the topics including steps, calories and distance, basic features, exercise features, smart features. This is a completely customizable PowerPoint theme that can be put to use immediately. So, download it and address the topic impactfully.
Product Rate Chart With Features Ppt PowerPoint Presentation Icon Skills PDF
Presenting this set of slides with name product rate chart with features ppt powerpoint presentation icon skills pdf. The topics discussed in these slides are product characteristics, product range, details. This is a completely editable PowerPoint presentation and is available for immediate download. Download now and impress your audience.

Software Evaluation Chart With Features And Comments Ppt PowerPoint Presentation Ideas Microsoft
Presenting this set of slides with name software evaluation chart with features and comments ppt powerpoint presentation ideas microsoft. The topics discussed in these slides are software, cost, operating system, features, comments. This is a completely editable PowerPoint presentation and is available for immediate download. Download now and impress your audience.
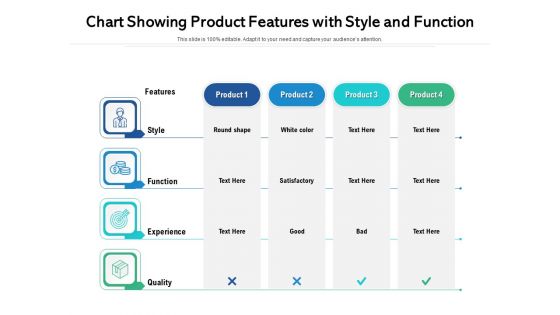
Chart Showing Product Features With Style And Function Ppt PowerPoint Presentation File Background Image PDF
Showcasing this set of slides titled chart showing product features with style and function ppt powerpoint presentation file background image pdf. The topics addressed in these templates are style, function, experience. All the content presented in this PPT design is completely editable. Download it and make adjustments in colour, background, font etc. as per your unique business setting.
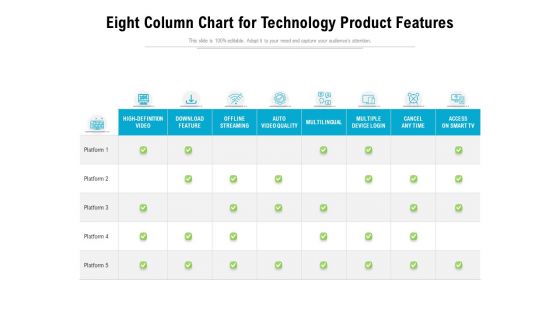
Eight Column Chart For Technology Product Features Ppt PowerPoint Presentation File Guide PDF
Showcasing this set of slides titled eight column chart for technology product features ppt powerpoint presentation file guide pdf. The topics addressed in these templates are multiple device login, access on smart tv, offline streaming. All the content presented in this PPT design is completely editable. Download it and make adjustments in colour, background, font etc. as per your unique business setting.

Impact Effort Grid Chart With Various Components Ppt PowerPoint Presentation Slides Example File PDF
Pitch your topic with ease and precision using this impact effort grid chart with various components ppt powerpoint presentation slides example file pdf. This layout presents information on conversion rate, impact component, excitement, implementation. It is also available for immediate download and adjustment. So, changes can be made in the color, design, graphics or any other component to create a unique layout.

Accounting Ratio Assessment Chart With Components Ppt PowerPoint Presentation Pictures Styles PDF
Presenting this set of slides with name accounting ratio assessment chart with components ppt powerpoint presentation pictures styles pdf. The topics discussed in these slides are profitability ratios, net profit margin, operating profit margin, return on assets, return of ordinary shareholders equity. This is a completely editable PowerPoint presentation and is available for immediate download. Download now and impress your audience.

Reinforcing Components Arrow Diagram Ppt Business Process Flow Chart Examples PowerPoint Templates
We present our reinforcing components arrow diagram ppt business process flow chart examples PowerPoint templates.Present our Marketing PowerPoint Templates because with the help of our Slides you can Illustrate these thoughts with this slide. Download our Business PowerPoint Templates because it will demonstrate the strength of character under severe stress. Shine the torch ahead and bring the light to shine on all. Download our Arrows PowerPoint Templates because our PowerPoint templates give this step by step process to acheive the aim. Use our Shapes PowerPoint Templates because you are the Champion of your team shall anoint. Use our Process and Flow PowerPoint Templates because you have configured your targets, identified your goals as per priority and importance.Use these PowerPoint slides for presentations relating to Arrow, Arrows, Block, Business, Chart, Design, Development, Diagram, Direction, Element, Flow, Flowchart, Graph, Linear, Management, Organization, Process, Program, Section, Sign, Solution, Symbol. The prominent colors used in the PowerPoint template are Green , Black, Gray. PowerPoint presentation experts tell us our reinforcing components arrow diagram ppt business process flow chart examples PowerPoint templates are Luxurious. Customers tell us our Block PowerPoint templates and PPT Slides are specially created by a professional team with vast experience. They diligently strive to come up with the right vehicle for your brilliant Ideas. Use our reinforcing components arrow diagram ppt business process flow chart examples PowerPoint templates are Majestic. Use our Diagram PowerPoint templates and PPT Slides are Liberated. We assure you our reinforcing components arrow diagram ppt business process flow chart examples PowerPoint templates are Ritzy. People tell us our Development PowerPoint templates and PPT Slides will save the presenter time.

Organizational Chart Global Consulting And Technology Services Company Profile CP SS V
This slide represents the organizational structure of Accenture which includes different groups such as CEO, group chief executive, chief officer ad chair officer.Welcome to our selection of the Organizational Chart Global Consulting And Technology Services Company Profile CP SS V. These are designed to help you showcase your creativity and bring your sphere to life. Planning and Innovation are essential for any business that is just starting out. This collection contains the designs that you need for your everyday presentations. All of our PowerPoints are 100 percent editable, so you can customize them to suit your needs. This multi-purpose template can be used in various situations. Grab these presentation templates today.
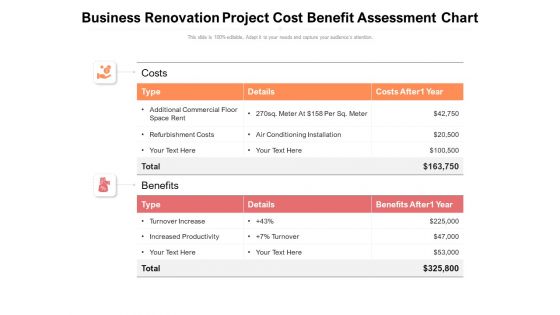
Business Renovation Project Cost Benefit Assessment Chart Ppt PowerPoint Presentation File Objects PDF
Presenting this set of slides with name business renovation project cost benefit assessment chart ppt powerpoint presentation file objects pdf. The topics discussed in these slides are costs, turnover increase, increased productivity, refurbishment costs, air conditioning installation. This is a completely editable PowerPoint presentation and is available for immediate download. Download now and impress your audience.

A Layout With Arrows Pointing To The Right Support Process Flow Chart PowerPoint Slides
We present our a layout with arrows pointing to the right support process flow chart PowerPoint Slides.Present our Leadership PowerPoint Templates because there is a vision, a need you can meet. Use our Busines PowerPoint Templates because you can asked to strive to give true form to your great dream. Use our Process and Flows PowerPoint Templates because you can Focus on each one and investigate which one would be the best fit for your needs. Use our Arrows PowerPoint Templates because with the help of our Slides you can Illustrate your plans on using the many social media modes available to inform soceity at large of the benefits of your product. Present our Shapes PowerPoint Templates because this one depicts the popular chart.Use these PowerPoint slides for presentations relating to Arrow, Arrows, Block, Business, Chart, Design, Development, Diagram, Direction, Element, Flow, Flowchart, Graph, Linear, Management, Organization, Process, Program, Section, Sign, Solution, Symbol. The prominent colors used in the PowerPoint template are Blue, Gray, Black. Customers tell us our a layout with arrows pointing to the right support process flow chart PowerPoint Slides are Chic. You can be sure our Diagram PowerPoint templates and PPT Slides are Fun. Presenters tell us our a layout with arrows pointing to the right support process flow chart PowerPoint Slides will save the presenter time. Professionals tell us our Direction PowerPoint templates and PPT Slides are aesthetically designed to attract attention. We guarantee that they will grab all the eyeballs you need. Presenters tell us our a layout with arrows pointing to the right support process flow chart PowerPoint Slides are Pleasant. Professionals tell us our Chart PowerPoint templates and PPT Slides are Versatile.
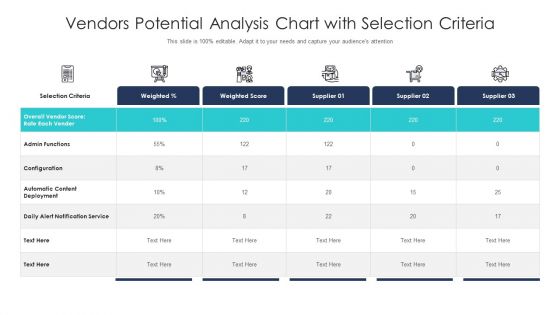
Vendors Potential Analysis Chart With Selection Criteria Ppt PowerPoint Presentation Layouts Clipart Images PDF
Showcasing this set of slides titled vendors potential analysis chart with selection criteria ppt powerpoint presentation layouts clipart images pdf. The topics addressed in these templates are automatic content deployment, daily alert notification service, configuration. All the content presented in this PPT design is completely editable. Download it and make adjustments in color, background, font etc. as per your unique business setting.
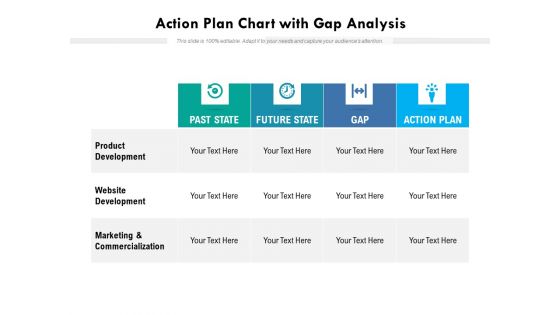
Action Plan Chart With Gap Analysis Ppt PowerPoint Presentation File Smartart PDF
Showcasing this set of slides titled action plan chart with gap analysis ppt powerpoint presentation file smartart pdf. The topics addressed in these templates are product development, website development, marketing and commercialization. All the content presented in this PPT design is completely editable. Download it and make adjustments in color, background, font etc. as per your unique business setting.
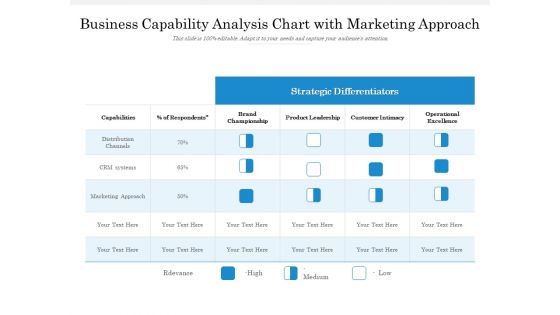
Business Capability Analysis Chart With Marketing Approach Ppt PowerPoint Presentation Gallery Microsoft PDF
Showcasing this set of slides titled business capability analysis chart with marketing approach ppt powerpoint presentation gallery microsoft pdf. The topics addressed in these templates are strategic, marketing, capabilities. All the content presented in this PPT design is completely editable. Download it and make adjustments in color, background, font etc. as per your unique business setting.
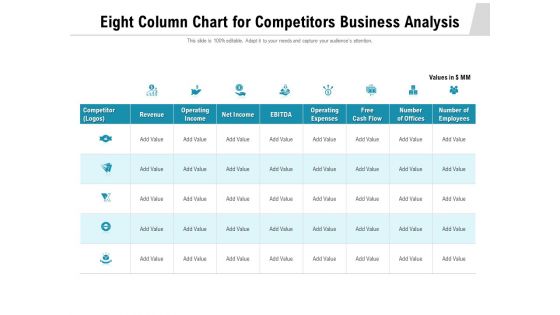
Eight Column Chart For Competitors Business Analysis Ppt PowerPoint Presentation Gallery Format PDF
Showcasing this set of slides titled eight column chart for competitors business analysis ppt powerpoint presentation gallery format pdf. The topics addressed in these templates are revenue, operating income, net income. All the content presented in this PPT design is completely editable. Download it and make adjustments in colour, background, font etc. as per your unique business setting.
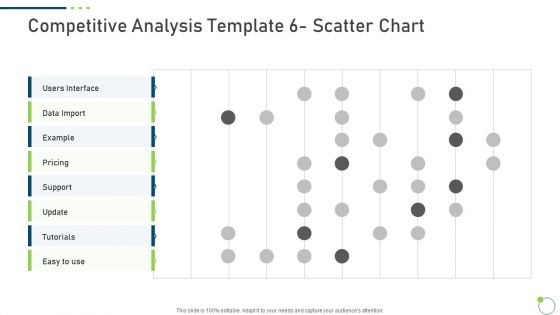
Investor Pitch Deck New Venture Capital Raising Competitive Analysis Template 6 Scatter Chart Data Sample PDF
Deliver and pitch your topic in the best possible manner with this investor pitch deck new venture capital raising competitive analysis template 6 scatter chart data sample pdf. Use them to share invaluable insights on pricing, tutorials, data import, support and impress your audience. This template can be altered and modified as per your expectations. So, grab it now.

Investor Pitch Deck New Venture Capital Raising Competitive Analysis Template 6 Scatter Chart Pricing Portrait PDF
Deliver an awe inspiring pitch with this creative investor pitch deck new venture capital raising competitive analysis template 6 scatter chart pricing portrait pdf bundle. Topics like pricing, tutorials, data import, support can be discussed with this completely editable template. It is available for immediate download depending on the needs and requirements of the user.
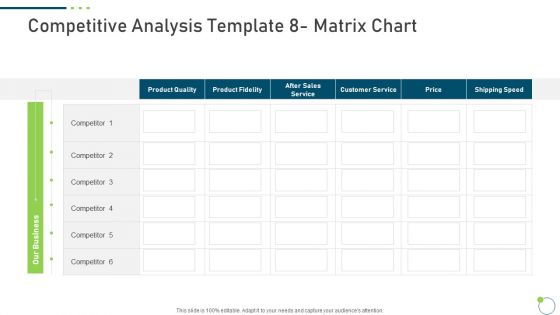
Investor Pitch Deck New Venture Capital Raising Competitive Analysis Template 8 Matrix Chart Inspiration PDF
Deliver and pitch your topic in the best possible manner with this investor pitch deck new venture capital raising competitive analysis template 8 matrix chart inspiration pdf. Use them to share invaluable insights on price, product fidelity, service, sales and impress your audience. This template can be altered and modified as per your expectations. So, grab it now.
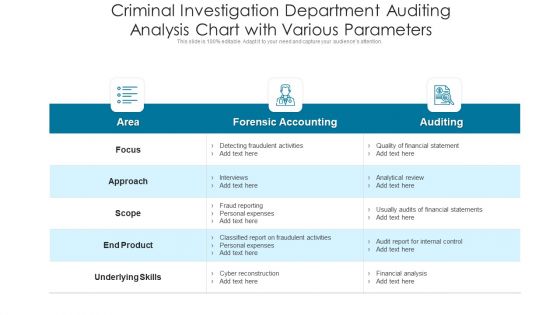
Criminal Investigation Department Auditing Analysis Chart With Various Parameters Ppt PowerPoint Presentation File Graphics Pictures PDF
Showcasing this set of slides titled criminal investigation department auditing analysis chart with various parameters ppt powerpoint presentation file graphics pictures pdf. The topics addressed in these templates are financial, analytical, expenses. All the content presented in this PPT design is completely editable. Download it and make adjustments in color, background, font etc. as per your unique business setting.

Vendors Analysis Chart With Types And Requirements Ppt PowerPoint Presentation Show Background Images PDF
Showcasing this set of slides titled vendors analysis chart with types and requirements ppt powerpoint presentation show background images pdf. The topics addressed in these templates are manufacture, service provider, minimum supplier requirement. All the content presented in this PPT design is completely editable. Download it and make adjustments in color, background, font etc. as per your unique business setting.
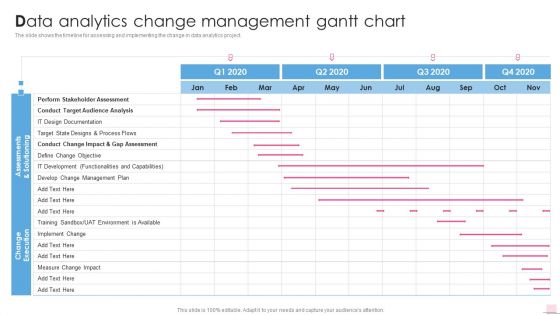
Data Analytics Change Management Gantt Chart Business Analysis Modification Toolkit Portrait PDF
Deliver an awe inspiring pitch with this creative Data Analytics Change Management Gantt Chart Business Analysis Modification Toolkit Portrait PDF bundle. Topics like Functionalities Capabilities, Environment Available, Implement Change can be discussed with this completely editable template. It is available for immediate download depending on the needs and requirements of the user.
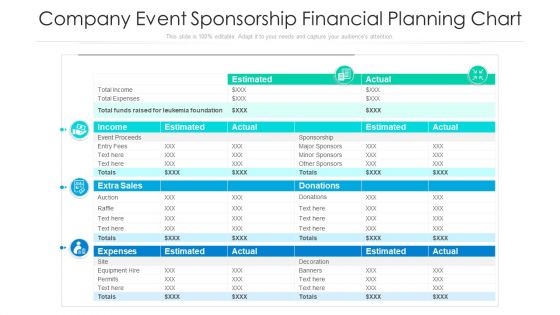
Company Event Sponsorship Financial Planning Chart Ppt PowerPoint Presentation File Example Introduction PDF
Showcasing this set of slides titled company event sponsorship financial planning chart ppt powerpoint presentation file example introduction pdf. The topics addressed in these templates are income, sales, expenses. All the content presented in this PPT design is completely editable. Download it and make adjustments in color, background, font etc. as per your unique business setting.
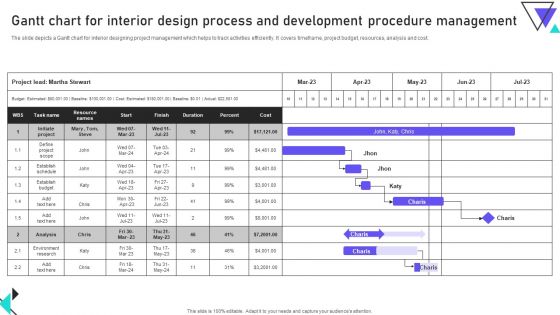
Gantt Chart For Interior Design Process And Development Procedure Management Diagrams PDF
The slide depicts a Gantt chart for interior designing project management which helps to track activities efficiently. It covers timeframe, project budget, resources, analysis and cost. Showcasing this set of slides titled Gantt Chart For Interior Design Process And Development Procedure Management Diagrams PDF. The topics addressed in these templates are Cost, Establish Budget, Development Procedure Management. All the content presented in this PPT design is completely editable. Download it and make adjustments in color, background, font etc. as per your unique business setting.

Various Companies Financial Ratio Evaluation Chart Ppt PowerPoint Presentation File Background Designs PDF
Showcasing this set of slides titled various companies financial ratio evaluation chart ppt powerpoint presentation file background designs pdf. The topics addressed in these templates are measurement, inventory turnover, debt ratio. All the content presented in this PPT design is completely editable. Download it and make adjustments in color, background, font etc. as per your unique business setting.

 Home
Home