Comparison Of 2 Years
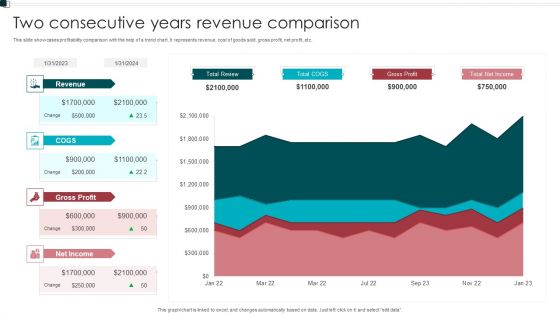
Two Consecutive Years Revenue Comparison Topics PDF
This slide showcases profitability comparison with the help of a trend chart. It represents revenue, cost of goods sold, gross profit, net profit, etc. Pitch your topic with ease and precision using this Two Consecutive Years Revenue Comparison Topics PDF. This layout presents information on Revenue, Gross Profit, Net Income. It is also available for immediate download and adjustment. So, changes can be made in the color, design, graphics or any other component to create a unique layout.

Before Vs After Two Years Comparison Charts PPT Sample SS
Retrieve professionally designed Before Vs After Two Years Comparison Charts PPT Sample SS to effectively convey your message and captivate your listeners. Save time by selecting pre-made slideshows that are appropriate for various topics, from business to educational purposes. These themes come in many different styles, from creative to corporate, and all of them are easily adjustable and can be edited quickly. Access them as PowerPoint templates or as Google Slides themes. You do not have to go on a hunt for the perfect presentation because Slidegeeks got you covered from everywhere.
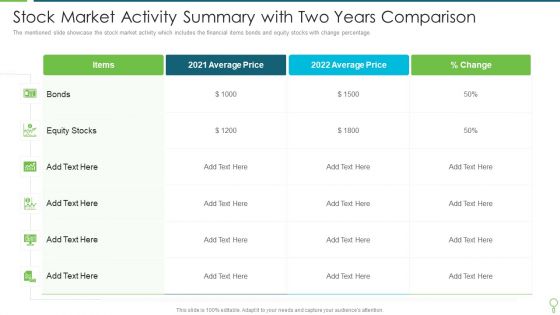
Stock Market Activity Summary With Two Years Comparison Infographics PDF
The mentioned slide showcase the stock market activity which includes the financial items bonds and equity stocks with change percentage. Pitch your topic with ease and precision using this Stock Market Activity Summary With Two Years Comparison Infographics PDF. This layout presents information on Average, Price, Equity Stocks. It is also available for immediate download and adjustment. So, changes can be made in the color, design, graphics or any other component to create a unique layout.
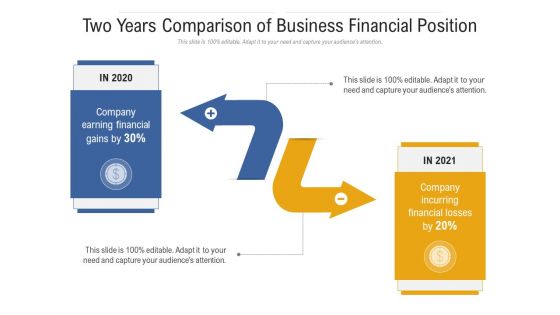
Two Years Comparison Of Business Financial Position Ppt PowerPoint Presentation Model Maker PDF
Presenting two years comparison of business financial position ppt powerpoint presentation model maker pdf to provide visual cues and insights. Share and navigate important information on two stages that need your due attention. This template can be used to pitch topics like company earning financial gains, company incurring financial losses, 2020 to 2021. In addtion, this PPT design contains high resolution images, graphics, etc, that are easily editable and available for immediate download.

2 Year Data Management Evolution Infographics PDF
This slide signifies the 2 year Evolution on data management. It comparison includes data system, governance, sourcing with vision. Showcasing this set of slides titled 2 Year Data Management Evolution Infographics PDF. The topics addressed in these templates are Data Sourcing, Governance, Data System. All the content presented in this PPT design is completely editable. Download it and make adjustments in color, background, font etc. as per your unique business setting.

Outsourcing Finance Accounting Processes Income Statement Analysis With Comparison For Two Years Template PDF
Presenting this set of slides with name outsourcing finance accounting processes income statement analysis with comparison for two years template pdf. The topics discussed in these slides are cost, expenses, administrative, gross profit, operating profit. This is a completely editable PowerPoint presentation and is available for immediate download. Download now and impress your audience.

Managing CFO Services Balance Sheet Analysis With Comparison For Two Years Formats PDF
Presenting this set of slides with name managing cfo services balance sheet analysis with comparison for two years formats pdf. The topics discussed in these slides are current assets, fixed assets, owners equity, equity share capital. This is a completely editable PowerPoint presentation and is available for immediate download. Download now and impress your audience.
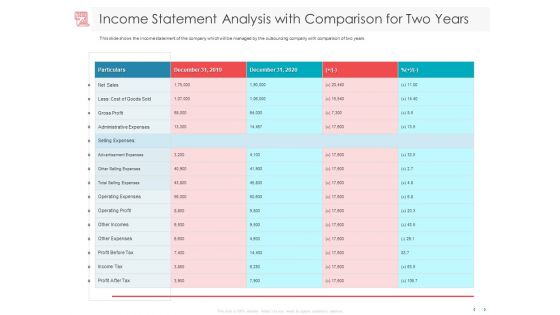
Managing CFO Services Income Statement Analysis With Comparison For Two Years Infographics PDF
Presenting this set of slides with name managing cfo services income statement analysis with comparison for two years infographics pdf. The topics discussed in these slides are net sales, gross profit, operating profit, income tax, operating expenses, administrative expenses, profit before tax. This is a completely editable PowerPoint presentation and is available for immediate download. Download now and impress your audience.
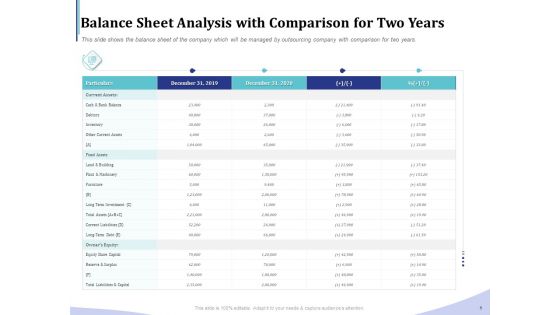
Accounting Bookkeeping Services Balance Sheet Analysis With Comparison For Two Years Mockup PDF
Presenting this set of slides with name accounting bookkeeping services balance sheet analysis with comparison for two years mockup pdf. The topics discussed in these slides are inventory, investment, equity, liabilities, current assets. This is a completely editable PowerPoint presentation and is available for immediate download. Download now and impress your audience.
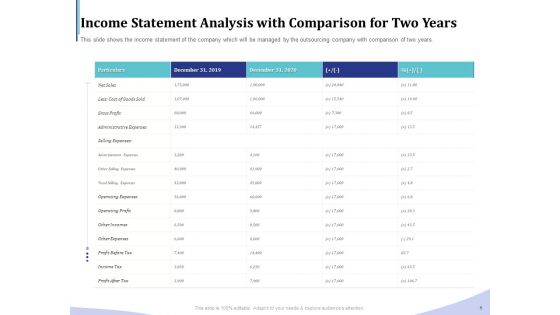
Accounting Bookkeeping Services Income Statement Analysis With Comparison For Two Years Rules PDF
Presenting this set of slides with name accounting bookkeeping services income statement analysis with comparison for two years rules pdf. The topics discussed in these slides are cost, expenses, administrative, gross profit, operating profit. This is a completely editable PowerPoint presentation and is available for immediate download. Download now and impress your audience.

BPO Managing Enterprise Financial Transactions Balance Sheet Analysis With Comparison For Two Years Rules PDF
Presenting this set of slides with name bpo managing enterprise financial transactions balance sheet analysis with comparison for two years rules pdf. The topics discussed in these slides are inventory, investment, equity, liabilities, current assets. This is a completely editable PowerPoint presentation and is available for immediate download. Download now and impress your audience.

BPO Managing Enterprise Financial Transactions Income Statement Analysis With Comparison For Two Years Ideas PDF
Presenting this set of slides with name bpo managing enterprise financial transactions income statement analysis with comparison for two years ideas pdf. The topics discussed in these slides are cost, expenses, administrative, gross profit, operating profit. This is a completely editable PowerPoint presentation and is available for immediate download. Download now and impress your audience.
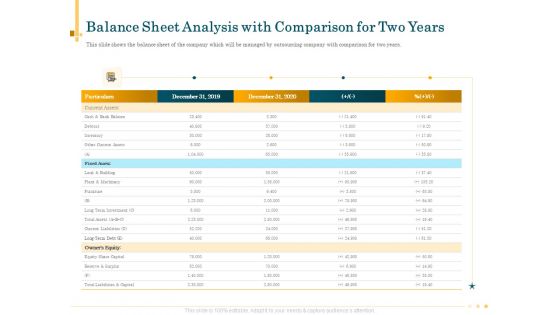
Outsource Bookkeeping Service Manage Financial Transactions Balance Sheet Analysis With Comparison For Two Years Rules PDF
Presenting this set of slides with name outsource bookkeeping service manage financial transactions balance sheet analysis with comparison for two years rules pdf. The topics discussed in these slides are inventory, investment, equity, liabilities, current assets. This is a completely editable PowerPoint presentation and is available for immediate download. Download now and impress your audience.

Outsource Bookkeeping Service Manage Financial Transactions Income Statement Analysis Comparison Two Years Mockup PDF
Presenting this set of slides with name outsource bookkeeping service manage financial transactions income statement analysis comparison two years mockup pdf. The topics discussed in these slides are cost, expenses, administrative, gross profit, operating profit. This is a completely editable PowerPoint presentation and is available for immediate download. Download now and impress your audience.
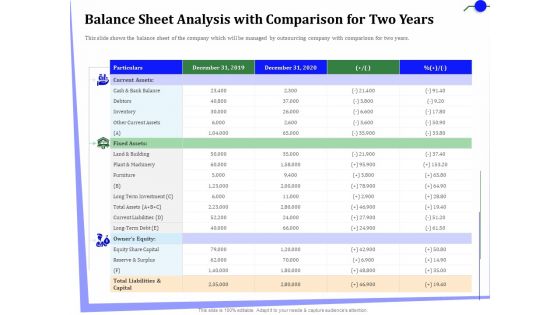
Outsourcing Finance Accounting Processes Balance Sheet Analysis With Comparison For Two Years Rules PDF
Presenting this set of slides with name outsourcing finance accounting processes balance sheet analysis with comparison for two years rules pdf. The topics discussed in these slides are inventory, investment, equity, liabilities, current assets. This is a completely editable PowerPoint presentation and is available for immediate download. Download now and impress your audience.

Property Investment Assessment Report Highlighting Two Years Comparison Ppt PowerPoint Presentation Inspiration Display PDF
Showcasing this set of slides titled property investment assessment report highlighting two years comparison ppt powerpoint presentation inspiration display pdf. The topics addressed in these templates are revenues, expenses, total revenues, total expenses, rental income, operating income, net income. All the content presented in this PPT design is completely editable. Download it and make adjustments in color, background, font etc. as per your unique business setting.

Year Over Year Revenue Growth Comparison Diagrams PDF
The given slide depicts the year over year comparison of quarterly revenue growth between two years, especially with the sources of revenue in order to track the profitability and incurring losses in the business. Showcasing this set of slides titled Year Over Year Revenue Growth Comparison Diagrams PDF. The topics addressed in these templates are Year Over Year, Revenue Growth, Comparison. All the content presented in this PPT design is completely editable. Download it and make adjustments in color, background, font etc. as per your unique business setting.

2 Year Evolution On Strategic Planning Process Slides PDF
This slide represents the 2 year Evolution on outlining strategic process. It comparison current and future mode of operations, design and service management. Showcasing this set of slides titled 2 Year Evolution On Strategic Planning Process Slides PDF. The topics addressed in these templates are Service Management, Enterprise Information Management. All the content presented in this PPT design is completely editable. Download it and make adjustments in color, background, font etc. as per your unique business setting.
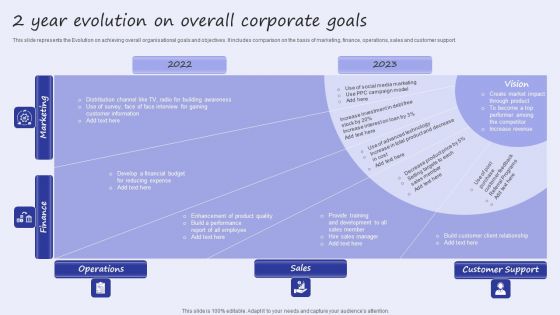
2 Year Evolution On Overall Corporate Goals Template PDF
This slide represents the Evolution on achieving overall organisational goals and objectives. It includes comparison on the basis of marketing, finance, operations, sales and customer support. Pitch your topic with ease and precision using this 2 Year Evolution On Overall Corporate Goals Template PDF. This layout presents information on Finance, Operations, Customer Support. It is also available for immediate download and adjustment. So, changes can be made in the color, design, graphics or any other component to create a unique layout.
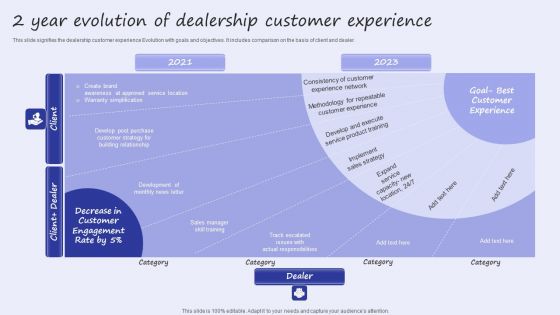
2 Year Evolution Of Dealership Customer Experience Slides PDF
This slide signifies the dealership customer experience Evolution with goals and objectives. It includes comparison on the basis of client and dealer. Showcasing this set of slides titled 2 Year Evolution Of Dealership Customer Experience Slides PDF. The topics addressed in these templates are Client Dealer, Best Customer Experience. All the content presented in this PPT design is completely editable. Download it and make adjustments in color, background, font etc. as per your unique business setting.
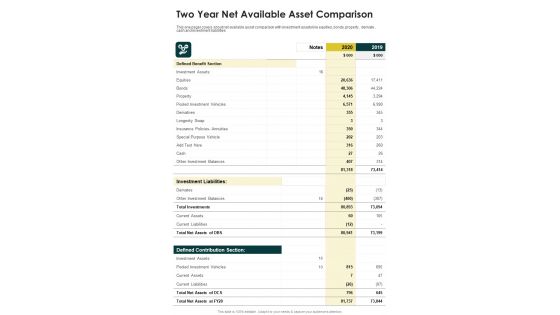
Two Year Net Available Asset Comparison One Pager Documents
This one pager covers about net available asset comparison with investment assets like equities ,bonds, property , derivate , cash and investment liabilities. Presenting you a fantastic Two Year Net Available Asset Comparison One Pager Documents. This piece is crafted on hours of research and professional design efforts to ensure you have the best resource. It is completely editable and its design allow you to rehash its elements to suit your needs. Get this Two Year Net Available Asset Comparison One Pager Documents A4 One-pager now.
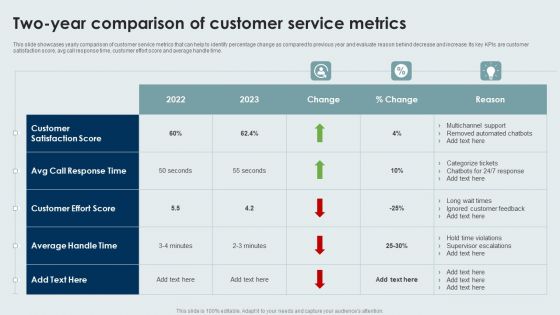
Two Year Comparison Of Customer Service Metrics Information PDF
This slide showcases yearly comparison of customer service metrics that can help to identify percentage change as compared to previous year and evaluate reason behind decrease and increase. Its key KPIs are customer satisfaction score, avg call response time, customer effort score and average handle time. Pitch your topic with ease and precision using this Two Year Comparison Of Customer Service Metrics Information PDF. This layout presents information on Customer Effort Score, Customer Satisfaction Score, Average Handle Time. It is also available for immediate download and adjustment. So, changes can be made in the color, design, graphics or any other component to create a unique layout.
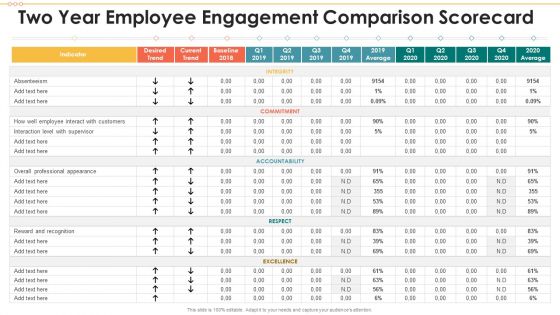
Two Year Employee Engagement Comparison Scorecard Designs PDF
Deliver an awe inspiring pitch with this creative Two Year Employee Engagement Comparison Scorecard Designs PDF bundle. Topics like Employee Interact, Professional Appearance, Reward And Recognition can be discussed with this completely editable template. It is available for immediate download depending on the needs and requirements of the user.
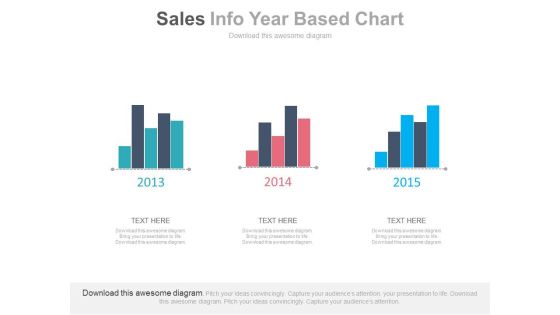
Three Years Sales Data Bar Graph Powerpoint Slides
This PowerPoint template has been designed with bar charts. This business slide may be used to display three years sales data for comparison. Present your views and ideas with this impressive design.
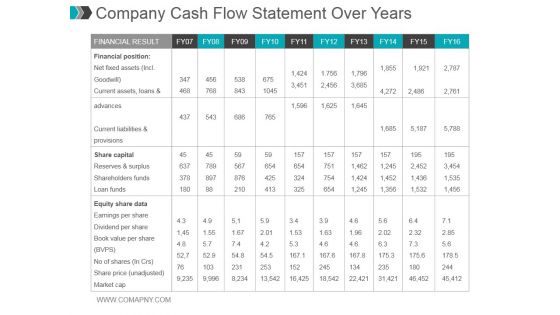
Company Cash Flow Statement Over Years Ppt PowerPoint Presentation Gallery
This is a company cash flow statement over years ppt powerpoint presentation gallery. This is ten stage process. The stages in this process are financial result, financial position, share capital, equity share data.

Comparative Financial Business Forecast For Two Years Topics PDF
This slide shows business financial plan for two years to track progress in business. It include various parameters such as gross revenue, gross profit, profit before taxes and net profit etc. Persuade your audience using this Comparative Financial Business Forecast For Two Years Topics PDF. This PPT design covers one stage, thus making it a great tool to use. It also caters to a variety of topics including Sales General And Administration, Profit Before Taxes. Download this PPT design now to present a convincing pitch that not only emphasizes the topic but also showcases your presentation skills.
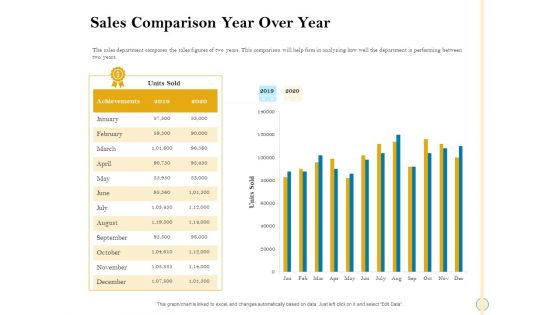
Sales Optimization Best Practices To Close More Deals Sales Comparison Year Over Year Structure PDF
The sales department compares the sales figures of two years. This comparison will help firm in analyzing how well the department is performing between two years. Deliver an awe inspiring pitch with this creative sales optimization best practices to close more deals sales comparison year over year structure pdf bundle. Topics like sales comparison year over year can be discussed with this completely editable template. It is available for immediate download depending on the needs and requirements of the user.

Sales Department Strategies Increase Revenues Sales Comparison Year Over Year Infographics PDF
The sales department compares the sales figures of two years. This comparison will help firm in analyzing how well the department is performing between two years. Deliver an awe-inspiring pitch with this creative sales department strategies increase revenues sales comparison year over year infographics pdf bundle. Topics like sales comparison year over year can be discussed with this completely editable template. It is available for immediate download depending on the needs and requirements of the user.
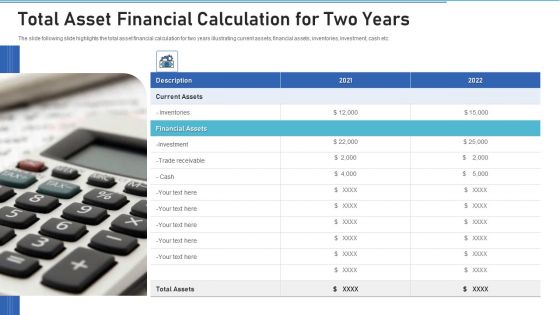
Total Asset Financial Calculation For Two Years Demonstration PDF
Pitch your topic with ease and precision using this total asset financial calculation for two years demonstration pdf. This layout presents information on investment, financial assets, inventories. It is also available for immediate download and adjustment. So, changes can be made in the color, design, graphics or any other component to create a unique layout.

Trend Analysis Yearly Comparison Ppt Powerpoint Presentation Professional Example
This is a trend analysis yearly comparison ppt powerpoint presentation professional example. This is a two stage process. The stages in this process are finance, marketing, management, investment, analysis.

Trend Analysis Yearly Comparison Ppt PowerPoint Presentation Summary Visual Aids
This is a trend analysis yearly comparison ppt powerpoint presentation summary visual aids. This is a two stage process. The stages in this process are finance, strategy, marketing, management, business.

Comparison Ppt PowerPoint Presentation Guide
This is a comparison ppt powerpoint presentation guide. This is a two stage process. The stages in this process are business, marketing, year, finance, percentage.

Comparison Yearly Operating Plan Ppt PowerPoint Presentation Professional Model
This is a comparison yearly operating plan ppt powerpoint presentation professional model. This is a two stage process. The stages in this process are business, management, strategy, analysis, icons.
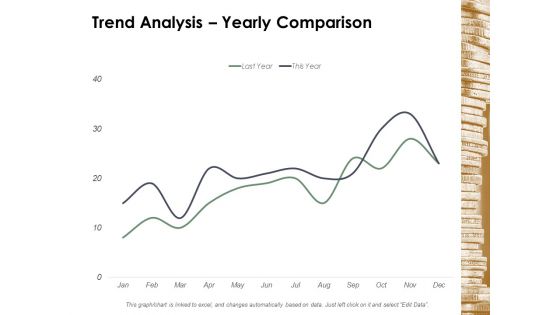
Trend Analysis Yearly Comparison Ppt Powerpoint Presentation Professional Show
This is a trend analysis yearly comparison ppt powerpoint presentation professional show. This is a two stage process. The stages in this process are finance, marketing, management, investment, analysis.

Trend Analysis Yearly Comparison Ppt Powerpoint Presentation Layouts Slideshow
This is a trend analysis yearly comparison ppt powerpoint presentation layouts slideshow. This is a two stage process. The stages in this process are finance, marketing, management, investment, analysis.
Chart Illustrating Two Year Comparison Of Business Data Icon Ppt Outline Example Topics PDF
Persuade your audience using this Chart Illustrating Two Year Comparison Of Business Data Icon Ppt Outline Example Topics PDF. This PPT design covers three stages, thus making it a great tool to use. It also caters to a variety of topics including chart illustrating two year comparison of business data icon. Download this PPT design now to present a convincing pitch that not only emphasizes the topic but also showcases your presentation skills.
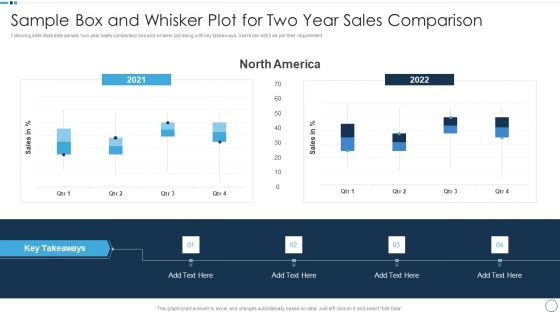
QA Plan Set 1 Sample Box And Whisker Plot For Two Year Sales Comparison Themes PDF
Following slide illustrates sample two year sales comparison box and whisker plot along with key takeaways. Users can edit it as per their requirement. Deliver and pitch your topic in the best possible manner with this QA Plan Set 1 Sample Box And Whisker Plot For Two Year Sales Comparison Themes PDF. Use them to share invaluable insights on Sales Comparison and impress your audience. This template can be altered and modified as per your expectations. So, grab it now.

Two Year Comparison Of Income And Cash Flow Statement Of Manufacturing Company Demonstration PDF
This slide covers cash flow, profit and loss statements of two years of manufacturing plant. It includes comparative assessment of income, cost of goods, expenses, net earnings, depreciations, etc. Pitch your topic with ease and precision using this Two Year Comparison Of Income And Cash Flow Statement Of Manufacturing Company Demonstration PDF. This layout presents information on Cost Goods, Income, Cash Flow, Net Income. It is also available for immediate download and adjustment. So, changes can be made in the color, design, graphics or any other component to create a unique layout.

M Banking System Improving Consumer Five Year Comparison Of Registered Mobile Money Topics PDF
This slide shows the information statistics about region-wise registered mobile money customers spread during last 5 years. It indicates that customers spread in South Asia recorded highest that is 28.4 percent over the last five years. This is a m banking system improving consumer five year comparison of registered mobile money topics pdf template with various stages. Focus and dispense information on one stages using this creative set, that comes with editable features. It contains large content boxes to add your information on topics like total accounts, customers spread, mobile money. You can also showcase facts, figures, and other relevant content using this PPT layout. Grab it now.
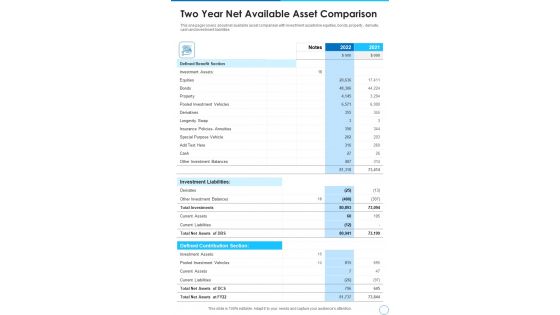
Two Year Net Available Asset Comparison Template 139 One Pager Documents
Presenting you a fantastic Two Year Net Available Asset Comparison Template 139 One Pager Documents. This piece is crafted on hours of research and professional design efforts to ensure you have the best resource. It is completely editable and its design allow you to rehash its elements to suit your needs. Get this Two Year Net Available Asset Comparison Template 139 One Pager Documents A4 One-pager now.
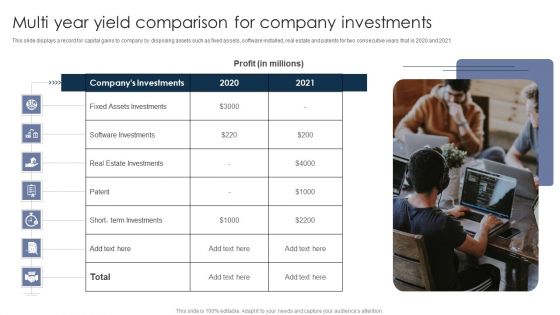
Multi Year Yield Comparison For Company Investments Ppt PowerPoint Presentation Pictures Layouts PDF
This slide displays a record for capital gains to company by disposing assets such as fixed assets, software installed, real estate and patents for two consecutive years that is 2020 and 2021.Presenting Multi Year Yield Comparison For Company Investments Ppt PowerPoint Presentation Pictures Layouts PDF to dispense important information. This template comprises one stage. It also presents valuable insights into the topics including Assets Investments, Estate Investments, Term Investments. This is a completely customizable PowerPoint theme that can be put to use immediately. So, download it and address the topic impactfully.
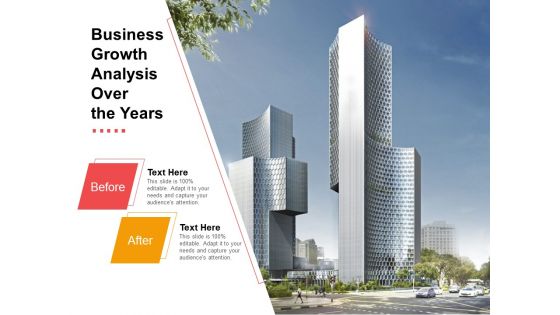
Business Growth Analysis Over The Years Ppt PowerPoint Presentation Outline Templates
This is a business growth analysis over the years ppt powerpoint presentation outline templates. This is a two stage process. The stages in this process are before vs after, comparison, compare.
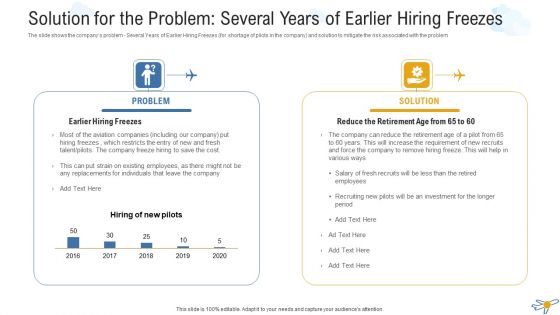
Solution For The Problem Several Years Of Earlier Hiring Freezes Information PDF
The slide shows the companys problem Several Years of Earlier Hiring Freezes for shortage of pilots in the company and solution to mitigate the risk associated with the problem. This is a solution for the problem several years of earlier hiring freezes information pdf template with various stages. Focus and dispense information on two stages using this creative set, that comes with editable features. It contains large content boxes to add your information on topics like problem, solution. You can also showcase facts, figures, and other relevant content using this PPT layout. Grab it now.
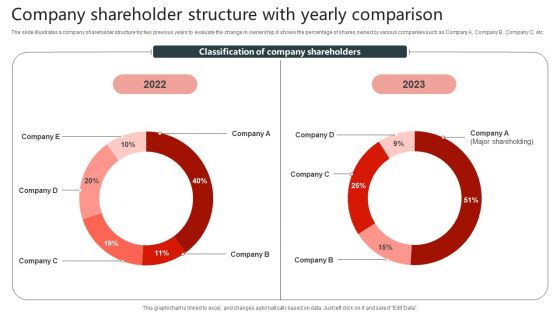
Company Shareholder Structure With Yearly Comparison Infographics PDF
The slide illustrates a company shareholder structure for two previous years to evaluate the change in ownership. It shows the percentage of shares owned by various companies such as Company A, Company B, Company C, etc. Pitch your topic with ease and precision using this Company Shareholder Structure With Yearly Comparison Infographics PDF. This layout presents information on Structure With Yearly Comparison, Company Shareholder. It is also available for immediate download and adjustment. So, changes can be made in the color, design, graphics or any other component to create a unique layout.
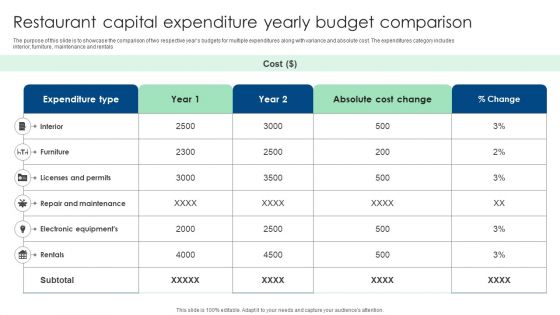
Restaurant Capital Expenditure Yearly Budget Comparison Ppt Professional Guide PDF
The purpose of this slide is to showcase the comparison of two respective years budgets for multiple expenditures along with variance and absolute cost. The expenditures category includes interior, furniture, maintenance and rentals. Showcasing this set of slides titled Restaurant Capital Expenditure Yearly Budget Comparison Ppt Professional Guide PDF. The topics addressed in these templates are Expenditure Type, Licenses And Permits, Absolute Cost Change. All the content presented in this PPT design is completely editable. Download it and make adjustments in color, background, font etc. as per your unique business setting.
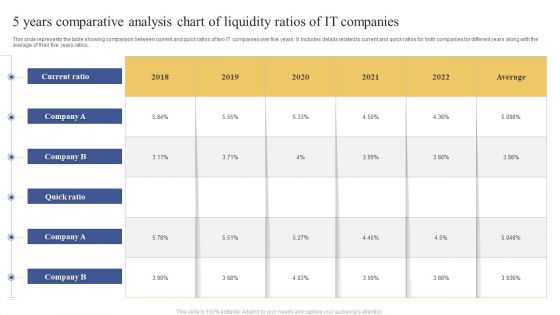
5 Years Comparative Analysis Chart Of Liquidity Ratios Of IT Companies Ppt Portfolio Visual Aids PDF
This slide represents the table showing comparison between current and quick ratios of two IT companies over five years. It includes details related to current and quick ratios for both companies for different years along with the average of their five years ratios. Pitch your topic with ease and precision using this 5 Years Comparative Analysis Chart Of Liquidity Ratios Of IT Companies Ppt Portfolio Visual Aids PDF. This layout presents information on Current Ratio, Average, 2018 To 2022. It is also available for immediate download and adjustment. So, changes can be made in the color, design, graphics or any other component to create a unique layout.

Yearly Selling Forecasts Comparison And IT Store Demonstration PDF
This slide covers two year sales projections for an IT retail store. It includes projections based on per unit sales, prices and overall sale of products and services for systems, services, software, training, etc. Showcasing this set of slides titled Yearly Selling Forecasts Comparison And IT Store Demonstration PDF. The topics addressed in these templates are Service, Sales Per Unit, Price Per Unit. All the content presented in this PPT design is completely editable. Download it and make adjustments in color, background, font etc. as per your unique business setting.
5 Years Revenue Comparative Analysis Chart Icon Ppt Inspiration Diagrams PDF
Presenting 5 Years Revenue Comparative Analysis Chart Icon Ppt Inspiration Diagrams PDF to dispense important information. This template comprises three stages. It also presents valuable insights into the topics including 5 Years, Revenue Comparative, Analysis Chart, Icon. This is a completely customizable PowerPoint theme that can be put to use immediately. So, download it and address the topic impactfully.
5 Years Mutual Funds Performance Comparative Analysis Chart Icon Ppt Show Gridlines PDF
Persuade your audience using this 5 Years Mutual Funds Performance Comparative Analysis Chart Icon Ppt Show Gridlines PDF. This PPT design covers three stages, thus making it a great tool to use. It also caters to a variety of topics including 5 Years, Mutual Funds, Performance Comparative, Analysis, Chart Icon. Download this PPT design now to present a convincing pitch that not only emphasizes the topic but also showcases your presentation skills.
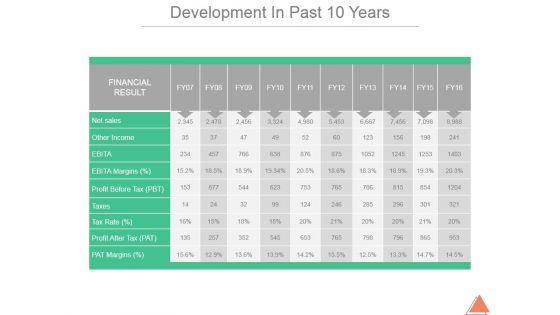
Development In Past 10 Years Template 1 Ppt PowerPoint Presentation Infographics
This is a development in past 10 years template 1 ppt powerpoint presentation infographics. This is a ten stage process. The stages in this process are net sales, other income, ebita margins, profit before tax, taxes.

Pre Seed Funding Pitch Deck Income Statement Projection For Next Five Years Professional PDF
The slide provides the forecast of companys income statement for next 5 years. Key financials include Revenue, cost of sale, gross profit or margin, operating expenses, operating and net income etc. This is a pre seed funding pitch deck income statement projection for next five years professional pdf template with various stages. Focus and dispense information on five stages using this creative set, that comes with editable features. It contains large content boxes to add your information on topics like revenue, cost, sales, marketing, finance. You can also showcase facts, figures, and other relevant content using this PPT layout. Grab it now.
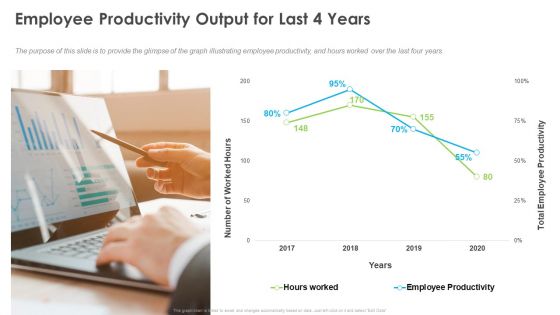
Outstanding Employee Employee Productivity Output For Last 4 Years Guidelines PDF
The purpose of this slide is to provide the glimpse of the graph illustrating employee productivity, and hours worked over the last four years. This is a outstanding employee employee productivity output for last 4 years guidelines pdf template with various stages. Focus and dispense information on one stage using this creative set, that comes with editable features. It contains large content boxes to add your information on topics like employee productivity, worked hours. You can also showcase facts, figures, and other relevant content using this PPT layout. Grab it now.
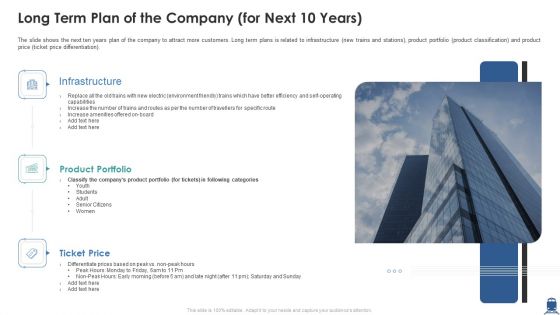
Long Term Plan Of The Company For Next 10 Years Ppt Ideas PDF
The slide shows the next ten years plan of the company to attract more customers. Long term plans is related to infrastructure new trains and stations, product portfolio product classification and product price ticket price differentiation. This is a long term plan of the company for next 10 years ppt ideas pdf template with various stages. Focus and dispense information on three stages using this creative set, that comes with editable features. It contains large content boxes to add your information on topics like infrastructure, product portfolio, capabilities. You can also showcase facts, figures, and other relevant content using this PPT layout. Grab it now.
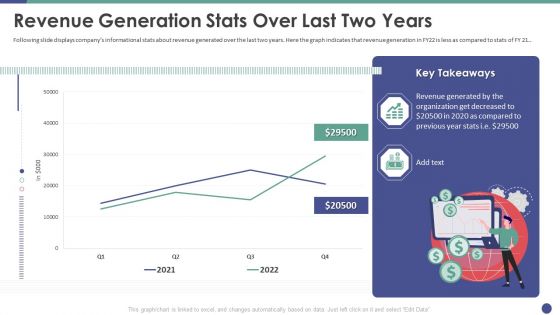
QC Engineering Revenue Generation Stats Over Last Two Years Ppt Portfolio Graphics Tutorials PDF
Following slide displays companys informational stats about revenue generated over the last two years. Here the graph indicates that revenue generation in FY22 is less as compared to stats of FY21. Deliver an awe inspiring pitch with this creative qc engineering revenue generation stats over last two years ppt portfolio graphics tutorials pdf bundle. Topics like revenue generation stats over last two years can be discussed with this completely editable template. It is available for immediate download depending on the needs and requirements of the user.
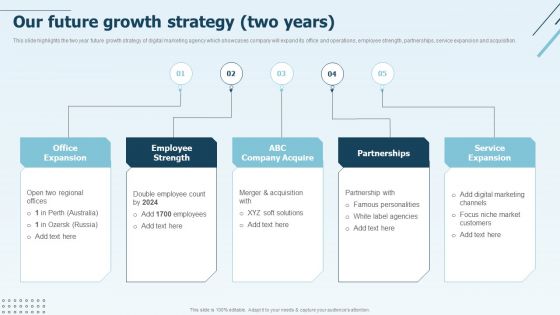
Digital Marketing Company Profile Our Future Growth Strategy Two Years Template PDF
This slide highlights the two year future growth strategy of digital marketing agency which showcases company will expand its office and operations, employee strength, partnerships, service expansion and acquisition.This is a Digital Marketing Company Profile Our Future Growth Strategy Two Years Template PDF template with various stages. Focus and dispense information on five stages using this creative set, that comes with editable features. It contains large content boxes to add your information on topics like Service Expansion, Partnerships Employee, Strength. You can also showcase facts, figures, and other relevant content using this PPT layout. Grab it now.
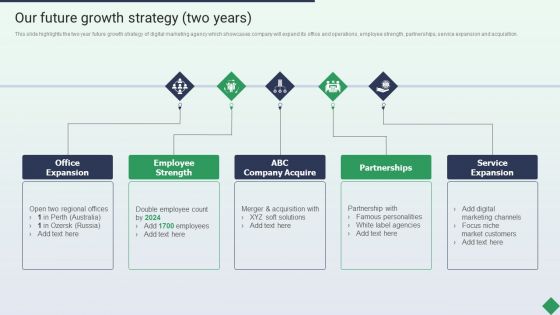
Website Marketing Enterprise Profile Our Future Growth Strategy Two Years Ppt PowerPoint Presentation Gallery Tips PDF
This slide highlights the two year future growth strategy of digital marketing agency which showcases company will expand its office and operations, employee strength, partnerships, service expansion and acquisition.This is a Website Marketing Enterprise Profile Our Future Growth Strategy Two Years Ppt PowerPoint Presentation Gallery Tips PDF template with various stages. Focus and dispense information on five stages using this creative set, that comes with editable features. It contains large content boxes to add your information on topics like Office Expansion, Employee Strength, Company Acquire. You can also showcase facts, figures, and other relevant content using this PPT layout. Grab it now.
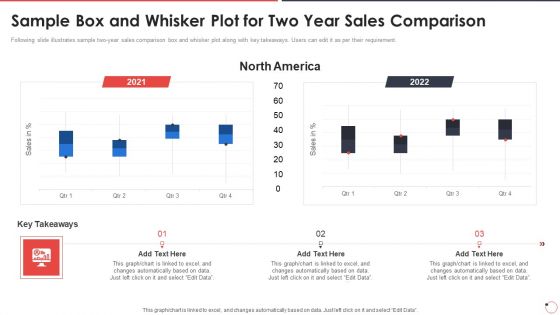
Quality Assurance Templates Set 1 Sample Box And Whisker Plot For Two Year Sales Comparison Ppt Slides Visual Aids PDF

Collection Of Quality Assurance PPT Sample Box And Whisker Plot For Two Year Sales Comparison Elements PDF
Following slide illustrates sample two to year sales comparison box and whisker plot along with key takeaways. Users can edit it as per their requirement. Deliver an awe inspiring pitch with this creative collection of quality assurance ppt sample box and whisker plot for two year sales comparison elements pdf bundle. Topics like graph, data can be discussed with this completely editable template. It is available for immediate download depending on the needs and requirements of the user.

Comparison Ppt PowerPoint Presentation Styles Graphics Example
This is a comparison ppt powerpoint presentation styles graphics example. This is a two stage process. The stages in this process are year, comparison, technology, mobile, million.
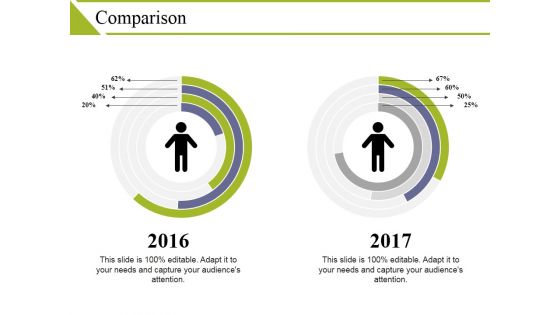
Comparison Ppt PowerPoint Presentation Pictures Objects
This is a comparison ppt powerpoint presentation pictures objects. This is a two stage process. The stages in this process are comparison, percentage, year, business, marketing.

 Home
Home