Comparison Chart

Spider Chart Business Management Ppt PowerPoint Presentation Complete Deck
Boost your confidence and team morale with this well-structured spider chart business management ppt powerpoint presentation complete deck. This prefabricated set gives a voice to your presentation because of its well-researched content and graphics. Our experts have added all the components very carefully, thus helping you deliver great presentations with a single click. Not only that, it contains a set of twelve slides that are designed using the right visuals, graphics, etc. Various topics can be discussed, and effective brainstorming sessions can be conducted using the wide variety of slides added in this complete deck. Apart from this, our PPT design contains clear instructions to help you restructure your presentations and create multiple variations. The color, format, design anything can be modified as deemed fit by the user. Not only this, it is available for immediate download. So, grab it now.

Procedure Chart Ppt PowerPoint Presentation Complete With Slides
Boost your confidence and team morale with this well-structured Procedure Chart Ppt PowerPoint Presentation Complete With Slides. This prefabricated set gives a voice to your presentation because of its well-researched content and graphics. Our experts have added all the components very carefully, thus helping you deliver great presentations with a single click. Not only that, it contains a set of twelve slides that are designed using the right visuals, graphics, etc. Various topics can be discussed, and effective brainstorming sessions can be conducted using the wide variety of slides added in this complete deck. Apart from this, our PPT design contains clear instructions to help you restructure your presentations and create multiple variations. The color, format, design anything can be modified as deemed fit by the user. Not only this, it is available for immediate download. So, grab it now.
Linear Chart Ppt PowerPoint Presentation Complete Deck With Slides
Boost your confidence and team morale with this well-structured Linear Chart Ppt PowerPoint Presentation Complete Deck With Slides. This prefabricated set gives a voice to your presentation because of its well-researched content and graphics. Our experts have added all the components very carefully, thus helping you deliver great presentations with a single click. Not only that, it contains a set of forteen slides that are designed using the right visuals, graphics, etc. Various topics can be discussed, and effective brainstorming sessions can be conducted using the wide variety of slides added in this complete deck. Apart from this, our PPT design contains clear instructions to help you restructure your presentations and create multiple variations. The color, format, design anything can be modified as deemed fit by the user. Not only this, it is available for immediate download. So, grab it now.

Benefits Cost Analysis Chart Ppt Powerpoint Presentation Summary Visuals
This is a balance scale with cost and benefits ppt powerpoint presentation show. This is a two stage process. The stages in this process are business, finance, marketing, strategy, compare, management.

Circle Chart For Financial Planning Process PowerPoint Slides
This PowerPoint template has been created by professionals keeping in mind the need of light slides with more information. The slide uses minimalistic yet impactful visuals to explain a 4 step process. The reducing size of the circles can be creatively used to show that the process or the steps are getting an organization or a business firm closer to its targets or goals. There is ample space available to write text describe the steps involved in the process. This can be an ideal presentation for a company to show its financial plan or sales strategy to its investors or clients to gain their confidence. The icons and colors of the slide are customizable and can be edited to match the theme of the slide or the topic of the presentation.
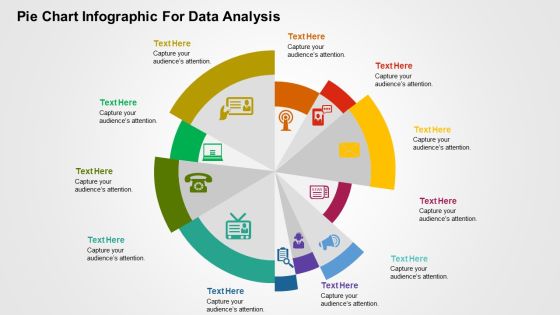
Pie Chart Infographic For Data Analysis PowerPoint Templates
This is one of the most downloaded PowerPoint template. This slide can be used for various purposes and to explain a number of processes. This can be included in your presentation to explain each step of a process and even include its relevance and importance in a single diagram. Using the uneven circular structure of the pie chart, the presenter can also explain random steps or highlight particular steps of process or parts of an organization or business that need special attention of any kind to the audience. Additionally, you can use this slide to show a transformation process or highlight key features of a product.

Strategic Chart Ppt PowerPoint Presentation Complete Deck With Slides
Induce strategic thinking by presenting this complete deck. Enthrall your audience by deploying this thought provoking PPT deck. It can be downloaded in both standard and widescreen aspect ratios, thus making it a complete package to use and deploy. Convey your thoughts and actions using the thirteen slides presented in this complete deck. Additionally, feel free to alter its components like color, graphics, design, etc, to create a great first impression. Grab it now by clicking on the download button below.

Implementations Deployment Strategies Comparisons Themes PDF
This slide shows the comparison of deployment strategies on different bases. Deliver an awe-inspiring pitch with this creative implementations deployment strategies comparisons themes pdf bundle. Topics like strategy, targeted users, cloud cost can be discussed with this completely editable template. It is available for immediate download depending on the needs and requirements of the user.
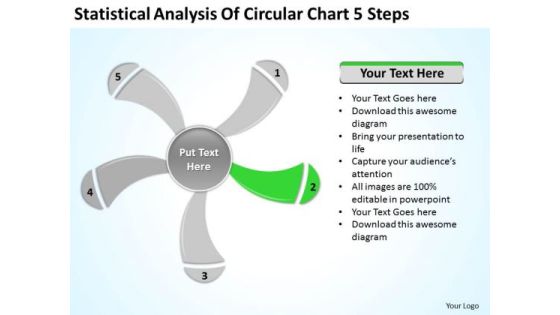
Statistical Analysis Of Circular Chart 5 Steps Ppt Business Plan PowerPoint Slide
We present our statistical analysis of circular chart 5 steps ppt business plan PowerPoint Slide.Download and present our Business PowerPoint Templates because Our PowerPoint Templates and Slides will definately Enhance the stature of your presentation. Adorn the beauty of your thoughts with their colourful backgrounds. Use our Signs PowerPoint Templates because Our PowerPoint Templates and Slides will give good value for money. They also have respect for the value of your time. Download our Shapes PowerPoint Templates because Our PowerPoint Templates and Slides team portray an attitude of elegance. Personify this quality by using them regularly. Use our Metaphors-Visual Concepts PowerPoint Templates because Our PowerPoint Templates and Slides will effectively help you save your valuable time. They are readymade to fit into any presentation structure. Use our Process and Flows PowerPoint Templates because our PowerPoint Templates and Slides are the string of your bow. Fire of your ideas and conquer the podium.Use these PowerPoint slides for presentations relating to graphically, graphic, vector, layout, business, computation, sign, infochart, visual, symbol, template, diagram, calculations, sector, data, revenue, schedule, element, analysis, drawing, report, technology, contour, classification, graph, modern, illustration, icon, comparison, object, chart, collection, science, color, growth, composition, professional, set, education, math, profits, information, symmetry, statistic, structure, infographics, button. The prominent colors used in the PowerPoint template are Green, Gray, White.

Statistical Analysis Of Circular Chart 5 Steps Ppt Business Plan PowerPoint Slides
We present our statistical analysis of circular chart 5 steps ppt business plan PowerPoint Slides.Download and present our Business PowerPoint Templates because Timeline crunches are a fact of life. Meet all deadlines using our PowerPoint Templates and Slides. Present our Signs PowerPoint Templates because You can Zap them with our PowerPoint Templates and Slides. See them reel under the impact. Use our Shapes PowerPoint Templates because It can Bubble and burst with your ideas. Download our Metaphors-Visual Concepts PowerPoint Templates because You can Create a matrix with our PowerPoint Templates and Slides. Feel the strength of your ideas click into place. Present our Process and Flows PowerPoint Templates because Our PowerPoint Templates and Slides has conjured up a web of all you need with the help of our great team. Use them to string together your glistening ideas.Use these PowerPoint slides for presentations relating to graphically, graphic, vector, layout, business, computation, sign, infochart, visual, symbol, template, diagram, calculations, sector, data, revenue, schedule, element, analysis, drawing, report, technology, contour, classification, graph, modern, illustration, icon, comparison, object, chart, collection, science, color, growth, composition, professional, set, education, math, profits, information, symmetry, statistic, structure, infographics, button. The prominent colors used in the PowerPoint template are Yellow, Gray, White.
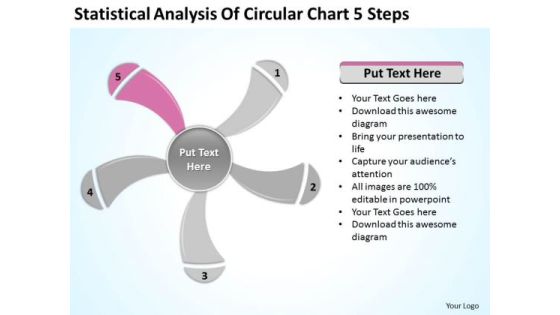
Statistical Analysis Of Circular Chart 5 Steps Ppt Outline For Business Plan PowerPoint Slides
We present our statistical analysis of circular chart 5 steps ppt outline for business plan PowerPoint Slides.Present our Business PowerPoint Templates because Our PowerPoint Templates and Slides will definately Enhance the stature of your presentation. Adorn the beauty of your thoughts with their colourful backgrounds. Download our Signs PowerPoint Templates because They will Put the wind in your sails. Skim smoothly over the choppy waters of the market. Download our Shapes PowerPoint Templates because Our PowerPoint Templates and Slides come in all colours, shades and hues. They help highlight every nuance of your views. Download and present our Metaphors-Visual Concepts PowerPoint Templates because Our PowerPoint Templates and Slides will let your words and thoughts hit bullseye everytime. Download and present our Process and Flows PowerPoint Templates because Our PowerPoint Templates and Slides will help you be quick off the draw. Just enter your specific text and see your points hit home.Use these PowerPoint slides for presentations relating to graphically, graphic, vector, layout, business, computation, sign, infochart, visual, symbol, template, diagram, calculations, sector, data, revenue, schedule, element, analysis, drawing, report, technology, contour, classification, graph, modern, illustration, icon, comparison, object, chart, collection, science, color, growth, composition, professional, set, education, math, profits, information, symmetry, statistic, structure, infographics, button. The prominent colors used in the PowerPoint template are Pink, Gray, White.

Agile Technique To Lawful Pitch And Proposals IT Legal Project Management Gantt Chart Slides PDF
Design a highly optimized project management report using this well-researched agile technique to lawful pitch and proposals it legal project management gantt chart slides pdf. This layout can be used to present the professional details of a task or activity. Showcase the activities allocated to the business executives with this Gantt Chart PowerPoint theme. List down the column tasks in various timeframes and allocate time for each. In addition, also monitor the actual time and make comparisons to interpret the final progress using this innovative Gantt Chart Template. Showcase the work breakdown structure to attract your audience. Download and share it using Google Slides, if it suits your requirement.
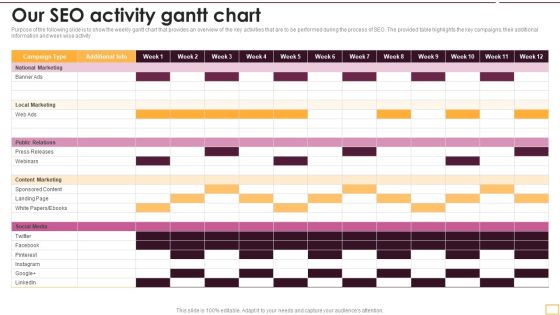
Implementing SEO Strategy To Enhance Business Performance Our SEO Activity Gantt Chart Sample PDF
Purpose of the following slide is to show the weekly gantt chart that provides an overview of the key activities that are to be performed during the process of SEO. The provided table highlights the key campaigns, their additional information and week wise activity. Design a highly optimized project management report using this well-researched Implementing SEO Strategy To Enhance Business Performance Our SEO Activity Gantt Chart Sample PDF. This layout can be used to present the professional details of a task or activity. Showcase the activities allocated to the business executives with this Gantt Chart PowerPoint theme. List down the column tasks in various timeframes and allocate time for each. In addition, also monitor the actual time and make comparisons to interpret the final progress using this innovative Gantt Chart Template. Showcase the work breakdown structure to attract your audience. Download and share it using Google Slides, if it suits your requirement.
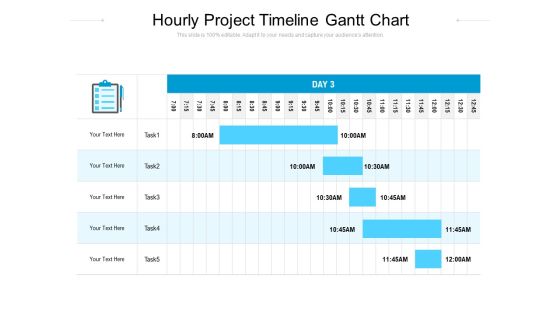
Task Hourly Schedule Gantt Chart Ppt PowerPoint Presentation Portfolio Examples PDF
Make a highly optimized project management report using this content-ready Gantt Chart PPT Diagram. Effortless yet very clear, this layout proves a useful tool to present the professional details of a task or activity. Showcase the activities and allotted time to the business executives with this Gantt Chart PowerPoint theme. List down the column tasks in various timeframes and the activities associated with each of them here. Further, plot time allocation for various tasks, monitor their actual time and make comparisons to interpret the final progress with this well-structured Gantt Chart Excel Template. You can add all the significant details of a particular project in this chart and showcase it to all the project members so that they can participate in the overall development. Not only this but also our PPT template can help you showcase the work breakdown structure of your project.
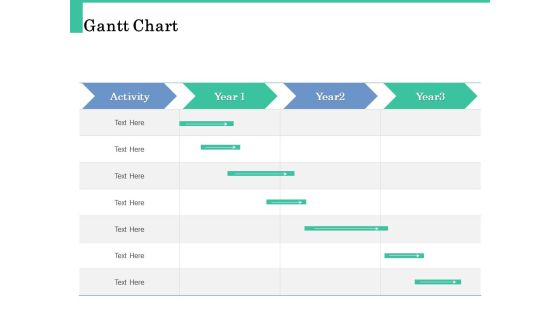
How A Corporate Life Coach Can Help Develop Your Company Gantt Chart Topics PDF
Make a highly optimized project management report using this content-ready Gantt Chart PPT Diagram. Effortless yet very clear, this layout proves a useful tool to present the professional details of a task or activity. Showcase the activities and allotted time to the business executives with this Gantt Chart PowerPoint theme. List down the column tasks in various timeframes and the activities associated with each of them here. Further, plot time allocation for various tasks, monitor their actual time and make comparisons to interpret the final progress with this well-structured Gantt Chart Excel Template. You can add all the significant details of a particular project in this chart and showcase it to all the project members so that they can participate in the overall development. Not only this but also our PPT template can help you showcase the work breakdown structure of your project.

HR Plan Gantt Chart With Employee Name And Task Details Ppt PowerPoint Presentation Outline Graphics Pictures
Make a highly optimized project management report using this content-ready Gantt Chart PPT Diagram. Effortless yet very clear, this layout proves a useful tool to present the professional details of a task or activity. Showcase the activities and allotted time to the business executives with this Gantt Chart PowerPoint theme. List down the column tasks in various timeframes and the activities associated with each of them here. Further, plot time allocation for various tasks, monitor their actual time and make comparisons to interpret the final progress with this well-structured Gantt Chart Excel Template. You can add all the significant details of a particular project in this chart and showcase it to all the project members so that they can participate in the overall development. Not only this but also our PPT template can help you showcase the work breakdown structure of your project.
operating system application gantt chart for ios apps proposal ppt icon introduction pdf
Make a highly optimized project management report using this content-ready Gantt Chart PPT Diagram. Effortless yet very clear, this layout proves a useful tool to present the professional details of a task or activity. Showcase the activities and allotted time to the business executives with this Gantt Chart PowerPoint theme. List down the column tasks in various timeframes and the activities associated with each of them here. Further, plot time allocation for various tasks, monitor their actual time and make comparisons to interpret the final progress with this well-structured Gantt Chart Excel Template. You can add all the significant details of a particular project in this chart and showcase it to all the project members so that they can participate in the overall development. Not only this but also our PPT template can help you showcase the work breakdown structure of your project.

Heating Ventilation And Air Conditioning Installation Gantt Chart For HAVC Services Proposal Ppt Slides Icon PDF
Make a highly optimized project management report using this content-ready Gantt Chart PPT Diagram. Effortless yet very clear, this layout proves a useful tool to present the professional details of a task or activity. Showcase the activities and allotted time to the business executives with this Gantt Chart PowerPoint theme. List down the column tasks in various timeframes and the activities associated with each of them here. Further, plot time allocation for various tasks, monitor their actual time and make comparisons to interpret the final progress with this well-structured Gantt Chart Excel Template. You can add all the significant details of a particular project in this chart and showcase it to all the project members so that they can participate in the overall development. Not only this but also our PPT template can help you showcase the work breakdown structure of your project.
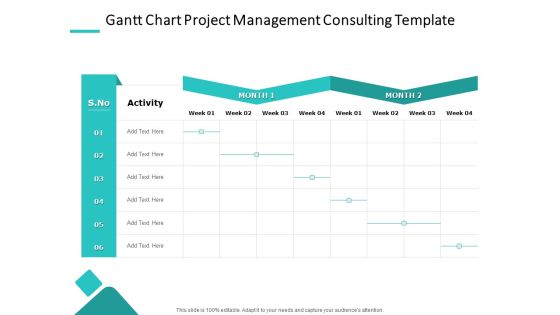
Gantt Chart Project Management Consulting Template Ppt PowerPoint Presentation Layouts Clipart Images PDF
Make a highly optimized project management report using this content-ready Gantt Chart PPT Diagram. Effortless yet very clear, this layout proves a useful tool to present the professional details of a task or activity. Showcase the activities and allotted time to the business executives with this Gantt Chart PowerPoint theme. List down the column tasks in various timeframes and the activities associated with each of them here. Further, plot time allocation for various tasks, monitor their actual time and make comparisons to interpret the final progress with this well-structured Gantt Chart Excel Template. You can add all the significant details of a particular project in this chart and showcase it to all the project members so that they can participate in the overall development. Not only this but also our PPT template can help you showcase the work breakdown structure of your project.

SEO Proposal Template Gantt Chart For Website Ranking Proposal Ppt PowerPoint Presentation File Layout PDF
Make a highly optimized project management report using this content-ready Gantt Chart PPT Diagram. Effortless yet very clear, this layout proves a useful tool to present the professional details of a task or activity. Showcase the activities and allotted time to the business executives with this Gantt Chart PowerPoint theme. List down the column tasks in various timeframes and the activities associated with each of them here. Further, plot time allocation for various tasks, monitor their actual time and make comparisons to interpret the final progress with this well-structured Gantt Chart Excel Template. You can add all the significant details of a particular project in this chart and showcase it to all the project members so that they can participate in the overall development. Not only this but also our PPT template can help you showcase the work breakdown structure of your project.

Gantt Chart For Pipeline Operator Proposal Ppt PowerPoint Presentation Styles Slide Portrait
Make a highly optimized project management report using this content-ready Gantt Chart PPT Diagram. Effortless yet very clear, this layout proves a useful tool to present the professional details of a task or activity. Showcase the activities and allotted time to the business executives with this Gantt Chart PowerPoint theme. List down the column tasks in various timeframes and the activities associated with each of them here. Further, plot time allocation for various tasks, monitor their actual time and make comparisons to interpret the final progress with this well-structured Gantt Chart Excel Template. You can add all the significant details of a particular project in this chart and showcase it to all the project members so that they can participate in the overall development. Not only this but also our PPT template can help you showcase the work breakdown structure of your project.
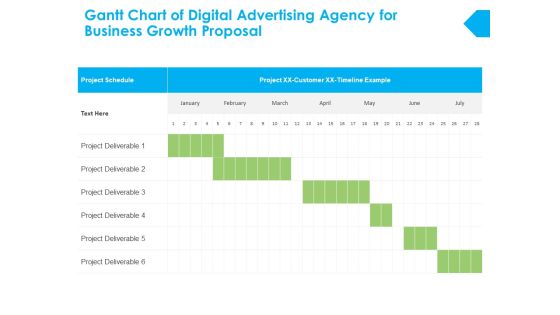
Gantt Chart Of Digital Advertising Agency For Business Growth Proposal Ppt PowerPoint Presentation Gallery Graphics
Make a highly optimized project management report using this content-ready Gantt Chart PPT Diagram. Effortless yet very clear, this layout proves a useful tool to present the professional details of a task or activity. Showcase the activities and allotted time to the business executives with this Gantt Chart PowerPoint theme. List down the column tasks in various timeframes and the activities associated with each of them here. Further, plot time allocation for various tasks, monitor their actual time and make comparisons to interpret the final progress with this well-structured Gantt Chart Excel Template. You can add all the significant details of a particular project in this chart and showcase it to all the project members so that they can participate in the overall development. Not only this but also our PPT template can help you showcase the work breakdown structure of your project.

Gantt Chart For HVAC Services Proposal Ppt PowerPoint Presentation Layouts Structure PDF
Make a highly optimized project management report using this content-ready Gantt Chart PPT Diagram. Effortless yet very clear, this layout proves a useful tool to present the professional details of a task or activity. Showcase the activities and allotted time to the business executives with this Gantt Chart PowerPoint theme. List down the column tasks in various timeframes and the activities associated with each of them here. Further, plot time allocation for various tasks, monitor their actual time and make comparisons to interpret the final progress with this well-structured Gantt Chart Excel Template. You can add all the significant details of a particular project in this chart and showcase it to all the project members so that they can participate in the overall development. Not only this but also our PPT template can help you showcase the work breakdown structure of your project.
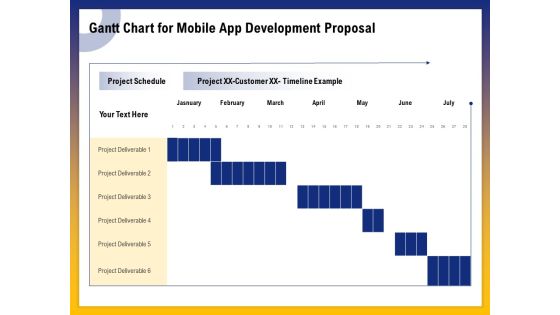
Phone Application Buildout Gantt Chart For Mobile App Development Proposal Ppt PowerPoint Presentation Gallery Vector PDF
Make a highly optimized project management report using this content-ready Gantt Chart PPT Diagram. Effortless yet very clear, this layout proves a useful tool to present the professional details of a task or activity. Showcase the activities and allotted time to the business executives with this Gantt Chart PowerPoint theme. List down the column tasks in various timeframes and the activities associated with each of them here. Further, plot time allocation for various tasks, monitor their actual time and make comparisons to interpret the final progress with this well-structured Gantt Chart Excel Template. You can add all the significant details of a particular project in this chart and showcase it to all the project members so that they can participate in the overall development. Not only this but also our PPT template can help you showcase the work breakdown structure of your project.

Enterprise Capabilities Training Gantt Chart Ppt PowerPoint Presentation Pictures Introduction PDF
Make a highly optimized project management report using this content-ready Gantt Chart PPT Diagram. Effortless yet very clear, this layout proves a useful tool to present the professional details of a task or activity. Showcase the activities and allotted time to the business executives with this Gantt Chart PowerPoint theme. List down the column tasks in various timeframes and the activities associated with each of them here. Further, plot time allocation for various tasks, monitor their actual time and make comparisons to interpret the final progress with this well-structured Gantt Chart Excel Template. You can add all the significant details of a particular project in this chart and showcase it to all the project members so that they can participate in the overall development. Not only this but also our PPT template can help you showcase the work breakdown structure of your project.

Primary Healthcare Implementation Service Gantt Chart For Implementing Primary Health Care Proposal Information PDF
Make a highly optimized project management report using this content-ready Gantt Chart PPT Diagram. Effortless yet very clear, this layout proves a useful tool to present the professional details of a task or activity. Showcase the activities and allotted time to the business executives with this Gantt Chart PowerPoint theme. List down the column tasks in various timeframes and the activities associated with each of them here. Further, plot time allocation for various tasks, monitor their actual time and make comparisons to interpret the final progress with this well-structured Gantt Chart Excel Template. You can add all the significant details of a particular project in this chart and showcase it to all the project members so that they can participate in the overall development. Not only this but also our PPT template can help you showcase the work breakdown structure of your project.
Stock Market Chart For Analyzing Investment Behavior Ppt Icon Summary PDF
This slides shows the amount invested in stock market in last six years. It includes the comparison of investment in equity and debentures. Showcasing this set of slides titled Stock Market Chart For Analyzing Investment Behavior Ppt Icon Summary PDF. The topics addressed in these templates are Investment Stocks, 2018 To 2023, Higher Returns. All the content presented in this PPT design is completely editable. Download it and make adjustments in color, background, font etc. as per your unique business setting.

Market Chart Showing Revenue Breakdown Of IT Products Ppt File Elements PDF
This slide shows the revenue comparison graph of IT products over last six months. IT products covered in the slide are hardware and software. Pitch your topic with ease and precision using this Market Chart Showing Revenue Breakdown Of IT Products Ppt File Elements PDF. This layout presents information on Hardware, Software, Key Insights. It is also available for immediate download and adjustment. So, changes can be made in the color, design, graphics or any other component to create a unique layout.

5 Years Comparative Analysis Chart Of Companys Financial Position Ppt Layouts Structure PDF
This slide represents the table showing the five comparison of financial position of a company. It includes details related to income and profitability, cash flow and investments and financial position of the company. Showcasing this set of slides titled 5 Years Comparative Analysis Chart Of Companys Financial Position Ppt Layouts Structure PDF. The topics addressed in these templates are Income And Profitability, Financial Position, Balance Sheet Total. All the content presented in this PPT design is completely editable. Download it and make adjustments in color, background, font etc. as per your unique business setting.

5 Years Attrition Rate Comparative Analysis Chart Of IT Company Ppt Layouts Examples PDF
This slide represents the table showing the comparison between attrition rates and no. of employees of an IT company over the five years. It includes details related to attrition rates and no. of employees during different years. Showcasing this set of slides titled 5 Years Attrition Rate Comparative Analysis Chart Of IT Company Ppt Layouts Examples PDF. The topics addressed in these templates are Attrition Rate, No Employees, 2018 To 2022. All the content presented in this PPT design is completely editable. Download it and make adjustments in color, background, font etc. as per your unique business setting.

5 Years Comparative Analysis Chart Of Liquidity Ratios Of IT Companies Ppt Portfolio Visual Aids PDF
This slide represents the table showing comparison between current and quick ratios of two IT companies over five years. It includes details related to current and quick ratios for both companies for different years along with the average of their five years ratios. Pitch your topic with ease and precision using this 5 Years Comparative Analysis Chart Of Liquidity Ratios Of IT Companies Ppt Portfolio Visual Aids PDF. This layout presents information on Current Ratio, Average, 2018 To 2022. It is also available for immediate download and adjustment. So, changes can be made in the color, design, graphics or any other component to create a unique layout.

5 Years General Ledger Comparative Analysis Chart Report Ppt Model Slide PDF
This slide represents the report showing the comparison of the general ledger of five years of a company. It includes various assets such as cash, restricted bank, other payments, furnitures and fixtures etc. Showcasing this set of slides titled 5 Years General Ledger Comparative Analysis Chart Report Ppt Model Slide PDF. The topics addressed in these templates are Other Payment, Investments, Fixed Assets. All the content presented in this PPT design is completely editable. Download it and make adjustments in color, background, font etc. as per your unique business setting.

5 Years Comparative Analysis Chart Of Financial Performance In Investment Banking Sector Themes PDF
This slide shows the table representing the five years comparison between the financial performance of various banks of a country. It includes details related to financial positions of different banks in various years. Showcasing this set of slides titled 5 Years Comparative Analysis Chart Of Financial Performance In Investment Banking Sector Themes PDF. The topics addressed in these templates are Values Percentage, Bank, Year. All the content presented in this PPT design is completely editable. Download it and make adjustments in color, background, font etc. as per your unique business setting.

5 Years Profit And Loss Comparative Analysis Chart Of Enterprise Ppt Icon Graphics PDF
This slide represents the comparison of profit and loss of an organization for the five years. It includes details related to profit and loss from various accounts such as order fees, concession income, facility rental etc. Pitch your topic with ease and precision using this 5 Years Profit And Loss Comparative Analysis Chart Of Enterprise Ppt Icon Graphics PDF. This layout presents information on Account, 2018 To 2022, Exchange Fees. It is also available for immediate download and adjustment. So, changes can be made in the color, design, graphics or any other component to create a unique layout.

5 Years Net Income Comparative Analysis Chart Of Financial Institute Ppt Show Designs PDF
This slide represents the comparison of net income of financial institute for different years. It includes details related to total revenue, gross profit, operating income and net income and ratios of the institute for different years. Showcasing this set of slides titled 5 Years Net Income Comparative Analysis Chart Of Financial Institute Ppt Show Designs PDF. The topics addressed in these templates are Income Statement, 2018 To 2022, Ratios. All the content presented in this PPT design is completely editable. Download it and make adjustments in color, background, font etc. as per your unique business setting.

5 Years Returns Comparative Analysis Chart Of Various Mutual Funds Ppt Slides Microsoft PDF
This slide covers the table representing the comparison of various mutual funds on the basis of five years return. It includes details related to names of funds, category, 1st, 3rd and 5 years returns. Showcasing this set of slides titled 5 Years Returns Comparative Analysis Chart Of Various Mutual Funds Ppt Slides Microsoft PDF. The topics addressed in these templates are Diversified Equity, Small And Midcap, Diversified Equity. All the content presented in this PPT design is completely editable. Download it and make adjustments in color, background, font etc. as per your unique business setting.
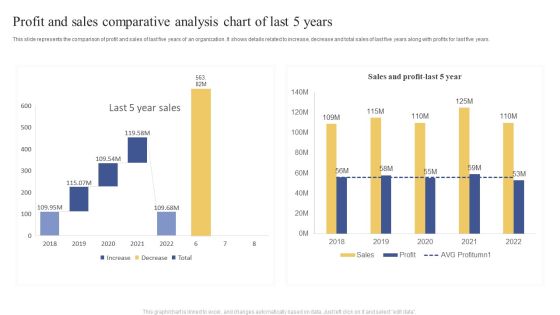
Profit And Sales Comparative Analysis Chart Of Last 5 Years Ppt Visual Aids Example 2015 PDF
This slide represents the comparison of profit and sales of last five years of an organization. It shows details related to increase, decrease and total sales of last five years along with profits for last five years. Showcasing this set of slides titled Profit And Sales Comparative Analysis Chart Of Last 5 Years Ppt Visual Aids Example 2015 PDF. The topics addressed in these templates are Last 5 Year, Sales, 2018 To 2022. All the content presented in this PPT design is completely editable. Download it and make adjustments in color, background, font etc. as per your unique business setting.

Five Years Comparative Analysis Chart Of Organizations Expenses And Savings Topics PDF
This slide represents the five years comparison of savings and expenses incurred by an organization during installation of software solutions. It includes details related to expenses with and without solutions, yearly and total savings. Showcasing this set of slides titled Five Years Comparative Analysis Chart Of Organizations Expenses And Savings Topics PDF. The topics addressed in these templates are Expenses Without Solution, Yearly Savings, Total Savings. All the content presented in this PPT design is completely editable. Download it and make adjustments in color, background, font etc. as per your unique business setting.

5 Years Price Comparative Analysis Chart Of Cloud Service Solutions Brochure PDF
This slide represents the table showing the five years comparison of prices incurred in installing cloud service solution in the organization. It includes details related to on-premises prices, cloud services price and savings for different years. Showcasing this set of slides titled 5 Years Price Comparative Analysis Chart Of Cloud Service Solutions Brochure PDF. The topics addressed in these templates are Cloud, Savings, 2018 To 2022. All the content presented in this PPT design is completely editable. Download it and make adjustments in color, background, font etc. as per your unique business setting.

5 Years Comparative Analysis Chart Of Balance Sheet Of Organization Ppt Inspiration Slide PDF
This slider represents the five years comparison of organizations balance sheet. It includes details related to total assets and liabilities along with total equity over different years. Pitch your topic with ease and precision using this 5 Years Comparative Analysis Chart Of Balance Sheet Of Organization Ppt Inspiration Slide PDF. This layout presents information on Account Assets, Total Assets Liabilities, Total Liabilities Equity. It is also available for immediate download and adjustment. So, changes can be made in the color, design, graphics or any other component to create a unique layout.

5 Years Expenses Comparative Analysis Chart For Core Banking Solutions Ppt Portfolio Clipart Images PDF
This slide shows the table representing the five years comparison between various costs incurred in installation of core banking solutions. It includes details related to various expenses such as entry level server, increase in electricity costs etc. Pitch your topic with ease and precision using this 5 Years Expenses Comparative Analysis Chart For Core Banking Solutions Ppt Portfolio Clipart Images PDF. This layout presents information on Entry Level Server, Antivirus Server, Increase Electricity Cost. It is also available for immediate download and adjustment. So, changes can be made in the color, design, graphics or any other component to create a unique layout.

5 Years Sales And Profit Growth Comparative Analysis Chart Of Private Banks Infographics PDF
This slide shows the table representing the comparison between sales and profit growth of five years of various private banks. It includes details related to names of private banks and their five years sales growth and profit growth. Pitch your topic with ease and precision using this 5 Years Sales And Profit Growth Comparative Analysis Chart Of Private Banks Infographics PDF. This layout presents information on Private Banks, Sales Growth, Profit Growth. It is also available for immediate download and adjustment. So, changes can be made in the color, design, graphics or any other component to create a unique layout.

5 Years Technological Comparative Analysis Chart Of Service Provisioning And Operational Costs Information PDF
This slide represents the five years technological and cost based comparison for use of passive optical network. It includes details related to ONT cost, service provisioning and operational costs for five years. Pitch your topic with ease and precision using this 5 Years Technological Comparative Analysis Chart Of Service Provisioning And Operational Costs Information PDF. This layout presents information on Optical Network Termination, Service Provisioning, Operational Cost. It is also available for immediate download and adjustment. So, changes can be made in the color, design, graphics or any other component to create a unique layout.

Chart To Compare Month To Month Change Ppt PowerPoint Presentation Infographic Template Slide Portrait
This is a chart to compare month to month change ppt powerpoint presentation infographic template slide portrait. The topics discussed in this diagram are monthly comparison, monthly compare, 30 days comparison. This is a completely editable PowerPoint presentation and is available for immediate download.

Medical And Healthcare Related Gantt Chart For Medical Service Proposal Ppt Introduction PDF
Introducing our medical and healthcare related gantt chart for medical service proposal ppt introduction pdf that is designed to showcase some of the vital components that will help you create timelines, roadmaps, and project plans. In addition, also communicate your project durations, milestones, tasks, subtasks, dependencies, and other attributes using this well-structured medical and healthcare related gantt chart for medical service proposal ppt introduction pdf template. You can also exhibit preeminence against time by deploying this easily adaptable slide to your business presentation. Our experts have designed this template in such a way that it is sure to impress your audience. Thus, download it and steer your project meetings, meetups, and conferences.
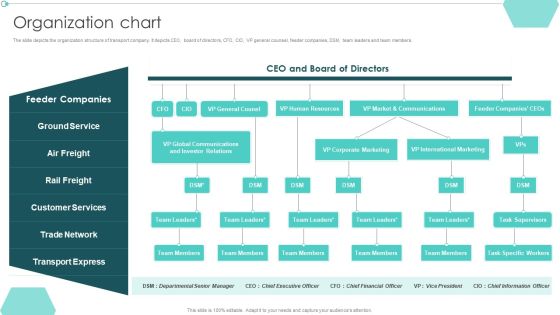
Transportation Company Profile Organization Chart Ppt PowerPoint Presentation Styles Graphics Tutorials PDF
This is a Transportation Company Profile Organization Chart Ppt PowerPoint Presentation Styles Graphics Tutorials PDF template with various stages. Focus and dispense information on one stage using this creative set, that comes with editable features. It contains large content boxes to add your information on topics like Customer Services, Global Communications, Transport Express. You can also showcase facts, figures, and other relevant content using this PPT layout. Grab it now.
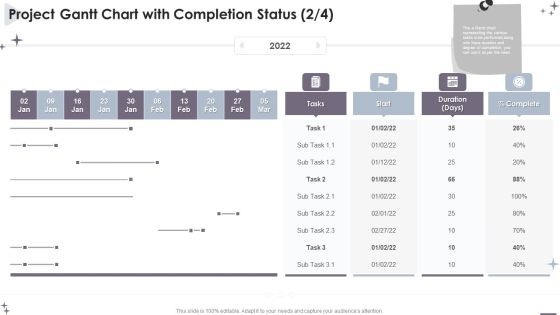
Project Administration Bundle Project Gantt Chart With Completion Status Designs PDF
Introducing our Project Administration Bundle Project Gantt Chart With Completion Status Designs PDF that is designed to showcase some of the vital components that will help you create timelines, roadmaps, and project plans. In addition, also communicate your project durations, milestones, tasks, subtasks, dependencies, and other attributes using this well structured Project Administration Bundle Project Gantt Chart With Completion Status Designs PDF template. You can also exhibit preeminence against time by deploying this easily adaptable slide to your business presentation. Our experts have designed this template in such a way that it is sure to impress your audience. Thus, download it and steer your project meetings, meetups, and conferences.

Cash Market Investor Deck Organization Chart Diagram Of The Company Services Ppt Professional Icon PDF
The slide provides the diagram which shows ownership structure holding and subsidiary companies of the company. The structure includes holding company, sister subsidiaries and subsidiaries of our company. This is a cash market investor deck organization chart diagram of the company services ppt professional icon pdf template with various stages. Focus and dispense information on three stages using this creative set, that comes with editable features. It contains large content boxes to add your information on topics like services provider, investment company, asset management solutions, insurance operations. You can also showcase facts, figures, and other relevant content using this PPT layout. Grab it now.
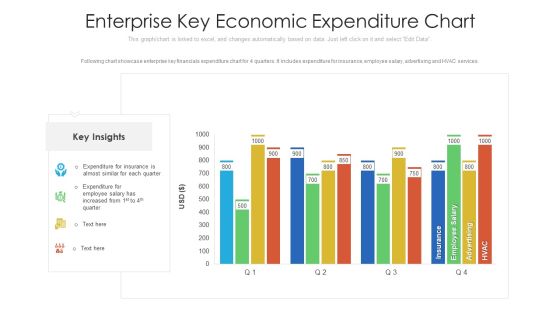
Enterprise Key Economic Expenditure Chart Ppt PowerPoint Presentation File Designs Download PDF
Following chart showcase enterprise key financials expenditure chart for 4 quarters. It includes expenditure for insurance, employee salary, advertising and HVAC services. Pitch your topic with ease and precision using this enterprise key economic expenditure chart ppt powerpoint presentation file designs download pdf. This layout presents information on enterprise key economic expenditure chart. It is also available for immediate download and adjustment. So, changes can be made in the color, design, graphics or any other component to create a unique layout.

Business Diagram 3d Lock With Pie Chart And Text Boxes For Business PowerPoint Slide
This Power Point diagram has been crafted with pie chart in shape of lock. It contains diagram of lock pie chart to compare and present data in an effective manner. Use this diagram to build professional presentations for your viewers.

Bar Graph And Line Chart For Comparative Analysis Icon Ppt PowerPoint Presentation Gallery Infographics PDF
Showcasing this set of slides titled bar graph and line chart for comparative analysis icon ppt powerpoint presentation gallery infographics pdf. The topics addressed in these templates are bar graph and line chart for comparative analysis icon. All the content presented in this PPT design is completely editable. Download it and make adjustments in color, background, font etc. as per your unique business setting.
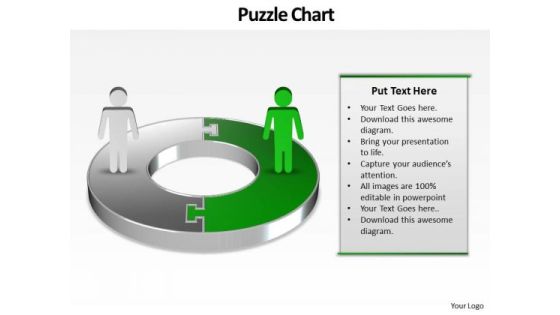
Ppt Green PowerPoint Slide Man On Circular Gantt Chart Template Templates
PPT green powerpoint slide man on circular gantt chart template Templates-This PowerPoint Diagram shows you the Circular way to represent Business components or losses in Business related Activities. This PowerPoint Diagram can be use in Investor presentations for Initial Public Offerings, Annual general meetings and financial seminars.-PPT green powerpoint slide man on circular gantt chart template Templates-abstract, accounting, background, business, businessman, chart, company, connection, corporate, diagram, earnings, finance, forecast, graph, growth, investment, management, network, people, profit, progress, puzzle, shapes, team, technology, vector, wealth

Ppt Red World Business Layouts People Stand On Circular Chart PowerPoint Templates
PPT red world business layouts people stand on circular chart PowerPoint Templates-This 3D PowerPoint Diagram shows the Three interconnected stages represented by first Red Quadrant. It signifies the concept of aspect, attribute, bearing, complexion, component, differentia, disposition, distinction, earmark, essence, essential etc.-PPT red world business layouts people stand on circular chart PowerPoint Templates-abstract, accounting, background, business, businessman, chart, company, connection, corporate, diagram, earnings, finance, forecast, graph, growth, investment, management, network, people, profit, progress, puzzle, shapes, team, technology, vector, wealth

Ppt Red Quadrant On Circular Free Pie PowerPoint Template Chart Ks2 Templates
PPT red quadrant on circular free pie powerpoint template chart ks2 Templates-Use this layout to define the outcome and the multiple possibilities in a way that is used in calculation of probabilities, genetics and strategic reasoning. This chart visualize the of process steps, reoccurrences and components or of your company structure or product features.-PPT red quadrant on circular free pie powerpoint template chart ks2 Templates-3 arrow, art, background, business, chart, circle, clip, colorful, design, diagram, flow, fourth, graph, graphic, half, icon, illustration, management, point, process, progress, project, round, segment, set, slide, stage, successful business, third, transparent

Eight Diverging Components A Circular Process Business Pie Chart PowerPoint Slides
We present our eight diverging components a circular process business Pie Chart PowerPoint Slides.Present our Business PowerPoint Templates because everybody knows The world over it is a priority for many. Along with it there are so many oppurtunities waiting to be utilised. Download and present our Circle Charts PowerPoint Templates because our ready backdrops leave a lasting impression. Present our Arrows PowerPoint Templates because you can Show them how to churn out fresh ideas. Use our Shapes PowerPoint Templates because watching them will strengthen your companys sinews. Use our Flow charts PowerPoint Templates because you can get advantage to prioritise your ideas.Use these PowerPoint slides for presentations relating to Arrows, blank, business, central, centralized, chart, circle, circular, circulation concept, conceptual, converging, design, diagram, empty, executive, icon, idea illustration, management, map, mapping, moa, model, numbers, organization outwards, pointing, procedure, process, radial, radiating, relationship, resource sequence, sequential, seven, square, strategy, template. The prominent colors used in the PowerPoint template are Blue, Gray, White. Presenters tell us our eight diverging components a circular process business Pie Chart PowerPoint Slides are Efficacious. Presenters tell us our centralized PowerPoint templates and PPT Slides are Handsome. PowerPoint presentation experts tell us our eight diverging components a circular process business Pie Chart PowerPoint Slides are Awesome. We assure you our business PowerPoint templates and PPT Slides are Delightful. Customers tell us our eight diverging components a circular process business Pie Chart PowerPoint Slides are Functional. People tell us our central PowerPoint templates and PPT Slides are Delightful.
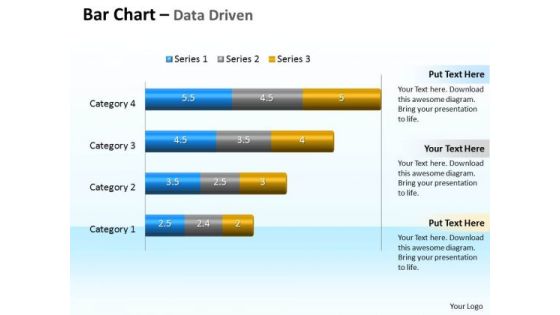
Data Analysis Programs 3d Bar Chart To Compare Categories PowerPoint Templates
Discover Decisive Moments With Our data analysis programs 3d bar chart to compare categories Powerpoint Templates . They Help Make That Crucial Difference.
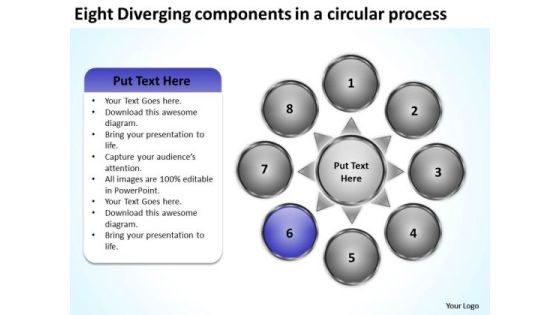
Eight Diverging Components A Circular Process Circular Pie Chart PowerPoint Slides
We present our eight diverging components a circular process Circular Pie Chart PowerPoint Slides.Use our Business PowerPoint Templates because you can Flutter your wings and enchant the world. Impress them with the innate attractiveness of your thoughts and words. Use our Circle Charts PowerPoint Templates because you are the star of your enlightened team. Download and present our Arrows PowerPoint Templates because the key criteria for necessary infrastructure are at your finger tips. Radiate this knowledge to the group and see their eyes light up. Use our Shapes PowerPoint Templates because the structure of our templates allows you to effectively highlight the key issues concerning the growth of your business. Use our Flow charts PowerPoint Templates because this template contains the material to highlight the key issues of your presentation.Use these PowerPoint slides for presentations relating to Arrows, blank, business, central, centralized, chart, circle, circular, circulation concept, conceptual, converging, design, diagram, empty, executive, icon, idea illustration, management, map, mapping, moa, model, numbers, organization outwards, pointing, procedure, process, radial, radiating, relationship, resource sequence, sequential, seven, square, strategy, template. The prominent colors used in the PowerPoint template are Blue, Gray, White. Presenters tell us our eight diverging components a circular process Circular Pie Chart PowerPoint Slides are Breathtaking. Presenters tell us our business PowerPoint templates and PPT Slides have awesome images to get your point across. PowerPoint presentation experts tell us our eight diverging components a circular process Circular Pie Chart PowerPoint Slides are Adorable. We assure you our chart PowerPoint templates and PPT Slides are Excellent. Customers tell us our eight diverging components a circular process Circular Pie Chart PowerPoint Slides are Fabulous. People tell us our chart PowerPoint templates and PPT Slides are effectively colour coded to prioritise your plans They automatically highlight the sequence of events you desire.

Microsoft Excel Data Analysis Bar Chart To Compare Quantities PowerPoint Templates
Our microsoft excel data analysis bar chart to compare quantities Powerpoint Templates Leave No One In Doubt. Provide A Certainty To Your Views.

Examples Of Data Analysis Market Driven Radar Chart To Compare PowerPoint Slides Templates
Rely On Our examples of data analysis market driven radar chart to compare powerpoint slides Templates In Any Duel. They Will Drive Home Your Point.

11 Stages Representing Diverging Circular Flow Chart Ppt Cycle Process PowerPoint Templates
We present our 11 stages representing diverging circular flow chart ppt Cycle Process PowerPoint templates.Present our Circle Charts PowerPoint Templates because they will Amplify your basic corporate concept and forefront the benefits of overlapping processes to arrive at common goals. Download and present our Arrows PowerPoint Templates because this slide is an excellent backdrop for you to enlighten your audience on the process you have gone through and the vision you have for the future. Use our Ring Charts PowerPoint Templates because your listeners do not have to put on their thinking caps. Download and present our Business PowerPoint Templates because it helps you to project your enthusiasm and single mindedness to your colleagues. Use our Flow Charts PowerPoint Templates because you have examined every element down to the finest detail.Use these PowerPoint slides for presentations relating to arrows, business, chart, circle, company, concept, continuity, continuous, cycle, dependency, diagram, direction, dynamic, endless, feeds, graph, iteration, iterative, method, path, phase, presentation, process, production, progress, progression, report, rotation, sequence, succession, vector. The prominent colors used in the PowerPoint template are Green, Blue, Gray. Presenters tell us our 11 stages representing diverging circular flow chart ppt Cycle Process PowerPoint templates are Pleasant. You can be sure our cycle PowerPoint templates and PPT Slides will get their audience's attention. Professionals tell us our 11 stages representing diverging circular flow chart ppt Cycle Process PowerPoint templates are Flirty. People tell us our circle PowerPoint templates and PPT Slides will save the presenter time. People tell us our 11 stages representing diverging circular flow chart ppt Cycle Process PowerPoint templates are aesthetically designed to attract attention. We guarantee that they will grab all the eyeballs you need. Professionals tell us our circle PowerPoint templates and PPT Slides are Playful.

 Home
Home