Comparison Chart
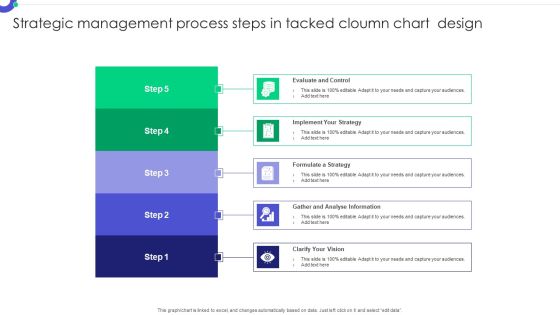
Strategic Management Process Steps In Tacked Cloumn Chart Design Pictures PDF
Pitch your topic with ease and precision using this Strategic Management Process Steps In Tacked Cloumn Chart Design Pictures PDF. This layout presents information on Evaluate Control, Implement Strategy, Formulate Strategy. It is also available for immediate download and adjustment. So, changes can be made in the color, design, graphics or any other component to create a unique layout.
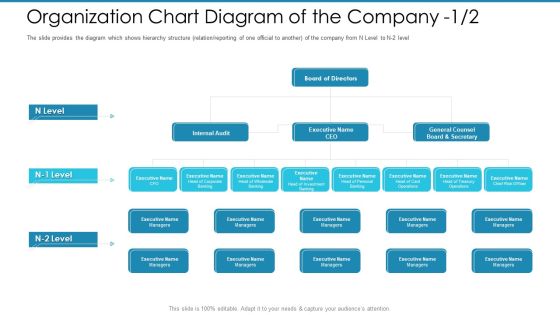
Post Initial Pubic Offering Market Pitch Deck Organization Chart Diagram Of The Company Directors Formats PDF
The slide provides the diagram which shows hierarchy structure relation reporting of one official to another of the company from N Level to N 2 level.This is a post initial pubic offering market pitch deck organization chart diagram of the company directors formats pdf. template with various stages. Focus and dispense information on five stages using this creative set, that comes with editable features. It contains large content boxes to add your information on topics like organization chart diagram of the company. You can also showcase facts, figures, and other relevant content using this PPT layout. Grab it now.

Organization Chart Diagram Of The Company Services Ppt Show Visual Aids PDF
The slide provides the diagram which shows ownership structure holding and subsidiary companies of the company. The structure includes holding company, sister subsidiaries and subsidiaries of our company.This is a organization chart diagram of the company services ppt show visual aids pdf. template with various stages. Focus and dispense information on three stages using this creative set, that comes with editable features. It contains large content boxes to add your information on topics like organization chart diagram of the company. You can also showcase facts, figures, and other relevant content using this PPT layout. Grab it now.

Pitch Presentation Raise Money Spot Market Organization Chart Diagram Of The Company Level Portrait PDF
The slide provides the diagram which shows hierarchy structure relation or reporting of one official to another of the company from N Level to N 2 level. This is a pitch presentation raise money spot market organization chart diagram of the company level portrait pdf template with various stages. Focus and dispense information on five stages using this creative set, that comes with editable features. It contains large content boxes to add your information on topics like organization chart diagram of the company. You can also showcase facts, figures, and other relevant content using this PPT layout. Grab it now.

Strawman Project Action Plan Organizational Chart With Key People Involved Slides PDF
This slide presents the organizational structure of the firm with key people involved in managing firm. This is a strawman project action plan organizational chart with key people involved slides pdf template with various stages. Focus and dispense information on three stages using this creative set, that comes with editable features. It contains large content boxes to add your information on topics like organizational chart with key people involved. You can also showcase facts, figures, and other relevant content using this PPT layout. Grab it now.

Management Acquisition As Exit Strategy Ownership Transfer Organizational Chart With Key People Involved Structure PDF
This slide presents the organizational structure of the firm with key people involved in managing firm. This is a management acquisition as exit strategy ownership transfer organizational chart with key people involved structure pdf template with various stages. Focus and dispense information on four stages using this creative set, that comes with editable features. It contains large content boxes to add your information on topics like organizational chart with key people involved . You can also showcase facts, figures, and other relevant content using this PPT layout. Grab it now.
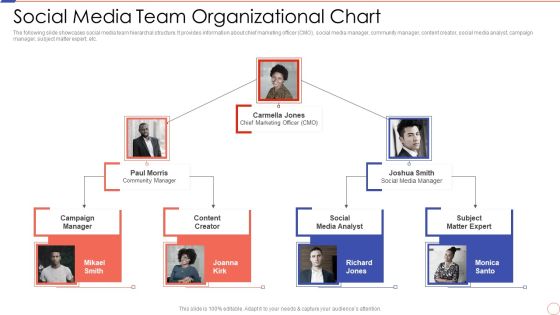
Social Media Engagement To Increase Customer Engagement Social Media Team Organizational Chart Graphics PDF
The following slide showcases social media team hierarchal structure. It provides information about chief marketing officer CMO, social media manager, community manager, content creator, social media analyst, campaign manager, subject matter expert, etc. This is a Social Media Engagement To Increase Customer Engagement Social Media Team Organizational Chart Graphics PDF template with various stages. Focus and dispense information on three stages using this creative set, that comes with editable features. It contains large content boxes to add your information on topics like Social Media Team Organizational Chart. You can also showcase facts, figures, and other relevant content using this PPT layout. Grab it now.

Organization Chart After Restructuring Ppt PowerPoint Presentation Gallery Design Inspiration PDF
This slide is covering organizational chart where chairman is at the top of the hierarchy and the other key board members with sub members. This is a Organization Chart After Restructuring Ppt PowerPoint Presentation Gallery Design Inspiration PDF template with various stages. Focus and dispense information on eight stages using this creative set, that comes with editable features. It contains large content boxes to add your information on topics like Board Safety, Quality Committee, Remuneration Committee. You can also showcase facts, figures, and other relevant content using this PPT layout. Grab it now.
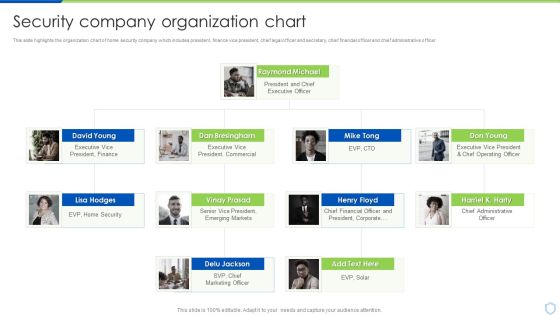
Security And Surveillance Company Profile Security Company Organization Chart Portrait PDF
This slide highlights the organization chart of home security company which includes president, finance vice president, chief legal officer and secretary, chief financial officer and chief administrative officer. This is a Security And Surveillance Company Profile Security Company Organization Chart Portrait PDF template with various stages. Focus and dispense information on four stages using this creative set, that comes with editable features. It contains large content boxes to add your information on topics like Raymond Michael, Executive President, Emerging Markets. You can also showcase facts, figures, and other relevant content using this PPT layout. Grab it now.

Food And Agro Company Outline Organization Chart Ppt Summary Example File PDF
This slide highlights the organization chart of agricultural company which includes founder, CEO, EVP of retail products, fertilizer products, chief financial officer, chief legal officer, corporate development and strategy. This is a Food And Agro Company Outline Organization Chart Ppt Summary Example File PDF template with various stages. Focus and dispense information on four stages using this creative set, that comes with editable features. It contains large content boxes to add your information on topics like Founder And CEO, Retail Products, Fertilizer Products, Chief Financial Officer. You can also showcase facts, figures, and other relevant content using this PPT layout. Grab it now.

Social Media Marketing Company Profile Organization Chart Ppt Inspiration Outfit PDF
This slide showcases the organization chart of digital marketing agency which includes leaders and managers from different departments highlighting marketing automation, content writer, SEO, advertising, and analyst managers. This is a Social Media Marketing Company Profile Organization Chart Ppt Inspiration Outfit PDF template with various stages. Focus and dispense information on six stages using this creative set, that comes with editable features. It contains large content boxes to add your information on topics like Digital Marketing Manager, Marketing Automation Manager, Content Team Manager. You can also showcase facts, figures, and other relevant content using this PPT layout. Grab it now.

Infotech Solutions Research And Development Company Summary Organization Chart Ideas PDF
The slide highlights the organizational chart for IT company. It depicts chief executing officer, chief operating officer, legal team, HR head, chief of operations, chief of finance, chief of corporate compliance and chief of human resource. This is a Infotech Solutions Research And Development Company Summary Organization Chart Ideas PDF template with various stages. Focus and dispense information on six stages using this creative set, that comes with editable features. It contains large content boxes to add your information on topics like Marketing, Corporate Services, Systems Support. You can also showcase facts, figures, and other relevant content using this PPT layout. Grab it now.
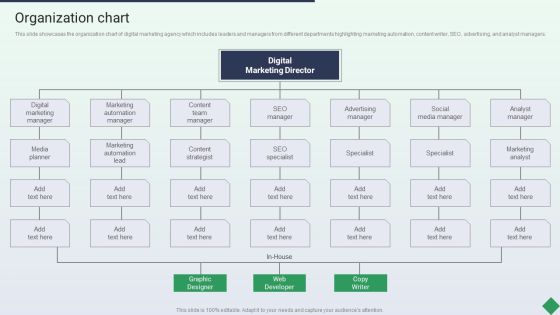
Website Marketing Enterprise Profile Organization Chart Ppt PowerPoint Presentation Professional Backgrounds PDF
This slide showcases the organization chart of digital marketing agency which includes leaders and managers from different departments highlighting marketing automation, content writer, SEO, advertising, and analyst managers.This is a Website Marketing Enterprise Profile Organization Chart Ppt PowerPoint Presentation Professional Backgrounds PDF template with various stages. Focus and dispense information on two stages using this creative set, that comes with editable features. It contains large content boxes to add your information on topics like Marketing Manager, Media Planner, Marketing Automation. You can also showcase facts, figures, and other relevant content using this PPT layout. Grab it now.

Supply Chain Solutions Business Outline Logistics Company Organization Chart Pictures PDF
This slide highlights the organization chart of supply chain or logistics company which includes transportation and warehouse, international forwarding, shipping agency and finance department. This is a Supply Chain Solutions Business Outline Logistics Company Organization Chart Pictures PDF template with various stages. Focus and dispense information on eight stages using this creative set, that comes with editable features. It contains large content boxes to add your information on topics like Finance Department, Administration Department, Project Investment. You can also showcase facts, figures, and other relevant content using this PPT layout. Grab it now.

break even chart showing contribution margin ppt powerpoint presentation professional templates
This is a break even chart showing contribution margin ppt powerpoint presentation professional templates. This is a two stage process. The stages in this process are break even point,break even analysis,break even level.

11 Stages Marketing Process Chart Ppt Components Of Business Plan PowerPoint Slides
We present our 11 stages marketing process chart ppt components of business plan PowerPoint Slides.Download and present our Flow Charts PowerPoint Templates because Our PowerPoint Templates and Slides will embellish your thoughts. See them provide the desired motivation to your team. Download our Process and Flows PowerPoint Templates because Our PowerPoint Templates and Slides will let your words and thoughts hit bullseye everytime. Download our Business PowerPoint Templates because Our PowerPoint Templates and Slides will provide you a launch platform. Give a lift off to your ideas and send them into orbit. Download our Shapes PowerPoint Templates because Our PowerPoint Templates and Slides will let you meet your Deadlines. Download and present our Marketing PowerPoint Templates because These PowerPoint Templates and Slides will give the updraft to your ideas. See them soar to great heights with ease.Use these PowerPoint slides for presentations relating to Chart, flow, process, workflow, review, square, corporation, corporate, business, plan, hierarchy, glossy, compliance, diagram, graphic, marketing, development, graph, modern, illustration, icon, assess, clipart, stages, executive, design, clip, set, organization, infographic,levels, organize, art, implement, work, eleven. The prominent colors used in the PowerPoint template are White, Blue, Gray.
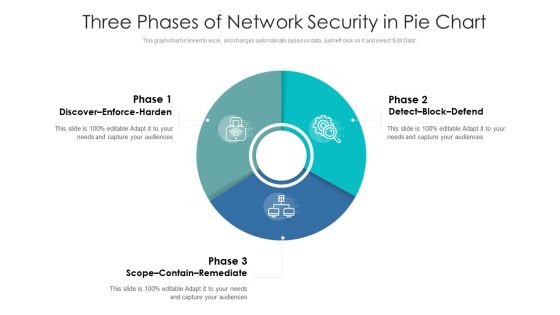
Three Phases Of Network Security In Pie Chart Ppt PowerPoint Presentation Gallery Graphics Download PDF
Pitch your topic with ease and precision using this three phases of network security in pie chart ppt powerpoint presentation gallery graphics download pdf. This layout presents information on discover enforce harden, detect block defend, scope contain remediate. It is also available for immediate download and adjustment. So, changes can be made in the color, design, graphics or any other component to create a unique layout.
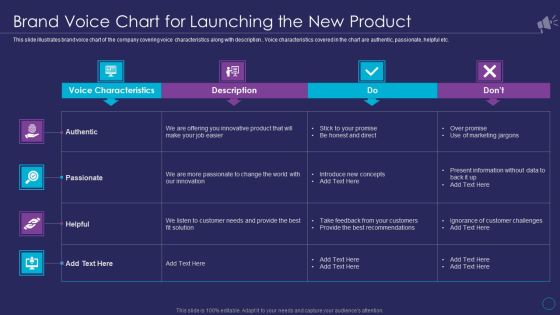
Organizational Marketing Playbook Brand Voice Chart For Launching The New Product Formats PDF
This slide illustrates brand voice chart of the company covering voice characteristics along with description. Voice characteristics covered in the chart are authentic, passionate, helpful etc.Deliver an awe inspiring pitch with this creative Organizational Marketing Playbook Brand Voice Chart For Launching The New Product Formats PDF bundle. Topics like Brand Voice Chart for Launching the New Product can be discussed with this completely editable template. It is available for immediate download depending on the needs and requirements of the user.
Project Management Chart With Monitor And Control Ppt PowerPoint Presentation Summary Icons PDF
Pitch your topic with ease and precision using this project management chart with monitor and control ppt powerpoint presentation summary icons pdf. This layout presents information on executing, planning, monitor and control, closing, initiating, start, time, end. It is also available for immediate download and adjustment. So, changes can be made in the color, design, graphics or any other component to create a unique layout.

Chart Showing Quarterly Product Sales By Various Vendors Ppt PowerPoint Presentation Professional Vector PDF
Pitch your topic with ease and precision using this chart showing quarterly product sales by various vendors ppt powerpoint presentation professional vector pdf. This layout presents information on number of products sold, region abc region, year 2020, product sales, supplier. It is also available for immediate download and adjustment. So, changes can be made in the color, design, graphics or any other component to create a unique layout.

Power Grid Statistics Chart For Year Over Year Analysis Ppt PowerPoint Presentation Show Model PDF
Pitch your topic with ease and precision using this power grid statistics chart for year over year analysis ppt powerpoint presentation show model pdf. This layout presents information on investments by distribution system operators, investments by transmission system operators, 2017 to 2020. It is also available for immediate download and adjustment. So, changes can be made in the color, design, graphics or any other component to create a unique layout.

Chart Showing Time And Business Impact Ppt PowerPoint Presentation Example 2015 PDF
Pitch your topic with ease and precision using this chart showing time and business impact ppt powerpoint presentation example 2015 pdf. This layout presents information on business impact mobilization, ramp up, steady state, time, conscious change, renewal, effort. It is also available for immediate download and adjustment. So, changes can be made in the color, design, graphics or any other component to create a unique layout.
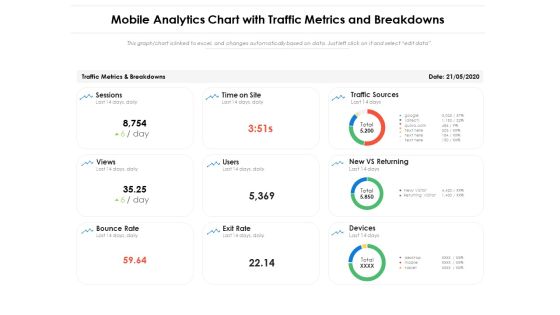
Mobile Analytics Chart With Traffic Metrics And Breakdowns Ppt PowerPoint Presentation Ideas Layout PDF
Pitch your topic with ease and precision using this mobile analytics chart with traffic metrics and breakdowns ppt powerpoint presentation ideas layout pdf. This layout presents information on traffic sources, new vs returning, devices, bounce rate, sessions. It is also available for immediate download and adjustment. So, changes can be made in the color, design, graphics or any other component to create a unique layout.
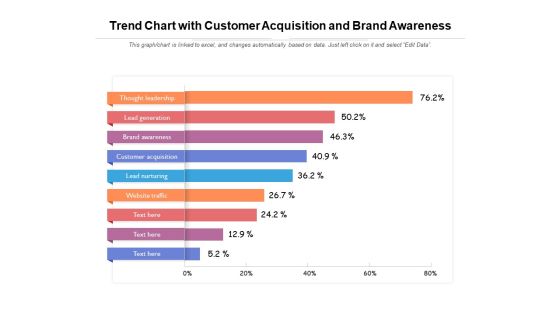
Trend Chart With Customer Acquisition And Brand Awareness Ppt PowerPoint Presentation Show Samples PDF
Pitch your topic with ease and precision using this trend chart with customer acquisition and brand awareness ppt powerpoint presentation show samples pdf. This layout presents information on thought leadership, lead generation, brand awareness, customer acquisition, lead nurturing. It is also available for immediate download and adjustment. So, changes can be made in the color, design, graphics or any other component to create a unique layout.
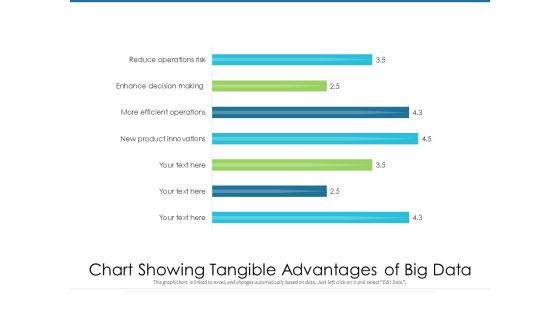
Chart Showing Tangible Advantages Of Big Data Ppt PowerPoint Presentation Infographics Clipart PDF
Pitch your topic with ease and precision using this chart showing tangible advantages of big data ppt powerpoint presentation infographics clipart pdf. This layout presents information on new product innovations, more efficient operations, enhance decision making, reduce operations risk. It is also available for immediate download and adjustment. So, changes can be made in the color, design, graphics or any other component to create a unique layout.

Chart Indicating United States Marine Corps Yearly Attrition Rate Ppt PowerPoint Presentation File Background Images PDF
Pitch your topic with ease and precision using this chart indicating united states marine corps yearly attrition rate ppt powerpoint presentation file background images pdf. This layout presents information on hart indicating united states marine corps yearly attrition rate. It is also available for immediate download and adjustment. So, changes can be made in the color, design, graphics or any other component to create a unique layout.

Product Market Share Chart Of Electronic Company Ppt Gallery Graphic Tips PDF
This slide shows the percentage of market share graph of electronic company products. It includes mobile phone, laptop, tablet, computer and others devices. Pitch your topic with ease and precision using this Product Market Share Chart Of Electronic Company Ppt Gallery Graphic Tips PDF. This layout presents information on Mobile Phone, Computer, Laptop, Tablet. It is also available for immediate download and adjustment. So, changes can be made in the color, design, graphics or any other component to create a unique layout.
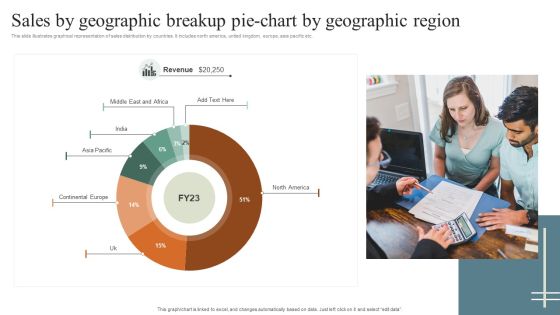
Sales By Geographic Breakup Pie Chart By Geographic Region Rules PDF
This slide illustrates graphical representation of sales distribution by countries. It includes north america, united kingdom, europe, asia pacific etc. Pitch your topic with ease and precision using this Sales By Geographic Breakup Pie Chart By Geographic Region Rules PDF. This layout presents information on Sales By Geographic, Geographic Region. It is also available for immediate download and adjustment. So, changes can be made in the color, design, graphics or any other component to create a unique layout.

5 Years Comparative Analysis Chart Ppt PowerPoint Presentation Complete Deck With Slides
Improve your presentation delivery using this 5 Years Comparative Analysis Chart Ppt PowerPoint Presentation Complete Deck With Slides. Support your business vision and objectives using this well-structured PPT deck. This template offers a great starting point for delivering beautifully designed presentations on the topic of your choice. Comprising twenty slides this professionally designed template is all you need to host discussion and meetings with collaborators. Each slide is self-explanatory and equipped with high-quality graphics that can be adjusted to your needs. Therefore, you will face no difficulty in portraying your desired content using this PPT slideshow. This PowerPoint slideshow contains every important element that you need for a great pitch. It is not only editable but also available for immediate download and utilization. The color, font size, background, shapes everything can be modified to create your unique presentation layout. Therefore, download it now.
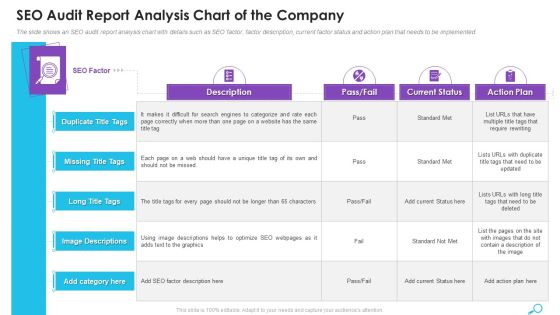
SEO Audit Report Analysis Chart Of The Company Ppt Infographic Template Microsoft PDF
The slide shows an SEO audit report analysis chart with details such as SEO factor, factor description, current factor status and action plan that needs to be implemented. Deliver an awe inspiring pitch with this creative seo audit report analysis chart of the company ppt infographic template microsoft pdf bundle. Topics like seo audit report analysis chart of the company can be discussed with this completely editable template. It is available for immediate download depending on the needs and requirements of the user.

Client Onboarding Journey Impact On Business Customer Onboarding Team Hierarchical Chart Background PDF
This slide showcases structure of customer onboarding team which includes marketing, support team and sales manager. It further includes digital and affiliate marketing executive, onboarding and training specialist. This Client Onboarding Journey Impact On Business Customer Onboarding Team Hierarchical Chart Background PDF is perfect for any presentation, be it in front of clients or colleagues. It is a versatile and stylish solution for organizing your meetings. The Client Onboarding Journey Impact On Business Customer Onboarding Team Hierarchical Chart Background PDF features a modern design for your presentation meetings. The adjustable and customizable slides provide unlimited possibilities for acing up your presentation. Slidegeeks has done all the homework before launching the product for you. So, do not wait, grab the presentation templates today
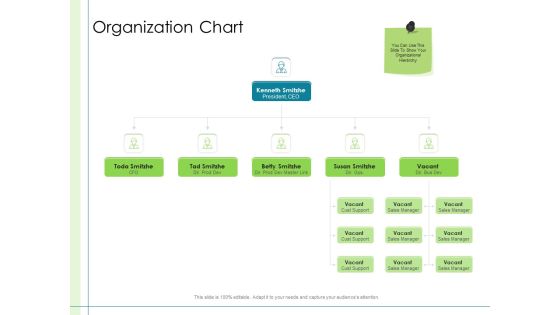
In Depth Business Assessment Organization Chart Ppt PowerPoint Presentation Infographic Template Example Introduction PDF
This is a in depth business assessment organization chart ppt powerpoint presentation infographic template example introduction pdf template with various stages. Focus and dispense information on five stages using this creative set, that comes with editable features. It contains large content boxes to add your information on topics like president, ceo, cust support, sales manager. You can also showcase facts, figures, and other relevant content using this PPT layout. Grab it now.

Water Quality Management Organizational Chart For Water Supply Authority Template PDF
This is a water quality management organizational chart for water supply authority template pdf template with various stages. Focus and dispense information on nine stages using this creative set, that comes with editable features. It contains large content boxes to add your information on topics like post it notes. You can also showcase facts, figures, and other relevant content using this PPT layout. Grab it now.

Venture Capital Funding For Firms Organization Chart Ppt Professional Objects PDF
This is a venture capital funding for firms organization chart ppt professional objects pdf template with various stages. Focus and dispense information on two stages using this creative set, that comes with editable features. It contains large content boxes to add your information on topics like business strategy, financial, customer. You can also showcase facts, figures, and other relevant content using this PPT layout. Grab it now.

Non Rural Water Resource Administration Organizational Chart For Water Supply Authority Slides PDF
This is a non rural water resource administration organizational chart for water supply authority slides pdf template with various stages. Focus and dispense information on nine stages using this creative set, that comes with editable features. It contains large content boxes to add your information on topics like post it notes. You can also showcase facts, figures, and other relevant content using this PPT layout. Grab it now.

Agile Org Chart It Software Development Agile Organizational Structure Designs PDF
This is a agile org chart it software development agile organizational structure designs pdf template with various stages. Focus and dispense information on two stages using this creative set, that comes with editable features. It contains large content boxes to add your information on topics like software development agile organizational structure. You can also showcase facts, figures, and other relevant content using this PPT layout. Grab it now.

Optimize Enterprise Core Organizational Chart With Key People Involved Portrait PDF
This slide presents the organizational structure of the firm with key people involved in managing firm. This is a Optimize Enterprise Core Organizational Chart With Key People Involved Portrait PDF template with various stages. Focus and dispense information on four stages using this creative set, that comes with editable features. It contains large content boxes to add your information on topics like Marketing Operations, Finance Creative. You can also showcase facts, figures, and other relevant content using this PPT layout. Grab it now.

AI Playbook For Business In House AI Team Organizational Chart Download PDF
This is a AI Playbook For Business In House AI Team Organizational Chart Download PDF template with various stages. Focus and dispense information on three stages using this creative set, that comes with editable features. It contains large content boxes to add your information on topics like Senior Executive, Data Science, Team Leader, Data Analyst. You can also showcase facts, figures, and other relevant content using this PPT layout. Grab it now.
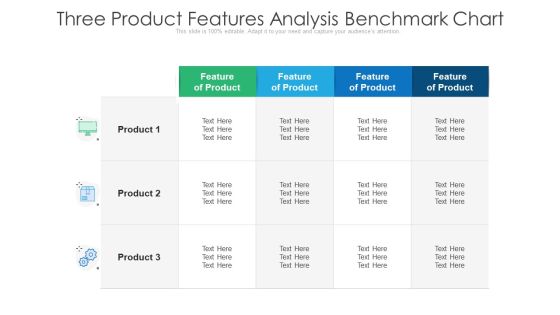
Three Product Features Analysis Benchmark Chart Ppt PowerPoint Presentation Show Topics PDF
Showcasing this set of slides titled three product features analysis benchmark chart ppt powerpoint presentation show topics pdf The topics addressed in these templates are three product features analysis benchmark chart. All the content presented in this PPT design is completely editable. Download it and make adjustments in color, background, font etc. as per your unique business setting.
Scrum Staff Organization Map IT Multi Feature Scrum Team Organization Chart Graphics PDF
This slide provides the glimpse about the multi feature scrum team organizational chart which focuses on product backlog, feature team and various component teams. Deliver and pitch your topic in the best possible manner with this scrum staff organization map it multi feature scrum team organization chart graphics pdf. Use them to share invaluable insights on multi feature scrum team organization chart and impress your audience. This template can be altered and modified as per your expectations. So, grab it now.

Bar Chart Representing IT Risk Control Strategies Risk Management For Banks Themes PDF
This slide shows the graphical presentation of information technology risk management strategies adopted by banks such as mapping rules and requirements, regulatory impact management, data preparation and validation, compliance monitoring, analytical calculations, etc. Pitch your topic with ease and precision using this Bar Chart Representing IT Risk Control Strategies Risk Management For Banks Themes PDF. This layout presents information on IT Risk Management, Compliance Monitoring, Manages IT Risks. It is also available for immediate download and adjustment. So, changes can be made in the color, design, graphics or any other component to create a unique layout.

Trend Of Quarterly Funding For Start Up Project Performance Chart Graphics PDF
This slide depicts investment made in different start up projects for 2 years. It also includes the investment amount, funding quarters in graphical form with a trend line and insights. Pitch your topic with ease and precision using this Trend Of Quarterly Funding For Start Up Project Performance Chart Graphics PDF. This layout presents information on Good Management, Efficient Team, Investment Decreased. It is also available for immediate download and adjustment. So, changes can be made in the color, design, graphics or any other component to create a unique layout.

Bar Chart Showing Various Bullying Activities Ppt PowerPoint Presentation Professional Slide PDF
Pitch your topic with ease and precision using this bar chart showing various bullying activities ppt powerpoint presentation professional slide pdf. This layout presents information on unjustified criticism or complaints, deliberately excluding someone from workplace activities, deliberately denying access to information or other resources, verbal abusing, humiliating a person through gestures, sarcasm, teasing and insults in front of others, spreading rumors about someone. It is also available for immediate download and adjustment. So, changes can be made in the color, design, graphics or any other component to create a unique layout.

Ppt Purple Piece Live Connections In Linear Process Work Flow Chart PowerPoint Templates
PPT purple piece live connections in linear process work flow chart powerpoint Templates-Use this PowerPoint Diagram to illustrate how Linear Flow process and its components work. This Purple part which is being highlighted out of all combined Puzzles will let you explain the Beginning component of process and will help you to understand the whole mechanism of the procedure.-Can be used for presentations on abstract, algorithm, arrow, arrow, chart, block, block, diagram, business, chart, color, connection, design, development, diagram, direction, element, flow, flow, Chart, flow,diagram\n,flowchart\n,graph\n,kind,of,diagram\n,linear\n,linear,diagram\n,management\n,model\n,module\n,motion\n,organization\n,plan\n,process\n,process,arrows\n,process,chart\n,process,diagram\n,process,flow\n,program\n,section,segment,set,sign,solution,strategy,symbol-PPT purple piece live connections in linear process work flow chart powerpoint Templates

Quarterly Non Profit Marketing Strategy For Fundraising Campaign Performance Chart Diagrams PDF
This slide depicts different strategies applied annually to gain investment for non profit organizations. It includes direct mail, event, e-mail, social media and content marketing tactics. Pitch your topic with ease and precision using this Quarterly Non Profit Marketing Strategy For Fundraising Campaign Performance Chart Diagrams PDF. This layout presents information on Marketing Strategies, Event Marketing, Social Media. It is also available for immediate download and adjustment. So, changes can be made in the color, design, graphics or any other component to create a unique layout.
Revenue Chart Of Abc Bank Across Global Market Ppt Icon Images PDF
This slide illustrates information about revenue generated by ABC bank in last eight years across global market. Continuous digitalization is the main contributing factor for the same. Pitch your topic with ease and precision using this Revenue Chart Of Abc Bank Across Global Market Ppt Icon Images PDF. This layout presents information on Continuous Digitalization, 2016 To 2023, Revenue. It is also available for immediate download and adjustment. So, changes can be made in the color, design, graphics or any other component to create a unique layout.
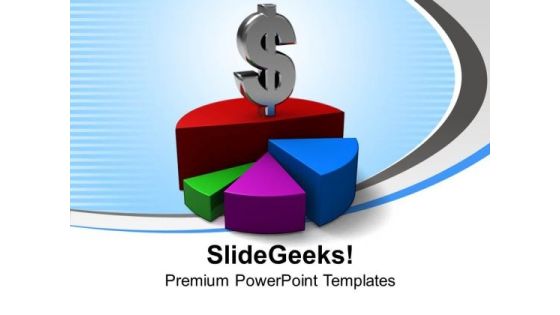
Pie Chart With Dollar Sign Business PowerPoint Templates And PowerPoint Themes 1112
Pie Chart With Dollar Sign Business PowerPoint Templates And PowerPoint Themes 1112-This PowerPoint template shows pie chart with dollar sign. Use this Pie Chart Based PowerPoint Template to illustrate the main components required for the Growth of the Company. Now use this template to enlighten your team and colleagues on the critical factors involved. Use our PowerPoint templates to spread the good word, be assured by all you will be keenly heard.-Pie Chart With Dollar Sign Business PowerPoint Templates And PowerPoint Themes 1112-This PowerPoint template can be used for presentations relating to-Pie chart dollar sign, Symbol, Finance, Marketing, Signs, Design

Cost Scrum Kpis Chart And Key Statistics Ppt Layouts Example Introduction PDF
This slide illustrates graphical representation of cost scrum metrics. It provides Projected Hours per story and actual hours per story point and other key statistics. Pitch your topic with ease and precision using this Cost Scrum Kpis Chart And Key Statistics Ppt Layouts Example Introduction PDF. This layout presents information on Projected Hours, Cost Per Story, Metrics, Actual Cost. It is also available for immediate download and adjustment. So, changes can be made in the color, design, graphics or any other component to create a unique layout.
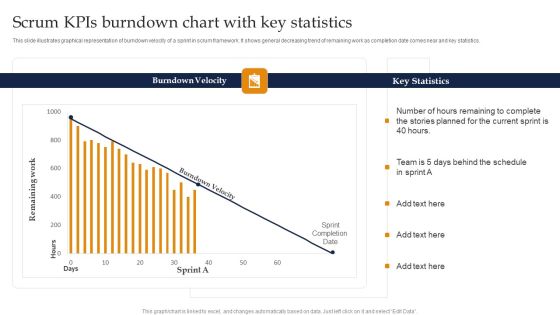
Scrum Kpis Burndown Chart With Key Statistics Ppt Pictures Visual Aids PDF
This slide illustrates graphical representation of burndown velocity of a sprint in scrum framework. It shows general decreasing trend of remaining work as completion date comes near and key statistics. Pitch your topic with ease and precision using this Scrum Kpis Burndown Chart With Key Statistics Ppt Pictures Visual Aids PDF. This layout presents information on Burndown Velocity, Key Statistics, Current Sprint. It is also available for immediate download and adjustment. So, changes can be made in the color, design, graphics or any other component to create a unique layout.

Usage Trend Chart Of Skincare Product Market Ppt Slides Graphics Download PDF
This slide shows market trend graph of skincare product usage in four quarters. It also indicates that product A is most preferred by the customers. Pitch your topic with ease and precision using this Usage Trend Chart Of Skincare Product Market Ppt Slides Graphics Download PDF. This layout presents information on Trend Product, Skincare Product, Quarter Due. It is also available for immediate download and adjustment. So, changes can be made in the color, design, graphics or any other component to create a unique layout.

Company Age Wise Employee Count Column Chart With Key Insights Microsoft PDF
This slide illustrates employee count by age to find the recruitment rate for company. It includes aspects such as the number of employees and age.Pitch your topic with ease and precision using this Company Age Wise Employee Count Column Chart With Key Insights Microsoft PDF. This layout presents information on Employees Working, Total Workforce, Require Replacement. It is also available for immediate download and adjustment. So, changes can be made in the color, design, graphics or any other component to create a unique layout.
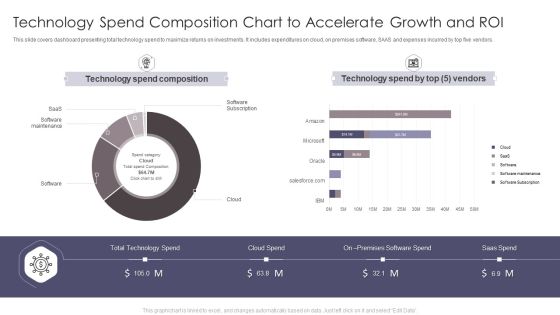
Technology Spend Composition Chart To Accelerate Growth And Roi Summary PDF
This slide covers dashboard presenting total technology spend to maximize returns on investments. It includes expenditures on cloud, on premises software, SAAS and expenses incurred by top five vendors. Pitch your topic with ease and precision using this Technology Spend Composition Chart To Accelerate Growth And Roi Summary PDF. This layout presents information on Technology Spend Composition, Technology Spend. It is also available for immediate download and adjustment. So, changes can be made in the color, design, graphics or any other component to create a unique layout.

Area Chart Employee Performance Management System To Enhance Workforce Productivity Ideas PDF
This Area Chart Employee Performance Management System To Enhance Workforce Productivity Ideas PDF from Slidegeeks makes it easy to present information on your topic with precision. It provides customization options, so you can make changes to the colors, design, graphics, or any other component to create a unique layout. It is also available for immediate download, so you can begin using it right away. Slidegeeks has done good research to ensure that you have everything you need to make your presentation stand out. Make a name out there for a brilliant performance.

Executing Automotive Marketing Tactics For Sales Boost Doughnut Chart Professional PDF
This Executing Automotive Marketing Tactics For Sales Boost Doughnut Chart Professional PDF from Slidegeeks makes it easy to present information on your topic with precision. It provides customization options, so you can make changes to the colors, design, graphics, or any other component to create a unique layout. It is also available for immediate download, so you can begin using it right away. Slidegeeks has done good research to ensure that you have everything you need to make your presentation stand out. Make a name out there for a brilliant performance.

Business Comparative Performance Chart Vector Icon Ppt PowerPoint Presentation File Slide Download PDF
Pitch your topic with ease and precision using this business comparative performance chart vector icon ppt powerpoint presentation file slide download pdf. This layout presents information on business comparative performance chart vector icon. It is also available for immediate download and adjustment. So, changes can be made in the color, design, graphics or any other component to create a unique layout.

Product Review Description Donut Chart Ppt PowerPoint Presentation Gallery Deck PDF
The given below slide depicts the brief performance overview of product through customers review to modify and inculcate new features. It constitutes of top feedback based on affordability, suitability, convenience, uniqueness etc. Showcasing this set of slides titled Product Review Description Donut Chart Ppt PowerPoint Presentation Gallery Deck PDF. The topics addressed in these templates are Product Details, Key Insights, Product Affordable, Customer Believes. All the content presented in this PPT design is completely editable. Download it and make adjustments in color, background, font etc. as per your unique business setting.
Food Company Financial Performance Summary Historical Food Product Sales Chart Icons PDF
The following slide shows the comparative sales growth of agricultural products and processed foods. It shows the product sales from more than three decades to assess the change in demand of company products. This Food Company Financial Performance Summary Historical Food Product Sales Chart Icons PDF from Slidegeeks makes it easy to present information on your topic with precision. It provides customization options, so you can make changes to the colors, design, graphics, or any other component to create a unique layout. It is also available for immediate download, so you can begin using it right away. Slidegeeks has done good research to ensure that you have everything you need to make your presentation stand out. Make a name out there for a brilliant performance.

5 Years Revenue Comparative Analysis Chart Icon Ppt Inspiration Diagrams PDF
Presenting 5 Years Revenue Comparative Analysis Chart Icon Ppt Inspiration Diagrams PDF to dispense important information. This template comprises three stages. It also presents valuable insights into the topics including 5 Years, Revenue Comparative, Analysis Chart, Icon. This is a completely customizable PowerPoint theme that can be put to use immediately. So, download it and address the topic impactfully.

5 Years Employee Performance Comparative Analysis Chart Icon Ppt Portfolio Objects PDF
Presenting 5 Years Employee Performance Comparative Analysis Chart Icon Ppt Portfolio Objects PDF to dispense important information. This template comprises three stages. It also presents valuable insights into the topics including 5 Years, Employee Performance, Comparative Analysis, Chart Icon. This is a completely customizable PowerPoint theme that can be put to use immediately. So, download it and address the topic impactfully.

Company Competitors Analysis Chart Market Share And Return On Equity Ppt PowerPoint Presentation Picture
This is a company competitors analysis chart market share and return on equity ppt powerpoint presentation picture. This is a seven stage process. The stages in this process are competitive analysis, benchmark competition, competition landscape.

 Home
Home