Turnover Dashboard
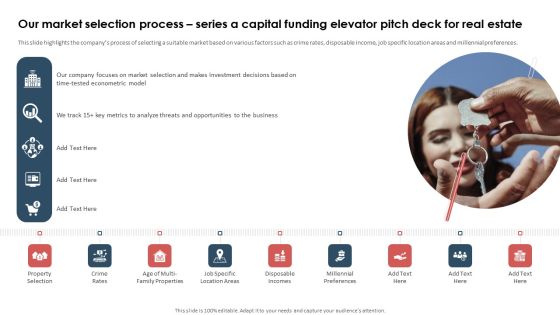
Our Market Selection Process Series A Capital Funding Elevator Pitch Deck For Real Estate Professional PDF
This slide highlights the companys process of selecting a suitable market based on various factors such as crime rates, disposable income, job specific location areas and millennial preferences. Here you can discover an assortment of the finest PowerPoint and Google Slides templates. With these templates, you can create presentations for a variety of purposes while simultaneously providing your audience with an eye-catching visual experience. Download Our Market Selection Process Series A Capital Funding Elevator Pitch Deck For Real Estate Professional PDF to deliver an impeccable presentation. These templates will make your job of preparing presentations much quicker, yet still, maintain a high level of quality. Slidegeeks has experienced researchers who prepare these templates and write high-quality content for you. Later on, you can personalize the content by editing the Our Market Selection Process Series A Capital Funding Elevator Pitch Deck For Real Estate Professional PDF.

Consolidate And University Statement Of Changes In Reserves One Pager Documents
This one pager covers about income and expenditure with revaluation reserves on particular data in total. Further it covers about surplus and deficit income. Presenting you an exemplary Consolidate And University Statement Of Changes In Reserves One Pager Documents. Our one-pager comprises all the must-have essentials of an inclusive document. You can edit it with ease, as its layout is completely editable. With such freedom, you can tweak its design and other elements to your requirements. Download this Consolidate And University Statement Of Changes In Reserves One Pager Documents brilliant piece now.

Business Management Kpis Metrics Income Ppt Example File PDF
This is a business management kpis metrics income ppt example file pdf. template with various stages. Focus and dispense information on six stages using this creative set, that comes with editable features. It contains large content boxes to add your information on topics like budgeted income, received income, accounts receivable. You can also showcase facts, figures, and other relevant content using this PPT layout. Grab it now.

Financials Stretch Plan Data Powerpoint Slide Backgrounds
This is a financials stretch plan data powerpoint slide backgrounds. This is a three stage process. The stages in this process are employees, ending cash, change in cash, operating profit, other operating cost expense, customer acquisition cost, gross profit, cost of sales, revenue.

Sales Quarterly Performance Review System Service Support Department Infographics PDF
This slide shows sales customer service division quarterly business review QBR. It provides information about quality, accuracy, absenteeism, attrition, call flow, employee tenure, etc. Pitch your topic with ease and precision using this Sales Quarterly Performance Review System Service Support Department Infographics PDF. This layout presents information on KPI, Goal, Quality Accuracy. It is also available for immediate download and adjustment. So, changes can be made in the color, design, graphics or any other component to create a unique layout.
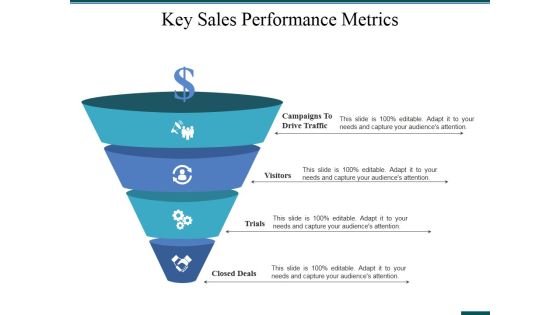
Key Sales Performance Metrics Ppt PowerPoint Presentation Infographic Template Samples
This is a key sales performance metrics ppt powerpoint presentation infographic template samples. This is a four stage process. The stages in this process are campaigns to drive traffic, visitors, trials, closed deals.

Business Sales Key Performance Indicators Report Ppt PowerPoint Presentation Icon Slideshow PDF
Showcasing this set of slides titled business sales key performance indicators report ppt powerpoint presentation icon slideshow pdf. The topics addressed in these templates are business sales key performance indicators report. All the content presented in this PPT design is completely editable. Download it and make adjustments in color, background, font etc. as per your unique business setting.

Cumulative Sales Key Performance Indicators Report Ppt PowerPoint Presentation Model Images PDF
Showcasing this set of slides titled cumulative sales key performance indicators report ppt powerpoint presentation model images pdf. The topics addressed in these templates are cumulative sales key performance indicators report. All the content presented in this PPT design is completely editable. Download it and make adjustments in color, background, font etc. as per your unique business setting.

Reducing Customer Churn Rate With Social Media Marketing Ppt PowerPoint Presentation File Infographics PDF
Mentioned slide outlines a comprehensive social media marketing campaign that can be used to engage with disengaged customers and prevent churn. It provides detailed information about social media platforms such as Facebook, Instagram, YouTube, and LinkedIn along with target audience, content type, posting frequency, and KPI metrics. From laying roadmaps to briefing everything in detail, our templates are perfect for you. You can set the stage with your presentation slides. All you have to do is download these easy-to-edit and customizable templates. Reducing Customer Churn Rate With Social Media Marketing Ppt PowerPoint Presentation File Infographics PDF will help you deliver an outstanding performance that everyone would remember and praise you for. Do download this presentation today.

Force Field Analysis Template 1 Ppt PowerPoint Presentation Professional
This is a force field analysis template 1 ppt powerpoint presentation professional. This is a eight stage process. The stages in this process are increase revenue, increase market share, market segment by customers, generate economies of scale, upset business partners, damage corporate image, cost risks, driving sales from current.
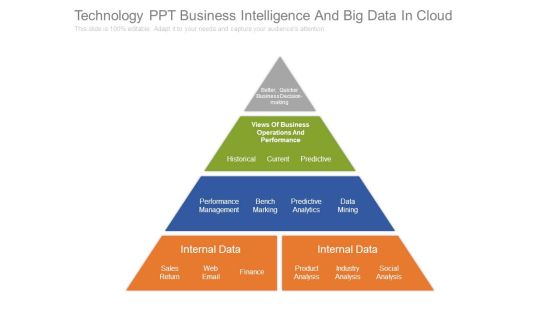
Technology Ppt Business Intelligence And Big Data In Cloud
This is a technology ppt business intelligence and big data in cloud. This is a four stage process. The stages in this process are better, quicker business decision making, views of business operations and performance, historical, current, predictive, performance management, bench marking, predictive analytics, data mining, internal data, sales return, web email, finance, product analysis, industry analysis, social analysis.

Technology Company Quarterly Revenue Projections And Retention Rate Clipart PDF
This slide covers quarter 4 tech company product revenue estimation. It also includes kpis such as net revenue retention rates, total customers, data marketplace listing, customer satisfaction and net promoter score. Pitch your topic with ease and precision using this Technology Company Quarterly Revenue Projections And Retention Rate Clipart PDF. This layout presents information on Product Revenue, Total Customers, Data Marketplace Listings. It is also available for immediate download and adjustment. So, changes can be made in the color, design, graphics or any other component to create a unique layout.

Conducting Monetary Inclusion With Mobile Financial Services Why We Need Rules PDF
Presenting Conducting Monetary Inclusion With Mobile Financial Services Why We Need Rules PDF to provide visual cues and insights. Share and navigate important information on one stage that need your due attention. This template can be used to pitch topics like Highly Adaptable, Increase Retention, Reduce Churn. In addtion, this PPT design contains high resolution images, graphics, etc, that are easily editable and available for immediate download.

Marketers Guide To Data Analysis Optimization Tracking Leads Generated Through Social Media Microsoft PDF
This slide covers an overview of social media leads for increasing customer conversion rates. It also includes strategies to generate more social media leads, such as optimizing your profile, using social lead ads, and offering the right incentive. Want to ace your presentation in front of a live audience Our Marketers Guide To Data Analysis Optimization Tracking Leads Generated Through Social Media Microsoft PDF can help you do that by engaging all the users towards you. Slidegeeks experts have put their efforts and expertise into creating these impeccable powerpoint presentations so that you can communicate your ideas clearly. Moreover, all the templates are customizable, and easy to edit and downloadable. Use these for both personal and commercial use.

Sales Performance Monitoring Order Number Detection Icon Ppt Summary Rules PDF
Persuade your audience using this Sales Performance Monitoring Order Number Detection Icon Ppt Summary Rules PDF. This PPT design covers four stages, thus making it a great tool to use. It also caters to a variety of topics including Sales Performance, Monitoring Order, Number Detection, Icon. Download this PPT design now to present a convincing pitch that not only emphasizes the topic but also showcases your presentation skills.

Predictive Analytics In The Age Of Big Data Methods Of Data Clustering In Predictive Analytics Topics PDF
This slide outlines the two primary information clustering methods used in the predictive analytics clustering model. The methods include K-means and K-nearest neighbor clustering, including the working of both approaches. Slidegeeks is here to make your presentations a breeze with Predictive Analytics In The Age Of Big Data Methods Of Data Clustering In Predictive Analytics Topics PDF With our easy to use and customizable templates, you can focus on delivering your ideas rather than worrying about formatting. With a variety of designs to choose from, you are sure to find one that suits your needs. And with animations and unique photos, illustrations, and fonts, you can make your presentation pop. So whether you are giving a sales pitch or presenting to the board, make sure to check out Slidegeeks first.

Maintaining Financial Health Of Organization Income Statement Analysis Themes PDF
This slide showcases analyzing income statement for supporting financial health management initiatives. It provides details about revenue, operating expenses, net income, accounting periods, gross margin, etc. The Maintaining Financial Health Of Organization Income Statement Analysis Themes PDF is a compilation of the most recent design trends as a series of slides. It is suitable for any subject or industry presentation, containing attractive visuals and photo spots for businesses to clearly express their messages. This template contains a variety of slides for the user to input data, such as structures to contrast two elements, bullet points, and slides for written information. Slidegeeks is prepared to create an impression.
Gear Magnify Ppt PowerPoint Presentation Example
This is a gear magnify ppt powerpoint presentation example. This is a one stage process. The stages in this process are business, strategy, marketing, gear magnify, management.

Magnify Ppt PowerPoint Presentation Templates
This is a magnify ppt powerpoint presentation templates. This is a five stage process. The stages in this process are business, marketing, management, planning, magnifier glass.

Magnifying Glass Opening Retail Store In Untapped Industry For Sales Growth Sample PDF
Do you have to make sure that everyone on your team knows about any specific topic I yes, then you should give Magnifying Glass Opening Retail Store In Untapped Industry For Sales Growth Sample PDF a try. Our experts have put a lot of knowledge and effort into creating this impeccable Magnifying Glass Opening Retail Store In Untapped Industry For Sales Growth Sample PDF. You can use this template for your upcoming presentations, as the slides are perfect to represent even the tiniest detail. You can download these templates from the Slidegeeks website and these are easy to edit. So grab these today.
Sales Order Processing Performance Tracking Indicators Graphics PDF
The following slide showcases key performance indicators for sales order fulfilment to meet customer expectations, specifications, deliver goods on time, compare order fulfilment against past orders. It includes elements such as category, key performance indicators, expected rate and actual rate. Showcasing this set of slides titled Sales Order Processing Performance Tracking Indicators Graphics PDF. The topics addressed in these templates are Customer Metrics, Inbound Metrics, Financial Metrics. All the content presented in this PPT design is completely editable. Download it and make adjustments in color, background, font etc. as per your unique business setting.
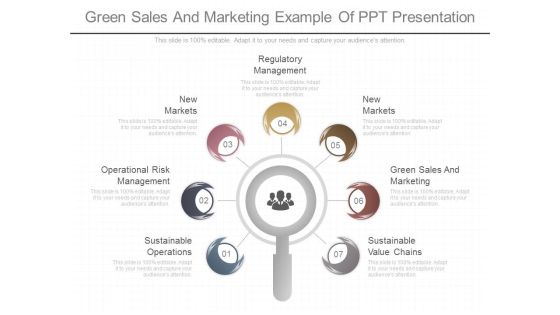
Green Sales And Marketing Example Of Ppt Presentation
This is a green sales and marketing example of ppt presentation. This is a seven stage process. The stages in this process are sustainable operations, operational risk management, markets new, regulatory management, markets markets new, green sales and marketing, sustainable value chains.
Global Market Intelligence With Competitiveness And Diversification Ppt PowerPoint Presentation Icon Designs Download
Presenting this set of slides with name global market intelligence with competitiveness and diversification ppt powerpoint presentation icon designs download. This is a six stage process. The stages in this process are global competitiveness basics, diversifying sources of income, manageable risk, demanding customers. This is a completely editable PowerPoint presentation and is available for immediate download. Download now and impress your audience.
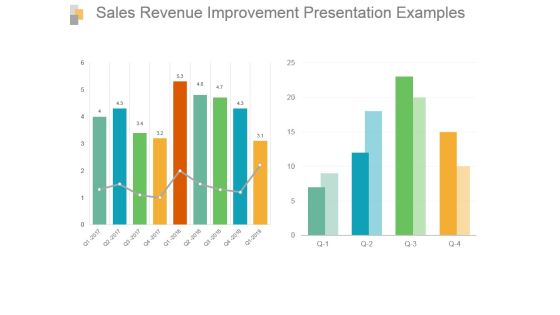
Sales Revenue Improvement Presentation Examples
This is a sales revenue improvement presentation examples. This is a two stage process. The stages in this process are bar graph, growth, sales, data, analysis.

Customer Behavioral Data And Analytics Marketing Funnel Template Background PDF
This is a customer behavioral data and analytics marketing funnel template background pdf template with various stages. Focus and dispense information on three stages using this creative set, that comes with editable features. It contains large content boxes to add your information on topics like marketing funnel template. You can also showcase facts, figures, and other relevant content using this PPT layout. Grab it now.

Data Warehousing IT Data Warehouse Vs Data Mart Ppt Infographic Template Background Image PDF
This slide represents a comparison between data warehouse and data mart and how data marts can be designed for sole operational reasons. Deliver an awe inspiring pitch with this creative data warehousing it data warehouse vs data mart ppt infographic template background image pdf bundle. Topics like marketing, finance, sales, formatted and processed data, data mart, data warehouse can be discussed with this completely editable template. It is available for immediate download depending on the needs and requirements of the user.

5 Steps To Effective Business Planning Ppt PowerPoint Presentation Model
This is a 5 steps to effective business planning ppt powerpoint presentation model. This is a five stage process. The stages in this process are success, business, technology, marketing, strategy, gears, magnifier.

Key Performance Indicators For Business Sales Analysis Ppt PowerPoint Presentation Infographic Template Introduction PDF
Presenting key performance indicators for business sales analysis ppt powerpoint presentation infographic template introduction pdf to dispense important information. This template comprises five stages. It also presents valuable insights into the topics including average purchase value, sales opportunities, sales bookings, average profit margin, sales growth. This is a completely customizable PowerPoint theme that can be put to use immediately. So, download it and address the topic impactfully.
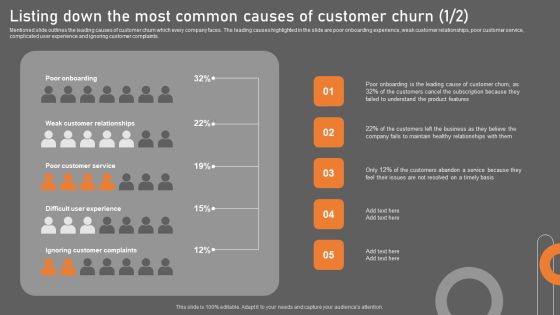
Listing Down The Most Common Causes Of Customer Churn Portrait PDF
Mentioned slide outlines the leading causes of customer churn which every company faces. The leading causes highlighted in the slide are poor onboarding experience, weak customer relationships, poor customer service, complicated user experience and ignoring customer complaints. The Listing Down The Most Common Causes Of Customer Churn Portrait PDF is a compilation of the most recent design trends as a series of slides. It is suitable for any subject or industry presentation, containing attractive visuals and photo spots for businesses to clearly express their messages. This template contains a variety of slides for the user to input data, such as structures to contrast two elements, bullet points, and slides for written information. Slidegeeks is prepared to create an impression.
Vector Of Sales Planning To Ascertain Annual Financial Goals Ppt PowerPoint Presentation Icon Infographics PDF
Presenting this set of slides with name vector of sales planning to ascertain annual financial goals ppt powerpoint presentation icon infographics pdf. This is a three stage process. The stages in this process are vector of sales planning to ascertain annual financial goals. This is a completely editable PowerPoint presentation and is available for immediate download. Download now and impress your audience.
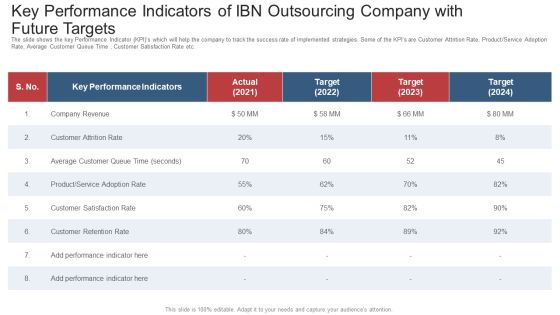
Key Performance Indicators Of Ibn Outsourcing Company With Future Targets Ppt Ideas Brochure PDF
The slide shows the key Performance Indicator KPIs which will help the company to track the success rate of implemented strategies. Some of the KPIs are Customer Attrition Rate, Product or Service Adoption Rate, Average Customer Queue Time , Customer Satisfaction Rate etc. Deliver an awe-inspiring pitch with this creative key performance indicators of ibn outsourcing company with future targets ppt ideas brochure pdf. bundle. Topics like key performance indicators, company revenue, customer attrition rate, performance, target can be discussed with this completely editable template. It is available for immediate download depending on the needs and requirements of the user.

Product Comparison Ppt PowerPoint Presentation Styles Background Images
This is a product comparison ppt powerpoint presentation styles background images. This is a six stage process. The stages in this process are indirect competitor, company, feature, business, marketing.

Business Revenues Document For Audit Vector Icon Ppt PowerPoint Presentation Layouts Format PDF
Persuade your audience using this business revenues document for audit vector icon ppt powerpoint presentation layouts format pdf. This PPT design covers three stages, thus making it a great tool to use. It also caters to a variety of topics including business revenues document for audit vector icon. Download this PPT design now to present a convincing pitch that not only emphasizes the topic but also showcases your presentation skills.

Key Performance Indicators Of Ibn Outsourcing Company With Future Targets Guidelines PDF
The slide shows the key Performance Indicator KPIs which will help the company to track the success rate of implemented strategies. Some of the KPIs are Customer Attrition Rate, Product or Service Adoption Rate, Average Customer Queue Time , Customer Satisfaction Rate etc. Deliver an awe-inspiring pitch with this creative key performance indicators of ibn outsourcing company with future targets guidelines pdf. bundle. Topics like company revenue, customer attrition rate, customer retention rate, performance, customer retention rate can be discussed with this completely editable template. It is available for immediate download depending on the needs and requirements of the user.

Product Data Insights Analysis Sheet Infographics PDF
The following slide depicts the annual performance of multiple products in terms of profit or loss to track whether they are doing well or not. The analysis sheet includes element such as cost, units, selling price, sales etc. Pitch your topic with ease and precision using this Product Data Insights Analysis Sheet Infographics PDF. This layout presents information on Unit Sold, Selling Price, Total Sales. It is also available for immediate download and adjustment. So, changes can be made in the color, design, graphics or any other component to create a unique layout.

Customer Acquisition Framework Ppt PowerPoint Presentation Example
This is a customer acquisition framework ppt powerpoint presentation example. This is a six stage process. The stages in this process are marketing team, sales team, customer success team, sales funnel, customer lifecycle.
Five Key Performance Indicators Of Sales Team With Icons Ppt PowerPoint Presentation Gallery Introduction PDF
Persuade your audience using this five key performance indicators of sales team with icons ppt powerpoint presentation gallery introduction pdf. This PPT design covers five stages, thus making it a great tool to use. It also caters to a variety of topics including sales, win, revenue. Download this PPT design now to present a convincing pitch that not only emphasizes the topic but also showcases your presentation skills.

How To Make Sure Weekly Sales Performance Reports Are Effective Ideas PDF
The following slide exhibits factors to ensure that sales people treat data as more than just numbers on spreadsheet. It presents information related to translating information, sharing performance, etc. Presenting How To Make Sure Weekly Sales Performance Reports Are Effective Ideas PDF to dispense important information. This template comprises three stages. It also presents valuable insights into the topics including Share Performance Team, Team Data, Translate Data, Actionable Steps. This is a completely customizable PowerPoint theme that can be put to use immediately. So, download it and address the topic impactfully.

Decision Support System Data Warehouse Vs Data Mart Ppt Gallery Portrait PDF
This slide represents a comparison between data warehouse and data mart and how data marts can be designed for sole operational reasons. This is a Decision Support System Data Warehouse Vs Data Mart Ppt Gallery Portrait PDF template with various stages. Focus and dispense information on one stages using this creative set, that comes with editable features. It contains large content boxes to add your information on topics like Data Mart, Sales, Marketing, Finance. You can also showcase facts, figures, and other relevant content using this PPT layout. Grab it now.

Data Mining Segmentation And Analysis Ppt PowerPoint Presentation Slides
This is a data mining segmentation and analysis ppt powerpoint presentation slides. This is a four stage process. The stages in this process are cluster analysis, cluster examination, cluster investigation.

Data Lineage Implementation Typical Use Cases Of Data Lineage Pictures PDF
This slide outlines the typical use cases of data lineage that include performing root-cause analysis, generating reports, deprecating columns, and setting data retention policies. Data lineage enables a broad range of information use applications for IT departments and various stakeholder groups. Make sure to capture your audiences attention in your business displays with our gratis customizable Data Lineage Implementation Typical Use Cases Of Data Lineage Pictures PDF. These are great for business strategies, office conferences, capital raising or task suggestions. If you desire to acquire more customers for your tech business and ensure they stay satisfied, create your own sales presentation with these plain slides.
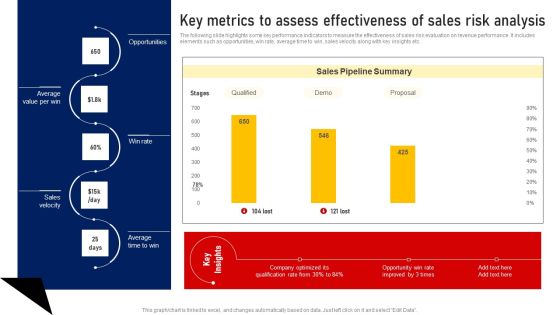
Performing Sales Risk Analysis Procedure Key Metrics To Assess Effectiveness Of Sales Risk Analysis Brochure PDF
The following slide highlights some key performance indicators to measure the effectiveness of sales risk evaluation on revenue performance. It includes elements such as opportunities, win rate, average time to win, sales velocity along with key insights etc. Get a simple yet stunning designed Performing Sales Risk Analysis Procedure Key Metrics To Assess Effectiveness Of Sales Risk Analysis Brochure PDF. It is the best one to establish the tone in your meetings. It is an excellent way to make your presentations highly effective. So, download this PPT today from Slidegeeks and see the positive impacts. Our easy to edit Performing Sales Risk Analysis Procedure Key Metrics To Assess Effectiveness Of Sales Risk Analysis Brochure PDF can be your go to option for all upcoming conferences and meetings. So, what are you waiting for Grab this template today.
Sales KPIS With Revenue In Last 12 Weeks Ppt PowerPoint Presentation Infographic Template Icons PDF
Presenting this set of slides with name sales kpis with revenue in last 12 weeks ppt powerpoint presentation infographic template icons pdf. The topics discussed in these slides are sales growth, current period, previous period, sales revenue, sales representative, last 12 weeks. This is a completely editable PowerPoint presentation and is available for immediate download. Download now and impress your audience.

Key Metrics Presentation Powerpoint Example
This is a key metrics presentation powerpoint example. This is a two stage process. The stages in this process are residential customer churn, broadband availability.

Sales Kpi Performance Summary Ppt PowerPoint Presentation Infographic Template Elements
This is a sales kpi performance summary ppt powerpoint presentation infographic template elements. This is a seven stage process. The stages in this process are revenue comparison, quantity comparison, product sales mix, regional sales mix, budget.
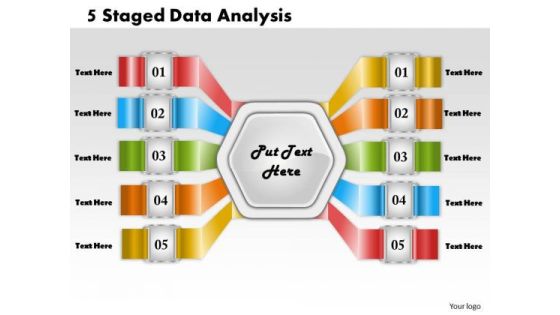
Business Strategy 5 Staged Data Analysis Strategic Plan Example Ppt Slide
Double Your Chances With Our business strategy 5 staged data analysis strategic plan example ppt slide Powerpoint Templates. The Value Of Your Thoughts Will Increase Two-Fold. Charm The Audience With Your Thoughts. Add Our Process and Flows Powerpoint Templates And They Will Be Dotty For You.

Team Goals Ppt PowerPoint Presentation Portfolio Information
This is a team goals ppt powerpoint presentation portfolio information. This is a four stage process. The stages in this process are engineering, product, marketing, sales, support.
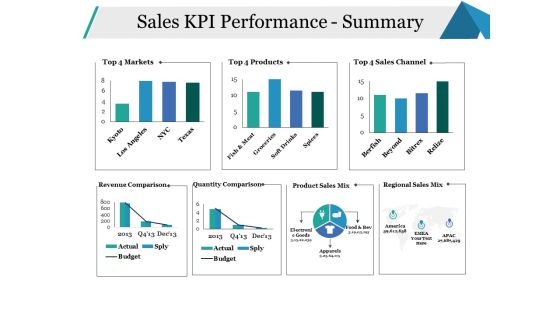
Sales KPI Performance Summary Ppt PowerPoint Presentation Infographics Model
This is a sales kpi performance summary ppt powerpoint presentation infographics model. This is a seven stage process. The stages in this process are sales channel, revenue comparison, quantity comparison, business, marketing.
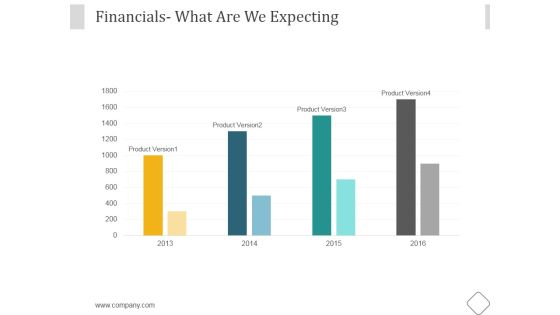
Financials Ppt PowerPoint Presentation Samples
This is a financials ppt powerpoint presentation samples. This is a four stage process. The stages in this process are business, marketing, management, financial, expecting.

Trends In Sales Diagram Ppt Examples Slides
This is a trends in sales diagram ppt examples slides. This is a five stage process. The stages in this process are event roi, single platform, sales data and analytics, art of follow ups, mobility, trends in sales.

Stock Market Research Report Income Statement Of Target Company Background PDF
The purpose of the following slide is to display the organizations profit and loss statements Key Performance Indicators such as Net Sales, Expenses, EBITDA and Profit before and after tax. Deliver and pitch your topic in the best possible manner with this stock market research report income statement of target company background pdf. Use them to share invaluable insights on revenue, gross profit, operating expenses, research and development, sales and marketing and impress your audience. This template can be altered and modified as per your expectations. So, grab it now.
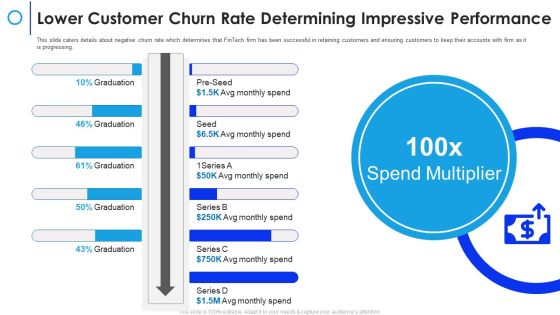
Financial Technology Firm Lower Customer Churn Rate Determining Impressive Performance Infographics PDF
This slide caters details about negative churn rate which determines that FinTech firm has been successful in retaining customers and ensuring customers to keep their accounts with firm as it is progressing. Deliver an awe inspiring pitch with this creative financial technology firm lower customer churn rate determining impressive performance infographics pdf bundle. Topics like lower customer churn rate determining impressive performance can be discussed with this completely editable template. It is available for immediate download depending on the needs and requirements of the user.

Estimated Sales Key Performance Indicators In The Company After Strategy Implementation Mockup PDF
This slide shows the future estimated Sales Key Performance Indicators of the company after adopting strategy. These stats are related to Sales Growth, Average Sales Cycle Length, Profit Margin, Customer Churn Rate, Overall Company Sales etc. from the years 2020 to 2022 along with key takeaways. Deliver an awe inspiring pitch with this creative estimated sales key performance indicators in the company after strategy implementation mockup pdf bundle. Topics like performance indicators, sales growth, profit margin, overall company sales, 2020 2022 can be discussed with this completely editable template. It is available for immediate download depending on the needs and requirements of the user.
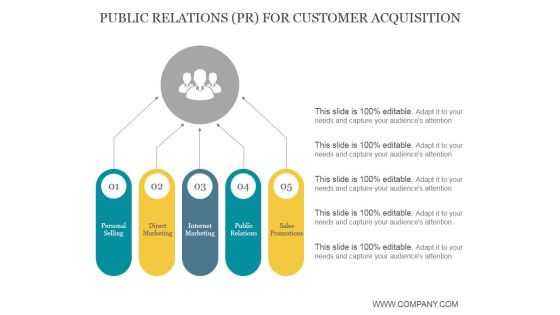
Public Relations Pr For Customer Acquisition Ppt PowerPoint Presentation Backgrounds
This is a public relations pr for customer acquisition ppt powerpoint presentation backgrounds. This is a five stage process. The stages in this process are personal selling, direct marketing, internet marketing, public relations, sales promotions.

Consumer Statistics Report With Churn Prediction And Action Ppt PowerPoint Presentation Gallery Templates PDF
Presenting this set of slides with name consumer statistics report with churn prediction and action ppt powerpoint presentation gallery templates pdf. The topics discussed in these slides are probability, transaction, action. This is a completely editable PowerPoint presentation and is available for immediate download. Download now and impress your audience.
Sales Key Performance Indicators Ppt PowerPoint Presentation Professional Portfolio Cpb
Presenting this set of slides with name sales key performance indicators ppt powerpoint presentation professional portfolio cpb. This is an editable Powerpoint two stages graphic that deals with topics like sales key performance indicators to help convey your message better graphically. This product is a premium product available for immediate download and is 100 percent editable in Powerpoint. Download this now and use it in your presentations to impress your audience.
Erp Criteria List Functional Requirement Ppt PowerPoint Presentation Icon Gallery
This is a erp criteria list functional requirement ppt powerpoint presentation icon gallery. This is a five stage process. The stages in this process are functional criteria, marketing, sales planning, marketing planning, product management.

Erp Criteria List Functional Requirement Ppt PowerPoint Presentation Model Outfit
This is a erp criteria list functional requirement ppt powerpoint presentation model outfit. This is a five stage process. The stages in this process are functional criteria, marketing, sales planning, marketing planning, product management.
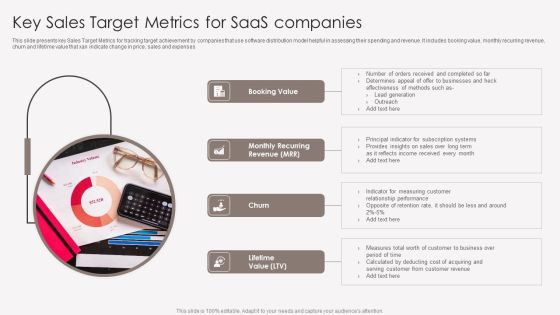
Key Sales Target Metrics For Saas Companies Portrait PDF
This slide presents key Sales Target Metrics for tracking target achievement by companies that use software distribution model helpful in assessing their spending and revenue. It includes booking value, monthly recurring revenue, churn and lifetime value that xan indicate change in price, sales and expenses. Persuade your audience using this Key Sales Target Metrics For Saas Companies Portrait PDF. This PPT design covers four stages, thus making it a great tool to use. It also caters to a variety of topics including Booking Value, Churn, Lifetime Value. Download this PPT design now to present a convincing pitch that not only emphasizes the topic but also showcases your presentation skills.

Formulating Branding Strategy To Enhance Revenue And Sales Kpis To Measure The Success Rate Of Advertising Icons PDF
The following slide outlines multiple key performance indicators used by the marketer to evaluate the effectiveness of an online advertisement campaign. The KPIs are likes, comments, shares, clickthrough rate CTR, open rate, bounce rate, article views, audience engagement rate and subscriber growth. Do you have to make sure that everyone on your team knows about any specific topic I yes, then you should give Formulating Branding Strategy To Enhance Revenue And Sales Kpis To Measure The Success Rate Of Advertising Icons PDF a try. Our experts have put a lot of knowledge and effort into creating this impeccable Formulating Branding Strategy To Enhance Revenue And Sales Kpis To Measure The Success Rate Of Advertising Icons PDF. You can use this template for your upcoming presentations, as the slides are perfect to represent even the tiniest detail. You can download these templates from the Slidegeeks website and these are easy to edit. So grab these today.

 Home
Home