Turnover Dashboard
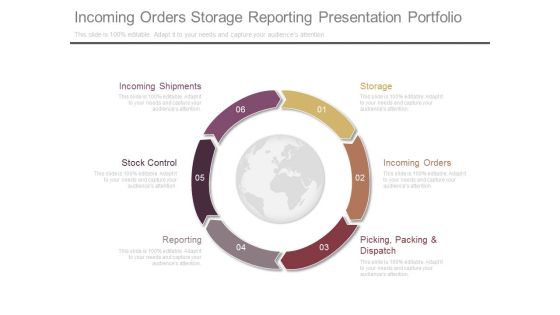
Incoming Orders Storage Reporting Presentation Portfolio
This is a incoming orders storage reporting presentation portfolio. This is a six stage process. The stages in this process are storage, incoming orders, picking packing and dispatch, reporting, stock control, incoming shipments.

Channel Management And Sales Process Ppt Presentation
This is a channel management and sales process ppt presentation. This is a eight stage process. The stages in this process are marketing, business, process and flows.

Reducing Customer Churn Rate With Social Media Marketing Infographics PDF
Mentioned slide outlines a comprehensive social media marketing campaign that can be used to engage with disengaged customers and prevent churn. It provides detailed information about social media platforms such as Facebook, Instagram, YouTube, and LinkedIn along with target audience, content type, posting frequency, and KPI metrics. Slidegeeks has constructed Reducing Customer Churn Rate With Social Media Marketing Infographics PDF after conducting extensive research and examination. These presentation templates are constantly being generated and modified based on user preferences and critiques from editors. Here, you will find the most attractive templates for a range of purposes while taking into account ratings and remarks from users regarding the content. This is an excellent jumping off point to explore our content and will give new users an insight into our top notch PowerPoint Templates.

Data Valuation And Monetization Predicting Customer Churn Probability Through Predictive Analytics Icons PDF
After deploying predictive analytics tool, the firm will become capable in predicting churn probability of various customers on basis of various attributes such as NPS, transaction usage, etc. that are retrieved from customer data.Deliver and pitch your topic in the best possible manner with this Data Valuation And Monetization Predicting Customer Churn Probability Through Predictive Analytics Icons PDF. Use them to share invaluable insights on Transaction, Churn Probability, Comments and impress your audience. This template can be altered and modified as per your expectations. So, grab it now.
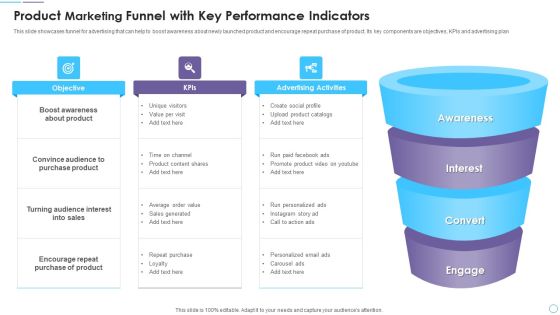
Product Marketing Funnel With Key Performance Indicators Guidelines PDF
This slide showcases funnel for advertising that can help to boost awareness about newly launched product and encourage repeat purchase of product. Its key components are objectives, KPIs and advertising plan. Presenting Product Marketing Funnel With Key Performance Indicators Guidelines PDF to dispense important information. This template comprises four stages. It also presents valuable insights into the topics including Awareness, Interest, Convert, Engage. This is a completely customizable PowerPoint theme that can be put to use immediately. So, download it and address the topic impactfully.
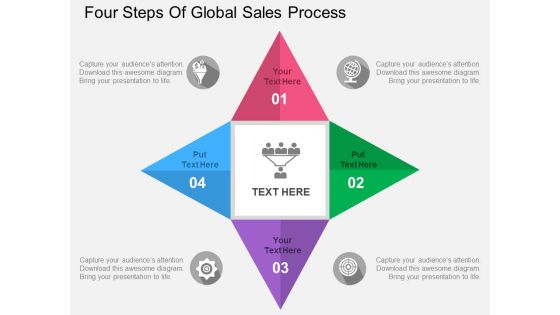
Four Steps Of Global Sales Process Powerpoint Templates
The above PPT slide contains four steps infographic layout. This PPT slide helps to portray steps of global sales process. Download this slide to make professional presentations.

Data And Analysis Ppt PowerPoint Presentation Icon Diagrams
This is a Data And Analysis Ppt PowerPoint Presentation Icon Diagrams. This is a six stage process. The stages in this process are root cause analysis, opportunity analysis, timeline analysis, force field analysis.
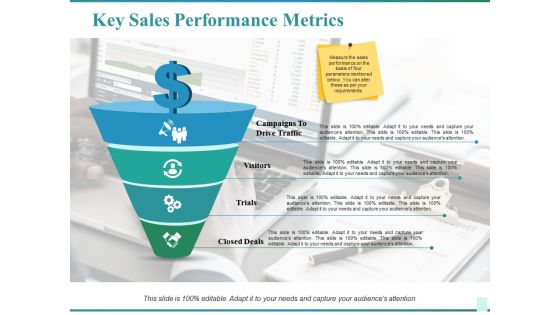
Key Sales Performance Metrics Ppt PowerPoint Presentation Infographics Show
This is a key sales performance metrics ppt powerpoint presentation infographics show. This is a four stage process. The stages in this process are campaigns to drive traffic, visitors, trials, closed deals, business, icons.
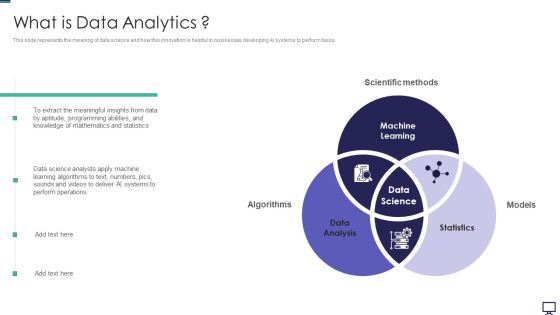
What Is Data Analytics Ppt Professional Slide PDF
This slide represents the meaning of data science and how this innovation is helpful in businesses developing AI systems to perform tasks. Presenting what is data analytics ppt professional slide pdf to provide visual cues and insights. Share and navigate important information on three stages that need your due attention. This template can be used to pitch topics like data analysis, statistics, machine learning. In addtion, this PPT design contains high resolution images, graphics, etc, that are easily editable and available for immediate download.

Role Of Predictive Analytics On Data In Preventing Customer Churn Formats PDF
The firm will use advanced technology such as predictive analytics in order to project the probability of future outcomes, events based on current and historical data. It utilizes different statistical techniques such as machine learning, pattern recognition through data mining, etc. Get a simple yet stunning designed Role Of Predictive Analytics On Data In Preventing Customer Churn Formats PDF. It is the best one to establish the tone in your meetings. It is an excellent way to make your presentations highly effective. So, download this PPT today from Slidegeeks and see the positive impacts. Our easy to edit Role Of Predictive Analytics On Data In Preventing Customer Churn Formats PDF can be your go-to option for all upcoming conferences and meetings. So, what are you waiting for Grab this template today.

Case Competition Reduction In Existing Customer Of Telecommunication Company Key Performance Indicators Ppt Layouts Graphics Pictures PDF
This is a case competition reduction in existing customer of telecommunication company key performance indicators ppt layouts graphics pictures pdf template with various stages. Focus and dispense information on seven stages using this creative set, that comes with editable features. It contains large content boxes to add your information on topics like key performance indicator, subscribers, technology users, average revenue, customer satisfaction level . You can also showcase facts, figures, and other relevant content using this PPT layout. Grab it now.

Elevator Pitch Ppt PowerPoint Presentation Rules
This is a elevator pitch ppt powerpoint presentation rules. This is a three stage process. The stages in this process are business, marketing, management, elevator pitch, strategy.
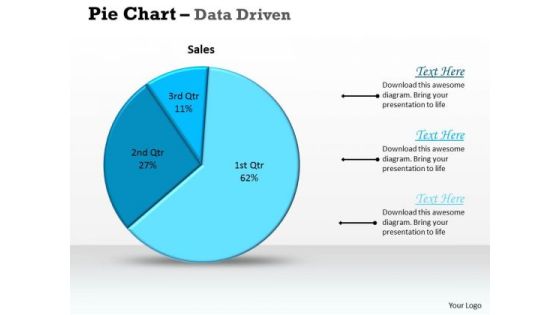
Data Analysis Excel Driven Pie Chart For Sales Process PowerPoint Slides Templates
Deliver The Right Dose With Our data analysis excel driven pie chart for sales process powerpoint slides Templates . Your Ideas Will Get The Correct Illumination.
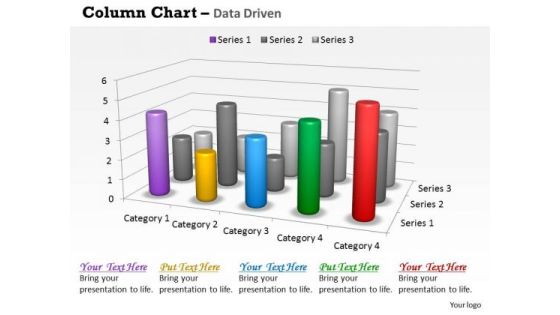
Data Analysis In Excel 3d Survey For Sales Chart PowerPoint Templates
Good Camaraderie Is A Key To Teamwork. Our data analysis in excel 3d survey for sales chart Powerpoint Templates Can Be A Cementing Force.

Income Statement Kpis Company Profile Ppt File Graphics Pictures PDF
Deliver and pitch your topic in the best possible manner with this income statement kpis company profile ppt file graphics pictures pdf. Use them to share invaluable insights on financing cost, expenses, depreciation expense, sales and impress your audience. This template can be altered and modified as per your expectations. So, grab it now.

Customer Data Mining And Analysis Ppt Sample
This is a customer data mining and analysis ppt sample. This is a five stage process. The stages in this process are data mining and analysis, customer data, execute business plan, customer service, sale marketing.

data collection histograms ppt powerpoint presentation example
This is a data collection histograms ppt powerpoint presentation example. This is a six stage process. The stages in this process are business, planning, marketing, histograms, graph.
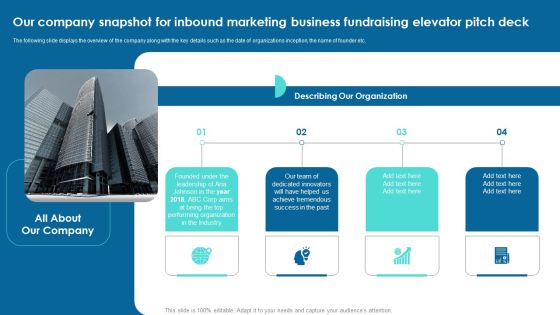
Our Company Snapshot For Inbound Marketing Business Fundraising Elevator Pitch Deck Clipart PDF
The following slide displays the overview of the company along with the key details such as the date of organizations inception, the name of founder etc. Slidegeeks is here to make your presentations a breeze with Our Company Snapshot For Inbound Marketing Business Fundraising Elevator Pitch Deck Clipart PDF With our easy-to-use and customizable templates, you can focus on delivering your ideas rather than worrying about formatting. With a variety of designs to choose from, youre sure to find one that suits your needs. And with animations and unique photos, illustrations, and fonts, you can make your presentation pop. So whether youre giving a sales pitch or presenting to the board, make sure to check out Slidegeeks first.

Classification Of Data For Business Website Ppt PowerPoint Presentation Styles Layout PDF
Presenting this set of slides with name classification of data for business website ppt powerpoint presentation styles layout pdf. The topics discussed in these slides are sales trends, social media analytics, website analytics, email marketing reports. This is a completely editable PowerPoint presentation and is available for immediate download. Download now and impress your audience.

Managing Customer Attrition Different Ways To Collect Customer Data Designs PDF
This slide shows the different ways to collect customer data which covers web tracking, transactional data, surveys and marketing analytics to understand customer behavior, activities, etc. Present like a pro with Managing Customer Attrition Different Ways To Collect Customer Data Designs PDF Create beautiful presentations together with your team, using our easy-to-use presentation slides. Share your ideas in real-time and make changes on the fly by downloading our templates. So whether youre in the office, on the go, or in a remote location, you can stay in sync with your team and present your ideas with confidence. With Slidegeeks presentation got a whole lot easier. Grab these presentations today.

Primary Data Points For Customer Data Analysis Ideas PDF
This slide tabulates the multiple type of data used for win loss analysis in the organization. It also provides information about the sources of data points. Presenting primary data points for customer data analysis ideas pdf to dispense important information. This template comprises four stages. It also presents valuable insights into the topics including sales data, prospect feedback, demographic data, marketing data. This is a completely customizable PowerPoint theme that can be put to use immediately. So, download it and address the topic impactfully.

Tools For Improving Sales Plan Effectiveness Strategic Components Of An Effective Sales Strategy Elements PDF
This slide shows the Strategic Components of an Effective Sales Strategy such as Target Market and Customer Segmentation, Sales Channel Strategy, Buying Personas, Competitive Advantage, Value Proposition, Performance Metrics, Revenue Growth Strategies etc. Presenting tools for improving sales plan effectiveness strategic components of an effective sales strategy elements pdf to provide visual cues and insights. Share and navigate important information on eight stages that need your due attention. This template can be used to pitch topics like value proposition, performance metrics, growth strategies, compensation plan, competitive advantage. In addtion, this PPT design contains high resolution images, graphics, etc, that are easily editable and available for immediate download.
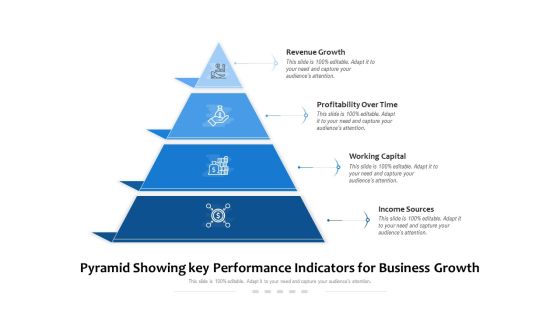
Pyramid Showing Key Performance Indicators For Business Growth Ppt PowerPoint Presentation Layouts Introduction PDF
Persuade your audience using this pyramid showing key performance indicators for business growth ppt powerpoint presentation layouts introduction pdf. This PPT design covers four stages, thus making it a great tool to use. It also caters to a variety of topics including revenue growth, profitability over time, working capital, income sources. Download this PPT design now to present a convincing pitch that not only emphasizes the topic but also showcases your presentation skills.

Sales Strategy Template 1 Ppt PowerPoint Presentation Inspiration
This is a sales strategy template 1 ppt powerpoint presentation inspiration. This is a one stage process. The stages in this process are sale strategy, marketing, magnifier, business.
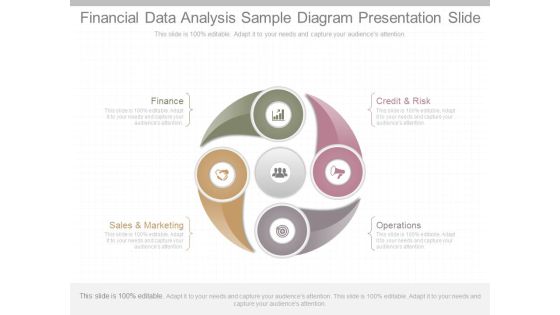
Financial Data Analysis Sample Diagram Presentation Slide
This is a financial data analysis sample diagram presentation slide. This is a four stage process. The stages in this process are finance, sales and marketing, operations, credit and risk.

Data Chart For Individual Income Analysis Ppt PowerPoint Presentation Layouts Visual Aids
This is a data chart for individual income analysis ppt powerpoint presentation layouts visual aids. This is a five stage process. The stages in this process are financial analysis, quantitative, statistical modelling.

Employee Attrition Rate Management Employee Reward And Recognition Infographics PDF
This is a Employee Attrition Rate Management Employee Reward And Recognition Infographics PDF template with various stages. Focus and dispense information on one stages using this creative set, that comes with editable features. It contains large content boxes to add your information on topics like Direct Walk, Step Process, Interview Process, Award and Recognition, Best Performer Quarter . You can also showcase facts, figures, and other relevant content using this PPT layout. Grab it now.

Engineering Services Company Valuation Ratios Engineering Company Financial Analysis Report Brochure PDF
The following slide highlights the valuation ratio of the engineering company to assess the organizations worth on the basis of share price, sales, and market capitalization, Key ratios included are enterprise value, EV per net sales, price to book value, market cap per sales, retention ratio and earnings yield. The Engineering Services Company Valuation Ratios Engineering Company Financial Analysis Report Brochure PDF is a compilation of the most recent design trends as a series of slides. It is suitable for any subject or industry presentation, containing attractive visuals and photo spots for businesses to clearly express their messages. This template contains a variety of slides for the user to input data, such as structures to contrast two elements, bullet points, and slides for written information. Slidegeeks is prepared to create an impression.
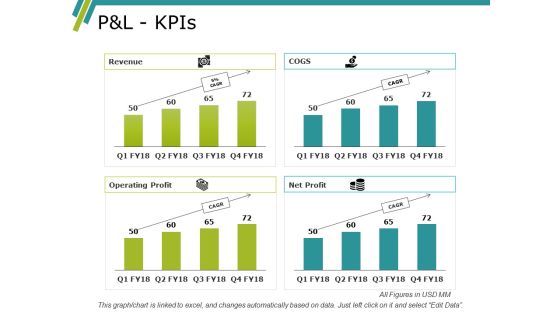
Pandl Kpis Ppt PowerPoint Presentation Slides Designs Download
This is a pandl kpis ppt powerpoint presentation slides designs download. This is a four stage process. The stages in this process are net sales, table, planning, cost, management.

Percentage Data Growth Chart Powerpoint Slides
This PowerPoint template has been designed with percentage data growth chart. Download this PPT chart to depict financial ratio analysis. This PowerPoint slide is of great help in the business sector to make realistic presentations and provides effective way of presenting your newer thoughts.

Kpis For Evaluating Business Sustainability Short Term Goals Infographics PDF
This slide covers the short term goals set by the firm for FY22. Goals covered are to capture competitors market share, reduce churn rate, increase sales revenue and to invest in CSR activities. This is a Kpis For Evaluating Business Sustainability Short Term Goals Infographics PDF template with various stages. Focus and dispense information on five stages using this creative set, that comes with editable features. It contains large content boxes to add your information on topics like Market Share, Reduce Customer Churn, Sales Revenue. You can also showcase facts, figures, and other relevant content using this PPT layout. Grab it now.

Qualifying Sales Ppt PowerPoint Presentation Professional Rules Cpb
Presenting this set of slides with name qualifying sales ppt powerpoint presentation professional rules cpb. This is an editable Powerpoint one stages graphic that deals with topics like qualifying sales to help convey your message better graphically. This product is a premium product available for immediate download and is 100 percent editable in Powerpoint. Download this now and use it in your presentations to impress your audience.

Circular Action Plan For Research Analysis Ppt PowerPoint Presentation Outline
This is a circular action plan for research analysis ppt powerpoint presentation outline. This is a five stage process. The stages in this process are Objectives Standards, Method Data Collection, Data Analysis, Implement Change, Reevaluate Review.

magnifying glass ppt powerpoint presentation infographics information
This is a magnifying glass ppt powerpoint presentation infographics information. This is a two stage process. The stages in this process are business, magnifier glass, search, marketing, strategy.
Magnifier Glass Ppt PowerPoint Presentation Icon Background
This is a magnifier glass ppt powerpoint presentation icon background. This is a three stage process. The stages in this process are magnifier glass, marketing, strategy, search, business.
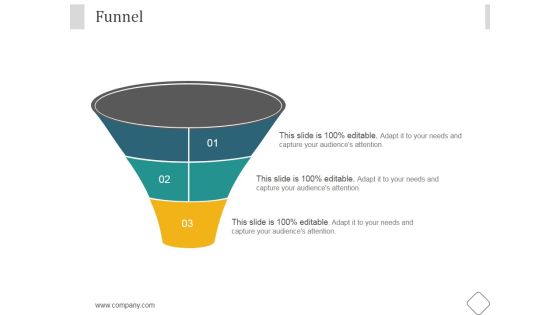
Funnel Ppt PowerPoint Presentation Backgrounds
This is a funnel ppt powerpoint presentation backgrounds. This is a three stage process. The stages in this process are business, marketing, management, funnel, planning.
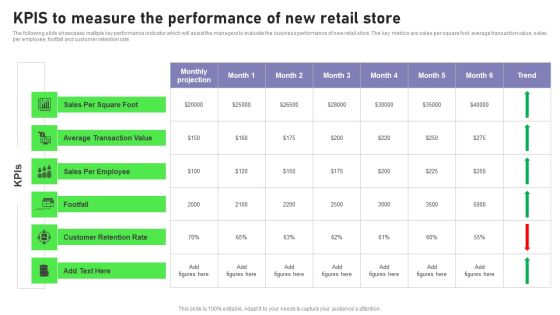
Retail Outlet Opening To Enhance Product Sale Kpis To Measure The Performance Infographics PDF
The following slide showcases multiple key performance indicator which will assist the managers to evaluate the business performance of new retail store. The key metrics are sales per square foot, average transaction value, sales per employee, footfall and customer retention rate. Slidegeeks is here to make your presentations a breeze with Retail Outlet Opening To Enhance Product Sale Kpis To Measure The Performance Infographics PDF With our easy to use and customizable templates, you can focus on delivering your ideas rather than worrying about formatting. With a variety of designs to choose from, you are sure to find one that suits your needs. And with animations and unique photos, illustrations, and fonts, you can make your presentation pop. So whether you are giving a sales pitch or presenting to the board, make sure to check out Slidegeeks first.
Transformation Toolkit Competitive Intelligence Information Analysis Vendor Data Profile For Data Analytics Software Icons PDF
This slide represents the list of vendors along with accompanying information including the key features, pros and cons of each vendor software. Slidegeeks is here to make your presentations a breeze with Transformation Toolkit Competitive Intelligence Information Analysis Vendor Data Profile For Data Analytics Software Icons PDF With our easy to use and customizable templates, you can focus on delivering your ideas rather than worrying about formatting. With a variety of designs to choose from, you are sure to find one that suits your needs. And with animations and unique photos, illustrations, and fonts, you can make your presentation pop. So whether you are giving a sales pitch or presenting to the board, make sure to check out Slidegeeks first.

Restaurant Business Monthly Financials Metrics With Total Income Demonstration PDF
This following slide displays key accounting details to analyze overall profit and loss status of the company. It includes details about income, cost of goods sold, other revenue, etc. Pitch your topic with ease and precision using this Restaurant Business Monthly Financials Metrics With Total Income Demonstration PDF. This layout presents information on Period, Key Takeaways, Total Income. It is also available for immediate download and adjustment. So, changes can be made in the color, design, graphics or any other component to create a unique layout.

Recurring Income Generation Model Key Metrices For Revenue Model Pictures PDF
The purpose of the following slide is to compare various revenue models based on different metrices such as Annual recurring revenue, Average revenue per unit, customer conversion rate, customer net profitability and customer churn rate. This Recurring Income Generation Model Key Metrices For Revenue Model Pictures PDF is perfect for any presentation, be it in front of clients or colleagues. It is a versatile and stylish solution for organizing your meetings. The Recurring Income Generation Model Key Metrices For Revenue Model Pictures PDF features a modern design for your presentation meetings. The adjustable and customizable slides provide unlimited possibilities for acing up your presentation. Slidegeeks has done all the homework before launching the product for you. So, do not wait, grab the presentation templates today
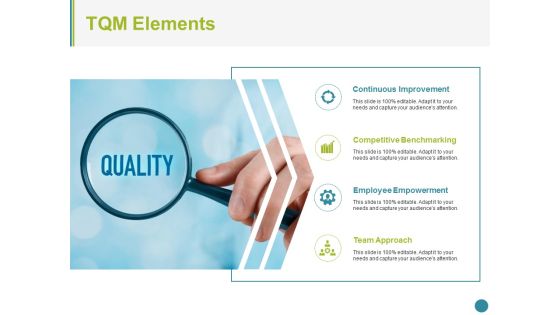
Tqm Elements Ppt PowerPoint Presentation Ideas Templates
This is a tqm elements ppt powerpoint presentation ideas templates. This is a one stage process. The stages in this process are continuous improvement, competitive benchmarking, employee empowerment, team approach.

Competitive Analysis Financial And Operational Data Ppt Show Icons PDF
The slide provides the Competitive landscape of the company on the basis of financial data sales and profit and operational data employee count, locations, number of branches, year of existence, interest rate etc.Deliver and pitch your topic in the best possible manner with this competitive analysis financial and operational data ppt show icons pdf. Use them to share invaluable insights on revenue, interest income, non performing loans and impress your audience. This template can be altered and modified as per your expectations. So, grab it now.

Data And Customer Analysis Company Outline Competitor Analysis Topics PDF
This slide highlights the competitive analysis of Nielsen, international data group, Kantar, GFK and Gartner on the basis of locations, employees, valuation, revenue and net income. Are you in need of a template that can accommodate all of your creative concepts This one is crafted professionally and can be altered to fit any style. Use it with Google Slides or PowerPoint. Include striking photographs, symbols, depictions, and other visuals. Fill, move around, or remove text boxes as desired. Test out color palettes and font mixtures. Edit and save your work, or work with colleagues. Download Data And Customer Analysis Company Outline Competitor Analysis Topics PDF and observe how to make your presentation outstanding. Give an impeccable presentation to your group and make your presentation unforgettable.

Saas Continuous Income Generation Model For Software Startup Key Metrices For Forecasting In Recurring Slides PDF
The purpose of the following slide is to display various metrices that can be used to forecast the performance of recurring revenue model. These metrices can be Annual recurring revenue, Customer churn rate, customer lifetime value, account expansion and contraction. Do you have to make sure that everyone on your team knows about any specific topic I yes, then you should give Saas Continuous Income Generation Model For Software Startup Key Metrices For Forecasting In Recurring Slides PDF a try. Our experts have put a lot of knowledge and effort into creating this impeccable Saas Continuous Income Generation Model For Software Startup Key Metrices For Forecasting In Recurring Slides PDF. You can use this template for your upcoming presentations, as the slides are perfect to represent even the tiniest detail. You can download these templates from the Slidegeeks website and these are easy to edit. So grab these today.
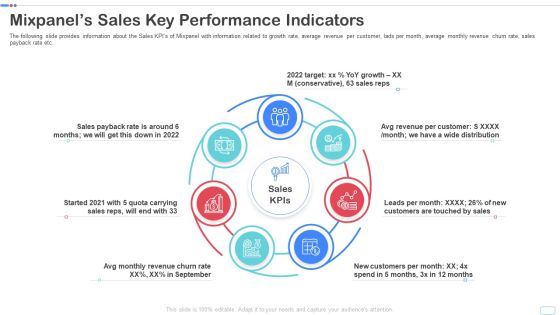
Mixpanel Capital Raising Pitch Deck Mixpanels Sales Key Performance Indicators Clipart PDF
The following slide provides information about the Sales KPIs of Mixpanel with information related to growth rate, average revenue per customer, lads per month, average monthly revenue churn rate, sales payback rate etc. This is a mixpanel capital raising pitch deck mixpanels sales key performance indicators clipart pdf template with various stages. Focus and dispense information on seven stages using this creative set, that comes with editable features. It contains large content boxes to add your information on topics like mixpanels sales key performance indicators. You can also showcase facts, figures, and other relevant content using this PPT layout. Grab it now.
Business Diagram Icons And Charts For Business Growth Presentation Template
Our above slide contains graphics of business charts and icons. It helps to display business reports and analysis. Use this diagram to impart more clarity to data and to create more sound impact on viewers.
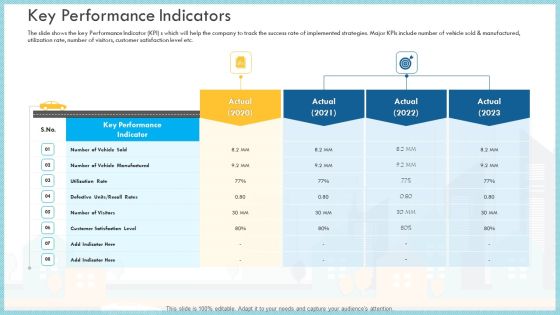
Loss Of Income And Financials Decline In An Automobile Organization Case Study Key Performance Indicators Brochure PDF
The slide shows the key Performance Indicator KPI s which will help the company to track the success rate of implemented strategies. Major KPIs include number of vehicle sold and manufactured, utilization rate, number of visitors, customer satisfaction level etc.Deliver an awe inspiring pitch with this creative loss of income and financials decline in an automobile organization case study key performance indicators brochure pdf bundle. Topics like key performance indicator, utilization rate, customer satisfaction level can be discussed with this completely editable template. It is available for immediate download depending on the needs and requirements of the user
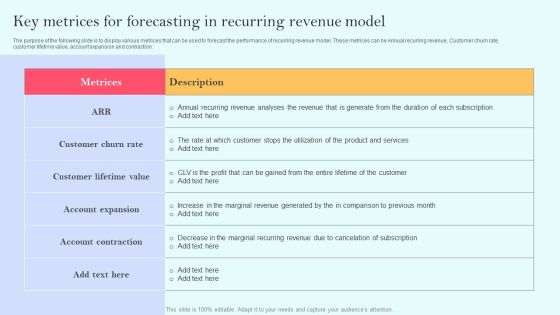
Recurring Income Generation Model Key Metrices For Forecasting In Recurring Revenue Model Summary PDF
The purpose of the following slide is to display various metrices that can be used to forecast the performance of recurring revenue model. These metrices can be Annual recurring revenue, Customer churn rate, customer lifetime value, account expansion and contraction. This modern and well arranged Recurring Income Generation Model Key Metrices For Forecasting In Recurring Revenue Model Summary PDF provides lots of creative possibilities. It is very simple to customize and edit with the Powerpoint Software. Just drag and drop your pictures into the shapes. All facets of this template can be edited with Powerpoint no extra software is necessary. Add your own material, put your images in the places assigned for them, adjust the colors, and then you can show your slides to the world, with an animated slide included.
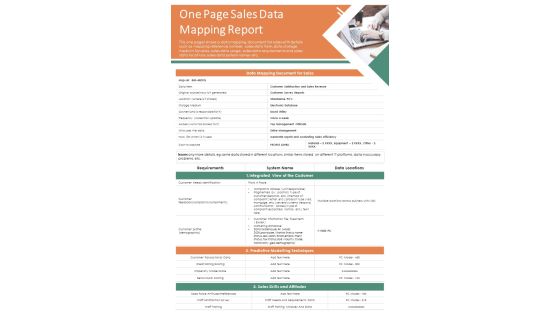
One Page Sales Data Mapping Report PDF Document PPT Template
Here an illustrative One Page Sales Data Mapping Report PDF Document PPT Template. This one-pager template is designed to match your needs. It is 100 percent editable, which allows you to make changes as you seem fit to suit your purpose. Grab this One Page Sales Data Mapping Report PDF Document PPT Template Download now.

Saas Continuous Income Generation Model For Software Startup Key Metrices For Revenue Model Introduction PDF
The purpose of the following slide is to compare various revenue models based on different metrices such as Annual recurring revenue, Average revenue per unit, customer conversion rate, customer net profitability and customer churn rate. This modern and well arranged Saas Continuous Income Generation Model For Software Startup Key Metrices For Revenue Model Introduction PDF provides lots of creative possibilities. It is very simple to customize and edit with the Powerpoint Software. Just drag and drop your pictures into the shapes. All facets of this template can be edited with Powerpoint no extra software is necessary. Add your own material, put your images in the places assigned for them, adjust the colors, and then you can show your slides to the world, with an animated slide included.

Break Even Analysis Ppt PowerPoint Presentation Inspiration Templates
This is a break even analysis ppt powerpoint presentation inspiration templates. This is a five stage process. The stages in this process are units of output, fixed cost, variable cost, total cost, sales revenue, profit.
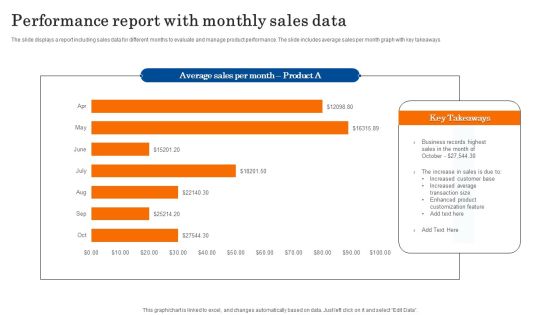
Performance Report With Monthly Sales Data Diagrams PDF
The slide displays a report including sales data for different months to evaluate and manage product performance. The slide includes average sales per month graph with key takeaways. Showcasing this set of slides titled Performance Report With Monthly Sales Data Diagrams PDF. The topics addressed in these templates are Business, Sales, Customization. All the content presented in this PPT design is completely editable. Download it and make adjustments in color, background, font etc. as per your unique business setting.

Business Data Analytics Report With Lead To Opportunity Ratio Ppt Styles Show PDF
Deliver an awe-inspiring pitch with this creative business data analytics report with lead to opportunity ratio ppt styles show pdf bundle. Topics like lead conversion ratio, sales team executives, average deal size can be discussed with this completely editable template. It is available for immediate download depending on the needs and requirements of the user.

Company Results Efficiency Ppt PowerPoint Presentation Icon Picture
Presenting this set of slides with name company results efficiency ppt powerpoint presentation icon picture. This is a three stage process. The stages in this process are efficiency, business, opportunity, market, revenues, process, loyalty. This is a completely editable PowerPoint presentation and is available for immediate download. Download now and impress your audience.
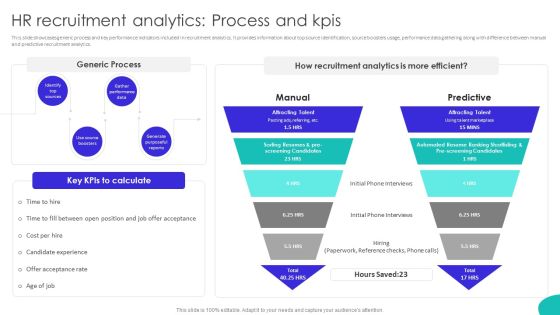
Improving Technology Based HR Recruitment Analytics Process And Kpis Designs PDF
This slide showcases generic process and key performance indicators included in recruitment analytics. It provides information about top source identification, source boosters usage, performance data gathering along with difference between manual and predictive recruitment analytics. Are you in need of a template that can accommodate all of your creative concepts This one is crafted professionally and can be altered to fit any style. Use it with Google Slides or PowerPoint. Include striking photographs, symbols, depictions, and other visuals. Fill, move around, or remove text boxes as desired. Test out color palettes and font mixtures. Edit and save your work, or work with colleagues. Download Improving Technology Based HR Recruitment Analytics Process And Kpis Designs PDF and observe how to make your presentation outstanding. Give an impeccable presentation to your group and make your presentation unforgettable.
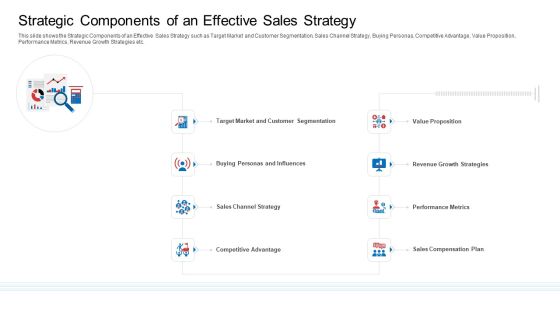
Strategic Plan To Increase Sales Volume And Revenue Strategic Components Of An Effective Sales Strategy Microsoft PDF
This slide shows the Strategic Components of an Effective Sales Strategy such as Target Market and Customer Segmentation, Sales Channel Strategy, Buying Personas, Competitive Advantage, Value Proposition, Performance Metrics, Revenue Growth Strategies etc. Presenting strategic plan to increase sales volume and revenue strategic components of an effective sales strategy microsoft pdf to provide visual cues and insights. Share and navigate important information on eight stages that need your due attention. This template can be used to pitch topics like value proposition, performance metrics, growth strategies, compensation plan, competitive advantage. In addtion, this PPT design contains high resolution images, graphics, etc, that are easily editable and available for immediate download.

Quarterly Sales Revenue Generation Performance Chart Icon Slides PDF
This graph or chart is linked to excel, and changes automatically based on data. Just left click on it and select edit data. Persuade your audience using this Quarterly Sales Revenue Generation Performance Chart Icon Slides PDF. This PPT design covers four stages, thus making it a great tool to use. It also caters to a variety of topics including Quarterly Sales Revenue, Generation Performance, Chart Icon. Download this PPT design now to present a convincing pitch that not only emphasizes the topic but also showcases your presentation skills.

Data And Customer Analysis Company Outline Revenue And Operating Income Diagrams PDF
This slide highlights the Nielsen company revenue and operating income for the last 3 years. It includes the data in million of US dollars with a key takeaways section. Create an editable Data And Customer Analysis Company Outline Revenue And Operating Income Diagrams PDF that communicates your idea and engages your audience. Whether youre presenting a business or an educational presentation, pre designed presentation templates help save time. Data And Customer Analysis Company Outline Revenue And Operating Income Diagrams PDF is highly customizable and very easy to edit, covering many different styles from creative to business presentations. Slidegeeks has creative team members who have crafted amazing templates. So, go and get them without any delay.
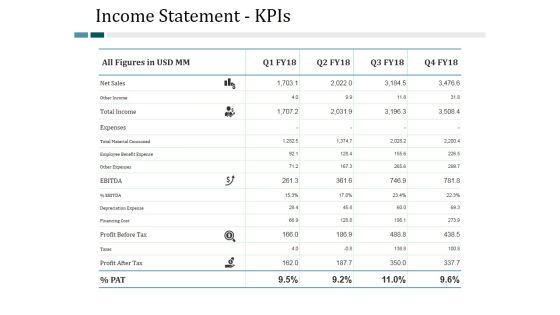
Income Statement Kpis Ppt PowerPoint Presentation Slides Show
This is a income statement kpis ppt powerpoint presentation slides show. This is a four stage process. The stages in this process are business, management, analysis, finance, strategy.
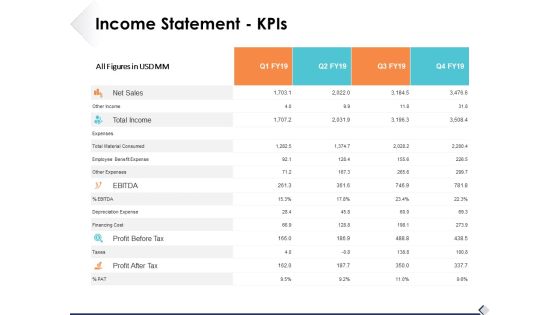
Income Statement Kpis Ppt PowerPoint Presentation Professional Template
This is a income statement kpis ppt powerpoint presentation professional template. This is a four stage process. The stages in this process are business, management, strategy, analysis, icons.

 Home
Home