Turnover Dashboard

Client Attrition Performance Administration Kpis Topics PDF
This slide shows various KPI to manage and track customer performance. It includes customer attrition rate, retention rate, repeat customer rate, purchase frequency, etc. Pitch your topic with ease and precision using this Client Attrition Performance Administration Kpis Topics PDF. This layout presents information on Customer Retention Rate, Repeat Customer Rate, Purchase Frequency. It is also available for immediate download and adjustment. So, changes can be made in the color, design, graphics or any other component to create a unique layout.

Income Assessment Report Compare Key Survey Findings With Industry Highlights Sample PDF
This slide translates the interpretation of conducting salary survey. It represents the data showing salary raise in previous year, percentage increase in salary, and bonus receive in past year.Deliver an awe inspiring pitch with this creative Income Assessment Report Compare Key Survey Findings With Industry Highlights Sample PDF bundle. Topics like Average Increments, Reasons For Attrition, Junior Management can be discussed with this completely editable template. It is available for immediate download depending on the needs and requirements of the user.

CRM Administration To Reduce Churn Rate Different Ways To Collect Customer Data Demonstration PDF
This slide shows the different ways to collect customer data which covers web tracking, transactional data, surveys and marketing analytics to understand customer behavior, activities, etc. Want to ace your presentation in front of a live audience Our CRM Administration To Reduce Churn Rate Different Ways To Collect Customer Data Demonstration PDF can help you do that by engaging all the users towards you. Slidegeeks experts have put their efforts and expertise into creating these impeccable powerpoint presentations so that you can communicate your ideas clearly. Moreover, all the templates are customizable, and easy to edit and downloadable. Use these for both personal and commercial use.

Financial Efficiency Snapshot For 2022 One Pager Documents
This slide shows the financial efficiency snapshot regarding the sources of income and expenditure in fiscal year 2022. Presenting you an exemplary Financial Efficiency Snapshot For 2022 One Pager Documents. Our one-pager comprises all the must-have essentials of an inclusive document. You can edit it with ease, as its layout is completely editable. With such freedom, you can tweak its design and other elements to your requirements. Download this Financial Efficiency Snapshot For 2022 One Pager Documents brilliant piece now.

Companies Branding Analysis Ppt Sample
This is a companies branding analysis ppt sample. This is a five stage process. The stages in this process are growth, loyalty, success, sales, customer.

Magnifying Glass For Sales Performance Review Ppt PowerPoint Presentation Model
This is a magnifying glass for sales performance review ppt powerpoint presentation model. This is a four stage process. The stage in this process are magnifier glass, pie, finance, percentage, research.

Vendor Selection And Evaluation Techniques Magnifying Glass Ppt Summary Example Topics PDF
Make sure to capture your audiences attention in your business displays with our gratis customizable Vendor Selection And Evaluation Techniques Magnifying Glass Ppt Summary Example Topics PDF. These are great for business strategies, office conferences, capital raising or task suggestions. If you desire to acquire more customers for your tech business and ensure they stay satisfied, create your own sales presentation with these plain slides.

Sales Key Performance Indicators Of The Company Before Strategy Implementation Growth Ppt Infographic Template Microsoft PDF
This slide shows the current Sales Performance Indicators of the company before adopting an effective strategy. These stats are related to Sales Growth, Average Sales Cycle Length, Profit Margin, Customer Churn Rate, Overall Company Sales etc. from the years 2018 to 2020 along with key takeaways. Deliver and pitch your topic in the best possible manner with this sales key performance indicators of the company before strategy implementation growth ppt infographic template microsoft pdf. Use them to share invaluable insights on performance indicators metrics, sales growth, customer churn rate, profit margin, 2018 to 2020 and impress your audience. This template can be altered and modified as per your expectations. So, grab it now.

Comprehensive Analysis Of Different Data Lineage Classification Typical Use Cases Of Data Lineage Themes PDF
This slide outlines the typical use cases of data lineage that include performing root cause analysis, generating reports, deprecating columns, and setting data retention policies. Data lineage enables a broad range of information use applications for IT departments and various stakeholder groups. Make sure to capture your audiences attention in your business displays with our gratis customizable Comprehensive Analysis Of Different Data Lineage Classification Typical Use Cases Of Data Lineage Themes PDF. These are great for business strategies, office conferences, capital raising or task suggestions. If you desire to acquire more customers for your tech business and ensure they stay satisfied, create your own sales presentation with these plain slides.
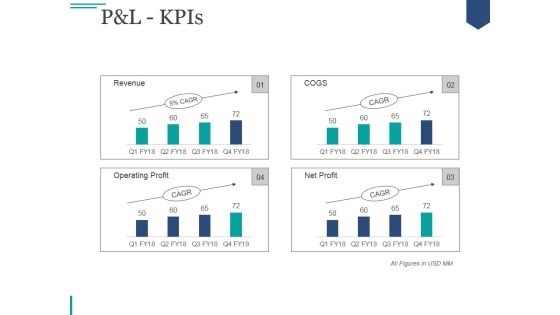
Pandl Kpis Ppt PowerPoint Presentation Deck
This is a pandl kpis ppt powerpoint presentation deck. This is a four stage process. The stages in this process are net sales, other income, total income, expenses, total material consumed.

Pandl Kpis Ppt PowerPoint Presentation Gallery Slides
This is a pandl kpis ppt powerpoint presentation gallery slides. This is a four stage process. The stages in this process are net sales, other income, total income, expenses, total material consumed.
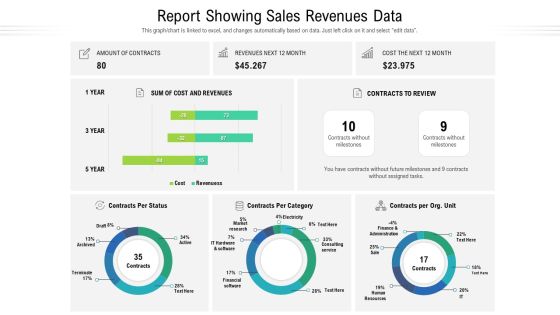
Report Showing Sales Revenues Data Ppt Show Backgrounds PDF
This graph or chart is linked to excel, and changes automatically based on data. Just left click on it and select edit data. Showcasing this set of slides titled report showing sales revenues data ppt show backgrounds pdf. The topics addressed in these templates are cost and revenues, market research, finance and administration. All the content presented in this PPT design is completely editable. Download it and make adjustments in color, background, font etc. as per your unique business setting.
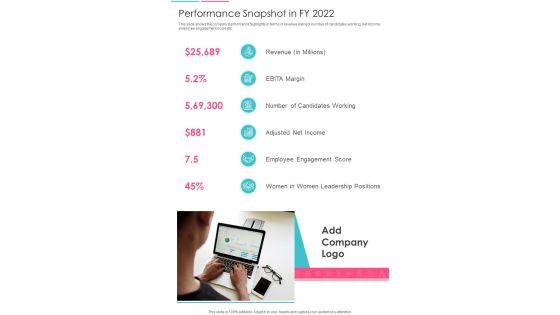
Performance Snapshot In FY 2022 One Pager Documents
This slide shows the company performance highlights in terms of revenue earned, number of candidates working, net income, employee engagement score etc. Presenting you an exemplary Performance Snapshot In FY 2022 One Pager Documents. Our one-pager comprises all the must-have essentials of an inclusive document. You can edit it with ease, as its layout is completely editable. With such freedom, you can tweak its design and other elements to your requirements. Download this Performance Snapshot In FY 2022 One Pager Documents brilliant piece now.

Internet Marketing Objectives Ppt PowerPoint Presentation Summary Portrait
This is a internet marketing objectives ppt powerpoint presentation summary portrait. This is a six stage process. The stages in this process are sales revenue, profit margins, product types, repeat sales, sales leads, web visitors.
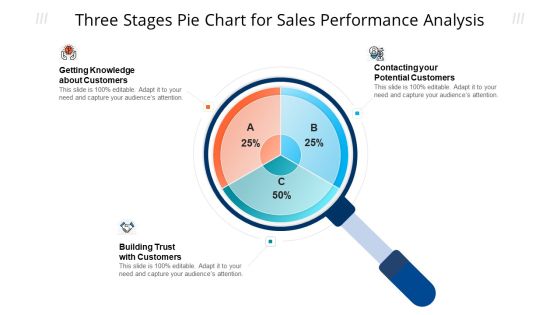
Three Stages Pie Chart For Sales Performance Analysis Ppt Model Tips PDF
Persuade your audience using this three stages pie chart for sales performance analysis ppt model tips pdf. This PPT design covers three stages, thus making it a great tool to use. It also caters to a variety of topics including potential customers, knowledge about customers, sales performance analysis. Download this PPT design now to present a convincing pitch that not only emphasizes the topic but also showcases your presentation skills.

Quality Management Definition Ppt PowerPoint Presentation Designs
This is a quality management definition ppt powerpoint presentation designs. This is a four stage process. The Stages in this process are quality management, process, magnifier, search, analysis, business.

Business Diagram Data Warehouse Model With Analytics And Business Intelligence Ppt Slide
This technology diagram has been designed with graphic of data warehouse model. This model depicts concept of business intelligence and analysis. Download this editable slide build an exclusive presentation.
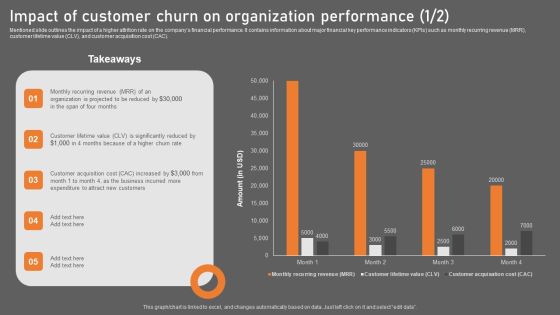
Impact Of Customer Churn On Organization Performance Background PDF
Mentioned slide outlines the impact of a higher attrition rate on the companys financial performance. It contains information about major financial key performance indicators KPIs such as monthly recurring revenue MRR, customer lifetime value CLV, and customer acquisition cost CAC. Take your projects to the next level with our ultimate collection of Impact Of Customer Churn On Organization Performance Background PDF. Slidegeeks has designed a range of layouts that are perfect for representing task or activity duration, keeping track of all your deadlines at a glance. Tailor these designs to your exact needs and give them a truly corporate look with your own brand colors they will make your projects stand out from the rest.
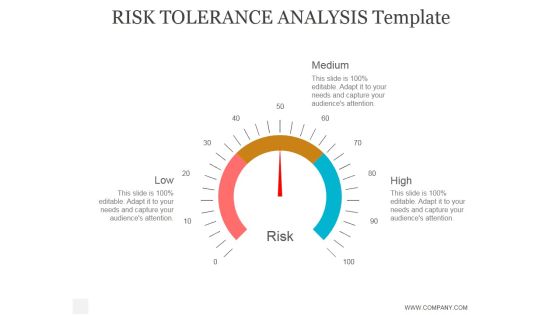
Risk Tolerance Analysis Template Ppt PowerPoint Presentation Example
This is a risk tolerance analysis template ppt powerpoint presentation example. This is a four stage process. The stages in this process are business, strategy, marketing, analysis, success, arrow.

Buying Sales Leads Ppt PowerPoint Presentation Summary Diagrams Cpb
This is a buying sales leads ppt powerpoint presentation summary diagrams cpb. This is a four stage process. The stages in this process are buying sales leads.

Five Year Sales Projection Graph Icon Graphics PDF
Persuade your audience using this Five Year Sales Projection Graph Icon Graphics PDF. This PPT design covers three stages, thus making it a great tool to use. It also caters to a variety of topics including Five Year Sales, Projection Graph Icon. Download this PPT design now to present a convincing pitch that not only emphasizes the topic but also showcases your presentation skills.

Big Data Analytics Workflow Funnel Ppt PowerPoint Presentation Rules
This is a big data analytics workflow funnel ppt powerpoint presentation rules. This is a one stage process. The stages in this process are database, location, social, images, sensor data, email, clickstream, html, actionable intelligence.

Pandl Kpis Ppt PowerPoint Presentation Infographic Template Layout
This is a pandl kpis ppt powerpoint presentation infographic template layout. This is a four stage process. The stages in this process are net sales, other income, total income, expenses, total material consumed.
Measuring Overall Health Of Company Using Customer Churn Metrics Ppt PowerPoint Presentation File Icon PDF
Mentioned slide outlines different key performance indicators KPIs that will assist corporates to evaluate the success of customer churn prevention strategies. The major metrics covered in the slide are revenue growth rate, monthly active users MAU, net promoter score NPS, customer satisfaction score CSAT, and customer acquisition cost CAC. Create an editable Measuring Overall Health Of Company Using Customer Churn Metrics Ppt PowerPoint Presentation File Icon PDF that communicates your idea and engages your audience. Whether you are presenting a business or an educational presentation, pre designed presentation templates help save time. Measuring Overall Health Of Company Using Customer Churn Metrics Ppt PowerPoint Presentation File Icon PDF is highly customizable and very easy to edit, covering many different styles from creative to business presentations. Slidegeeks has creative team members who have crafted amazing templates. So, go and get them without any delay.

Customer Behavioral Data And Analytics Customer Churn Rate Guidelines PDF
Measuring how many customers stopped doing business with you lets you compare it with your industry average churn rate and see if you are doing well. Deliver and pitch your topic in the best possible manner with this customer behavioral data and analytics customer churn rate guidelines pdf. Use them to share invaluable insights on customer churn rate and impress your audience. This template can be altered and modified as per your expectations. So, grab it now.
Revenue Split By Product Segment Template Ppt PowerPoint Presentation Icon Graphics Download
This is a revenue split by product segment template ppt powerpoint presentation icon graphics download. This is a four stage process. The stages in this process are table, business, marketing, data, management.

Pandl Kpis Ppt PowerPoint Presentation Professional Show
This is a pandl kpis ppt powerpoint presentation professional show. This is a four stage process. The stages in this process are other income, total income, expenses, total material consumed, employee benefit expense.

Compensation Survey Sheet Employee Headcount Snapshot Rules PDF
This slide shows the company headcount highlights. It represents the total number of employees working in an organization, total headcount in various departments, and employees on the basis of gender. Deliver and pitch your topic in the best possible manner with this Compensation Survey Sheet Employee Headcount Snapshot Rules PDF. Use them to share invaluable insights on Finance, Marketing, Sales and impress your audience. This template can be altered and modified as per your expectations. So, grab it now.

Pandl Kpis Ppt PowerPoint Presentation Gallery Display
This is a pandl kpis ppt powerpoint presentation gallery display. This is a four stage process. The stages in this process are net sales, total income, expenses, ebitda, profit after tax.

Sales Data Analysis Report Sample Ppt PowerPoint Presentation Summary Example Cpb
Presenting this set of slides with name sales data analysis report sample ppt powerpoint presentation summary example cpb. This is an editable Powerpoint eight stages graphic that deals with topics like sales data analysis report sample to help convey your message better graphically. This product is a premium product available for immediate download and is 100 percent editable in Powerpoint. Download this now and use it in your presentations to impress your audience.

Data Warehousing Opportunities Diagram Ppt Powerpoint Slides
This is a data warehousing opportunities diagram ppt powerpoint slides. This is a eight stage process. The stages in this process are inventory, payroll, sales, ledger general, production, reporting, analytics, data mining.

Sales Data Analysis Diagram Powerpoint Slides
This is a sales data analysis diagram powerpoint slides. This is a three stage process. The stages in this process are data analysis, method, compare.

Key Performance Indicators In Sales Powerpoint Slides
This is a key performance indicators in sales powerpoint slides. This is a four stage process. The stages in this process are kpis, sales and marketing process, buyers journey, awareness, consideration, decision, visitors, leads, marketing qualified leads, sales qualified leads.
Sales Gap Data Analysis Icon Microsoft PDF
Persuade your audience using this Sales Gap Data Analysis Icon Microsoft PDF. This PPT design covers four stages, thus making it a great tool to use. It also caters to a variety of topics including Sales Gap Data, Analysis Icon. Download this PPT design now to present a convincing pitch that not only emphasizes the topic but also showcases your presentation skills.

Data Warehousing IT Data Warehouse Architecture With Staging Area And Data Ppt Layouts Example PDF
This slide depicts a data warehouse architecture with a staging area and data marts and how it can be used for different groups within an organization. Deliver and pitch your topic in the best possible manner with this data warehousing it data warehouse architecture with staging area and data ppt layouts example pdf. Use them to share invaluable insights on inventory, sales, purchasing, analysis, reporting and impress your audience. This template can be altered and modified as per your expectations. So, grab it now.

Financial Projections Income Statement Ppt PowerPoint Presentation Inspiration Vector
This is a financial projections income statement ppt powerpoint presentation inspiration vector. This is a four stage process. The stages in this process are net sales, expenses, cost of goods sold, employee benefit expense, financing cost.

Key Performance Indicators Mockup PDF
Deliver and pitch your topic in the best possible manner with this key performance indicators mockup pdf. Use them to share invaluable insights on total number of employees, employee attrition rate, key performance indicator and impress your audience. This template can be altered and modified as per your expectations. So, grab it now.
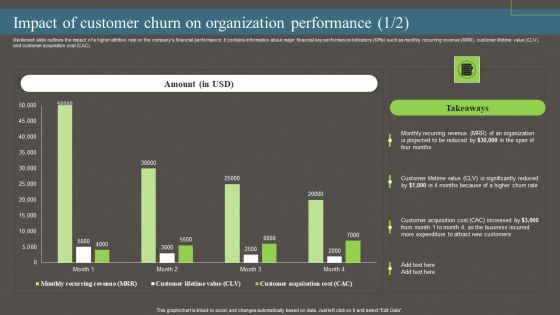
Impact Of Customer Churn On Organization Performance Ppt PowerPoint Presentation File Pictures PDF
Mentioned slide outlines the impact of a higher attrition rate on the companys financial performance. It contains information about major financial key performance indicators KPIs such as monthly recurring revenue MRR, customer lifetime value CLV, and customer acquisition cost CAC. The best PPT templates are a great way to save time, energy, and resources. Slidegeeks have 100 percent editable powerpoint slides making them incredibly versatile. With these quality presentation templates, you can create a captivating and memorable presentation by combining visually appealing slides and effectively communicating your message. Download Impact Of Customer Churn On Organization Performance Ppt PowerPoint Presentation File Pictures PDF from Slidegeeks and deliver a wonderful presentation.
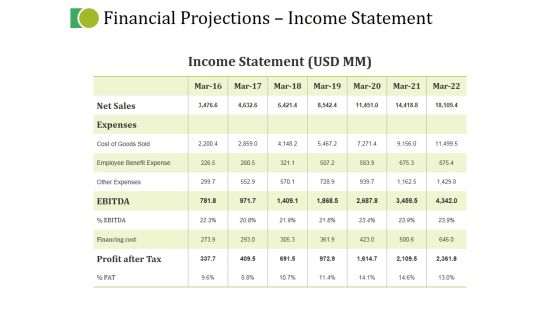
Financial Projections Income Statement Ppt PowerPoint Presentation Portfolio Infographic Template
This is a financial projections income statement ppt powerpoint presentation portfolio infographic template. This is a seven stage process. The stages in this process are trade payables, current liabilities, total liabilities, total fixed assets, inventories.

Property Investment Strategies Real Estate Market Snapshot Template Sale Ppt PowerPoint Presentation Gallery Graphics Design PDF
Presenting property investment strategies real estate market snapshot template sale ppt powerpoint presentation gallery graphics design pdf. to provide visual cues and insights. Share and navigate important information on four stages that need your due attention. This template can be used to pitch topics like average asking price, average sold price, average days on market, homes for sale, for comparable homes. In addtion, this PPT design contains high resolution images, graphics, etc, that are easily editable and available for immediate download.
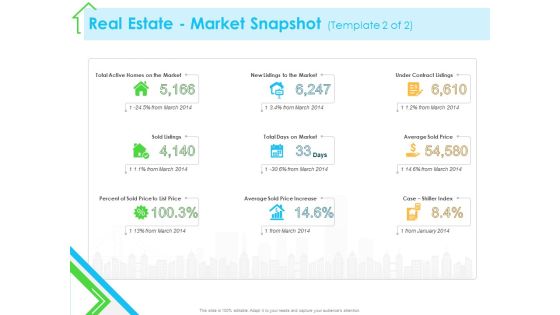
Real Estate Development Real Estate Market Snapshot Sale Ppt PowerPoint Presentation Infographics Deck PDF
Presenting this set of slides with name real estate development real estate market snapshot sale ppt powerpoint presentation infographics deck pdf. This is a nine stage process. The stages in this process are total active homes market, new listings market, under contract listings, sold listings, total days market, average sold price, percent sold price to list price, average sold price increase, case shiller index. This is a completely editable PowerPoint presentation and is available for immediate download. Download now and impress your audience.

Customer Churn Prediction And Prevention Customer Behavioral Trend Summary PDF
Presenting this set of slides with name customer churn prediction and prevention customer behavioral trend summary pdf. This is a three stage process. The stages in this process are trials and experience, reliability on reviews, e commerce. This is a completely editable PowerPoint presentation and is available for immediate download. Download now and impress your audience.

Comparative Analysis Of Data Driven Marketing Tools Ppt Summary Slide Download PDF
This slide represents the comparison between varied data driven marketing tools based on their key attributes to help marketers choose the best tool for optimizing their marketing strategy. It includes comparison based on features such as marketing attribution, real-time reporting etc. Make sure to capture your audiences attention in your business displays with our gratis customizable Comparative Analysis Of Data Driven Marketing Tools Ppt Summary Slide Download PDF. These are great for business strategies, office conferences, capital raising or task suggestions. If you desire to acquire more customers for your tech business and ensure they stay satisfied, create your own sales presentation with these plain slides.

Comparative Analysis Of Data Driven Marketing Tools Ppt Gallery Guidelines PDF
This slide represents the comparison between varied data driven marketing tools based on their key attributes to help marketers choose the best tool for optimizing their marketing strategy. It includes comparison based on features such as marketing attribution, real-time reporting etc. Make sure to capture your audiences attention in your business displays with our gratis customizable Comparative Analysis Of Data Driven Marketing Tools Ppt Gallery Guidelines PDF. These are great for business strategies, office conferences, capital raising or task suggestions. If you desire to acquire more customers for your tech business and ensure they stay satisfied, create your own sales presentation with these plain slides.

Controlling Customer Retention Preventing Churn Through Predictive Analytics Ppt Model Format PDF
Projecting the probability of future outcomes, events based on current and historical data. It utilizes different statistical techniques such as machine learning, pattern recognition through data mining, etc. This is a controlling customer retention preventing churn through predictive analytics ppt model format pdf template with various stages. Focus and dispense information on one stages using this creative set, that comes with editable features. It contains large content boxes to add your information on topics like preventing churn through predictive analytics. You can also showcase facts, figures, and other relevant content using this PPT layout. Grab it now.

Guide For Marketing Analytics To Improve Decisions Present And Previous Marketing Data Analysis Rules PDF
The following slide showcases comparative analysis of yearly performance to compare past results with current and determine success and failure factors. It includes elements such as revenue, sales, conversions, page views, net income, number of units sole etc. Formulating a presentation can take up a lot of effort and time, so the content and message should always be the primary focus. The visuals of the PowerPoint can enhance the presenters message, so our Guide For Marketing Analytics To Improve Decisions Present And Previous Marketing Data Analysis Rules PDF was created to help save time. Instead of worrying about the design, the presenter can concentrate on the message while our designers work on creating the ideal templates for whatever situation is needed. Slidegeeks has experts for everything from amazing designs to valuable content, we have put everything into Guide For Marketing Analytics To Improve Decisions Present And Previous Marketing Data Analysis Rules PDF

Crm Sales Leads With Marketing Ppt PowerPoint Presentation Picture
This is a crm sales leads with marketing ppt powerpoint presentation picture. This is a five stage process. The stages in this process are inquiry, marketing qualified lead, sales accepted lead, sales qualified lead, close.

Freelance Content Marketing Key Performance Indicator Metrics Slides PDF
The following slide highlights the freelance content marketing key performance indicator metrics. It shows kpi metrics including total sales, leads, conversion rate, membership, recommendation, retention, marketing roi, bounce rate and total visits to measure performance compared to benchmark. Pitch your topic with ease and precision using this Freelance Content Marketing Key Performance Indicator Metrics Slides PDF. This layout presents information on Total Sales, Conversion Rate, Bounce Rate. It is also available for immediate download and adjustment. So, changes can be made in the color, design, graphics or any other component to create a unique layout.

Key Performance Indicators For Smarketing Ppt Icon Graphic Images PDF
This slide shows various KPIs which can be used to measure marketing and sales alignment. These are overall revenue, sales cycle length, marketing qualified leads, etc. Presenting Key Performance Indicators For Smarketing Ppt Icon Graphic Images PDF to dispense important information. This template comprises one stages. It also presents valuable insights into the topics including KPIs, Overall Revenue, Sales Cycle Length. This is a completely customizable PowerPoint theme that can be put to use immediately. So, download it and address the topic impactfully.
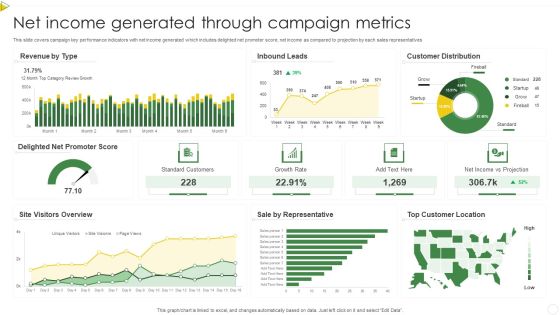
Net Income Generated Through Campaign Metrics Summary PDF
This slide covers campaign key performance indicators with net income generated which includes delighted net promoter score, net income as compared to projection by each sales representatives. Pitch your topic with ease and precision using this Net Income Generated Through Campaign Metrics Summary PDF. This layout presents information on Standard Customers, Growth Rate, Net Income. It is also available for immediate download and adjustment. So, changes can be made in the color, design, graphics or any other component to create a unique layout.
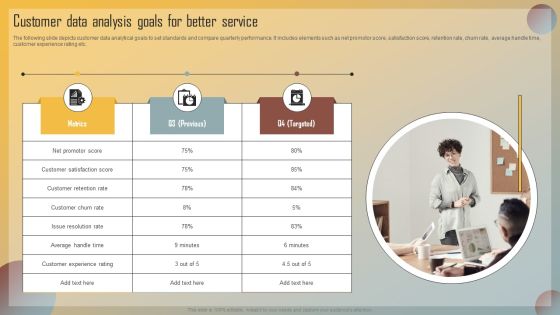
Guide For Marketing Analytics To Improve Decisions Customer Data Analysis Goals For Better Service Template PDF
The following slide depicts customer data analytical goals to set standards and compare quarterly performance. It includes elements such as net promotor score, satisfaction score, retention rate, churn rate, average handle time, customer experience rating etc. Create an editable Guide For Marketing Analytics To Improve Decisions Customer Data Analysis Goals For Better Service Template PDF that communicates your idea and engages your audience. Whether youre presenting a business or an educational presentation, pre designed presentation templates help save time. Guide For Marketing Analytics To Improve Decisions Customer Data Analysis Goals For Better Service Template PDF is highly customizable and very easy to edit, covering many different styles from creative to business presentations. Slidegeeks has creative team members who have crafted amazing templates. So, go and get them without any delay.
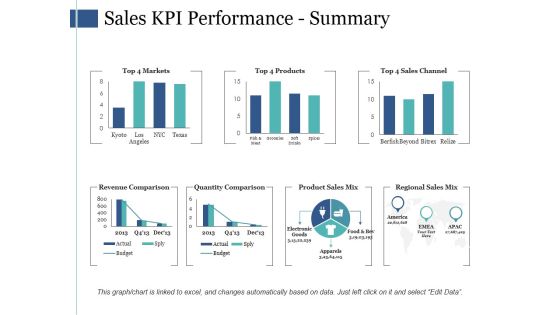
Sales Kpi Performance Summary Ppt PowerPoint Presentation Infographic Template Infographics
This is a sales kpi performance summary ppt powerpoint presentation infographic template infographics. This is a seven stage process. The stages in this process are revenue comparison, quantity comparison, product sales mix, regional sales mix.

Essential Business Requirements For Data Analytics Business Analysis Modification Toolkit Topics PDF
In this slide, we are showing the basic key components including people, process and technology that are required for data analytics strategy management process.This is a Essential Business Requirements For Data Analytics Business Analysis Modification Toolkit Topics PDF template with various stages. Focus and dispense information on three stages using this creative set, that comes with editable features. It contains large content boxes to add your information on topics like Technologies, Processes, Technologies. You can also showcase facts, figures, and other relevant content using this PPT layout. Grab it now.

Predicting Customer Churn Probability Through Predictive Analytics Inspiration PDF
After deploying predictive analytics tool, the firm will become capable in predicting churn probability of various customers on basis of various attributes such as NPS, transaction usage, etc. that are retrieved from customer data. Coming up with a presentation necessitates that the majority of the effort goes into the content and the message you intend to convey. The visuals of a PowerPoint presentation can only be effective if it supplements and supports the story that is being told. Keeping this in mind our experts created Predicting Customer Churn Probability Through Predictive Analytics Inspiration PDF to reduce the time that goes into designing the presentation. This way, you can concentrate on the message while our designers take care of providing you with the right template for the situation.

Predictive Analytics In The Age Of Big Data Predictive Analytics In Marketing Automation Ideas PDF
This slide talks about marketing automation by predictive analytics, and this will reshape the market industry. It also includes how this process will work and how automatic systems will detect the searched keywords and will inform the sales team about the leads in the funnel when they will make any social activity. The Predictive Analytics In The Age Of Big Data Predictive Analytics In Marketing Automation Ideas PDF is a compilation of the most recent design trends as a series of slides. It is suitable for any subject or industry presentation, containing attractive visuals and photo spots for businesses to clearly express their messages. This template contains a variety of slides for the user to input data, such as structures to contrast two elements, bullet points, and slides for written information. Slidegeeks is prepared to create an impression.

Transformation Toolkit Competitive Intelligence Information Analysis Essential Business Requirements For Data Analytics Summary PDF
In this slide, we are showing the basic key components including people, process and technology that are required for data analytics strategy management process. Present like a pro with Transformation Toolkit Competitive Intelligence Information Analysis Essential Business Requirements For Data Analytics Summary PDF Create beautiful presentations together with your team, using our easy to use presentation slides. Share your ideas in real time and make changes on the fly by downloading our templates. So whether you are in the office, on the go, or in a remote location, you can stay in sync with your team and present your ideas with confidence. With Slidegeeks presentation got a whole lot easier. Grab these presentations today.

Big Data Solutions For Enterprises Ppt PowerPoint Presentation Layouts
This is a big data solutions for enterprises ppt powerpoint presentation layouts. This is a four stage process. The stages in this process are media, social, machine, historical.
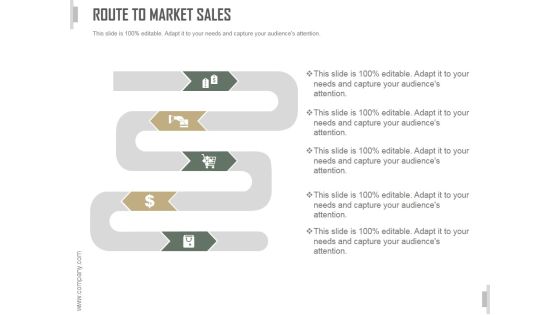
Route To Market Sales Ppt PowerPoint Presentation Show
This is a route to market sales ppt powerpoint presentation show. This is a five stage process. The stages in this process are business, strategy, marketing, analysis, zig zig, icons.

Revenue Database In Blockchain Business Methodology Icon Download PDF
Presenting Revenue Database In Blockchain Business Methodology Icon Download PDF to dispense important information. This template comprises four stages. It also presents valuable insights into the topics including Revenue Database, Blockchain Business Methodology, Icon. This is a completely customizable PowerPoint theme that can be put to use immediately. So, download it and address the topic impactfully.
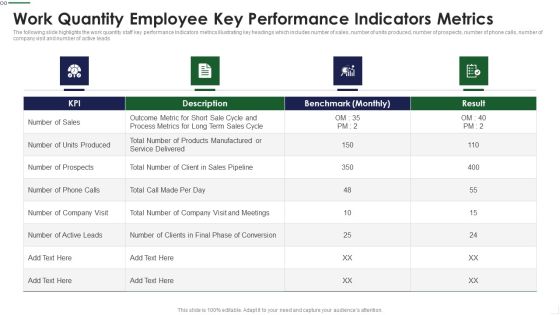
Work Quantity Employee Key Performance Indicators Metrics Summary PDF
The following slide highlights the work quantity staff key performance Indicators metrics illustrating key headings which includes number of sales, number of units produced, number of prospects, number of phone calls, number of company visit and number of active leads Deliver and pitch your topic in the best possible manner with this Work Quantity Employee Key Performance Indicators Metrics Summary PDF Use them to share invaluable insights on Outcome Metric, Process Metrics, Benchmark and impress your audience. This template can be altered and modified as per your expectations. So, grab it now.

 Home
Home