AI PPT Maker
Templates
PPT Bundles
Design Services
Business PPTs
Business Plan
Management
Strategy
Introduction PPT
Roadmap
Self Introduction
Timelines
Process
Marketing
Agenda
Technology
Medical
Startup Business Plan
Cyber Security
Dashboards
SWOT
Proposals
Education
Pitch Deck
Digital Marketing
KPIs
Project Management
Product Management
Artificial Intelligence
Target Market
Communication
Supply Chain
Google Slides
Research Services
 One Pagers
All Categories
-
Home
- Customer Favorites
- Revenue Dashboard
Revenue Dashboard

Data Analysis Excel Driven Multiple Series Scatter Chart PowerPoint Slides Templates
Your Listeners Will Never Doodle. Our data analysis excel driven multiple series scatter chart powerpoint slides Templates Will Hold Their Concentration.

Formulating Money Laundering Mitigating Transaction Risks Through Policies Clipart PDF
This slide illustrates mitigating transaction risks through policies and procedures. It provides information about due diligence, transaction monitoring, screening, customer identification, data analysis, investigation, review, etc. The Formulating Money Laundering Mitigating Transaction Risks Through Policies Clipart PDF is a compilation of the most recent design trends as a series of slides. It is suitable for any subject or industry presentation, containing attractive visuals and photo spots for businesses to clearly express their messages. This template contains a variety of slides for the user to input data, such as structures to contrast two elements, bullet points, and slides for written information. Slidegeeks is prepared to create an impression.

Key Performance Indicators Template 3 Ppt PowerPoint Presentation Samples
This is a key performance indicators template 3 ppt powerpoint presentation samples. This is a four stage process. The stages in this process are objective, measures, targets, invites.

Data Collection And Analysis Control Chart Ppt PowerPoint Presentation Model Backgrounds
This is a data collection and analysis control chart ppt powerpoint presentation model backgrounds. This is a two stage process. The stages in this process are business, marketing, strategy, finance, analysis.

Financial Services Crm Presentation Visual Aids
This is a financial services crm presentation visual aids. This is a five stage process. The stages in this process are account aggregation, financial planning, crm, data input tools, document management, portfolio accounting, custodian, trading rebalancing, portfolio analytics reporting.

Data In Stacked Format 6 Stages Small Business Plan Template PowerPoint Slides
We present our data in stacked format 6 stages small business plan template PowerPoint Slides.Download and present our Finance PowerPoint Templates because Our PowerPoint Templates and Slides provide you with a vast range of viable options. Select the appropriate ones and just fill in your text. Download our Marketing PowerPoint Templates because Our PowerPoint Templates and Slides will bullet point your ideas. See them fall into place one by one. Present our Spheres PowerPoint Templates because You can Create a matrix with our PowerPoint Templates and Slides. Feel the strength of your ideas click into place. Download and present our Business PowerPoint Templates because our PowerPoint Templates and Slides are the string of your bow. Fire of your ideas and conquer the podium. Present our Boxes PowerPoint Templates because Our PowerPoint Templates and Slides are aesthetically designed to attract attention. We gaurantee that they will grab all the eyeballs you need.Use these PowerPoint slides for presentations relating to Accounting, bar, business, chart, data, diagram, dimension, economy, education, finance, financial, flow, graph, graphic, grow, increase, information, investment, learning, management, market, money, performance, piece, process, profit, report, stack, statistic, success, think, transaction, trend, work. The prominent colors used in the PowerPoint template are Blue, Green, Black.

Portfolio Revision Ppt PowerPoint Presentation Slide
This is a portfolio revision ppt powerpoint presentation slide. This is a two stage process. The stages in this process are current portfolio, new portfolio, data analysis.

Outline Of Automotive Business With Future Market Potential Ppt PowerPoint Presentation Gallery Inspiration PDF
Presenting outline of automotive business with future market potential ppt powerpoint presentation gallery inspiration pdf to dispense important information. This template comprises six stages. It also presents valuable insights into the topics including business coming from 2 wheeler segment, increase in customer retention can lead, profit rise, future market potential, customer, customer aware brand. This is a completely customizable PowerPoint theme that can be put to use immediately. So, download it and address the topic impactfully.

Key Performance Indicators Template 2 Ppt PowerPoint Presentation Layouts Portfolio
This is a key performance indicators template 2 ppt powerpoint presentation layouts portfolio. This is a four stage process. The stages in this process are objective, measures, targets, invites.

9 Correlated Blocks Of Structured Data Business Financial Planning PowerPoint Templates
We present our 9 correlated blocks of structured data business financial planning PowerPoint templates.Download our Marketing PowerPoint Templates because Our PowerPoint Templates and Slides will fulfill your every need. Use them and effectively satisfy the desires of your audience. Present our Business PowerPoint Templates because Our PowerPoint Templates and Slides team portray an attitude of elegance. Personify this quality by using them regularly. Use our Finance PowerPoint Templates because you can Break through with our PowerPoint Templates and Slides. Bring down the mental barriers of your audience. Use our Process and Flows PowerPoint Templates because Our PowerPoint Templates and Slides will effectively help you save your valuable time. They are readymade to fit into any presentation structure. Present our Arrows PowerPoint Templates because You should Kick up a storm with our PowerPoint Templates and Slides. The heads of your listeners will swirl with your ideas.Use these PowerPoint slides for presentations relating to Diagram, Chart, Business, Background, Vector, Pie, Brown, Abstract, Wheel, Options, Board, Website, Cross, Statistics, Model, Item, Document, Media, Beehives, Red, Hive, Concept, Presentation, Template, Matt, Brochure, Orange, Guide, Description, Multicolor, Marketing, Gray, Development, Title, Management, Honeycomb, Illustration, Six, Catalog, Direction, Plans, Blue, Text, Reports, Financial, Workplace, Navigation, Parts. The prominent colors used in the PowerPoint template are Yellow, Gray, Black.

Debt Management Investment Management Design Templates
This is a debt management investment management design templates. This is a six stage process. The stages in this process are debt management, investment management, tax planning, risk management, estate planning, business succession.

data collection scatter diagram ppt powerpoint presentation inspiration
This is a data collection scatter diagram ppt powerpoint presentation inspiration. This is a three stage process. The stages in this process are business, planning, marketing, scatter diagram, finance.

9 Correlated Blocks Of Structured Data Business Plan PowerPoint Templates
We present our 9 correlated blocks of structured data business plan PowerPoint templates.Use our Marketing PowerPoint Templates because Our PowerPoint Templates and Slides will embellish your thoughts. See them provide the desired motivation to your team. Download and present our Business PowerPoint Templates because You are well armed with penetrative ideas. Our PowerPoint Templates and Slides will provide the gunpowder you need. Download our Finance PowerPoint Templates because Our PowerPoint Templates and Slides offer you the widest possible range of options. Download our Process and Flows PowerPoint Templates because Our PowerPoint Templates and Slides are designed to help you succeed. They have all the ingredients you need. Use our Arrows PowerPoint Templates because Our PowerPoint Templates and Slides help you pinpoint your timelines. Highlight the reasons for your deadlines with their use.Use these PowerPoint slides for presentations relating to Diagram, Chart, Business, Background, Vector, Pie, Brown, Abstract, Wheel, Options, Board, Website, Cross, Statistics, Model, Item, Document, Media, Beehives, Red, Hive, Concept, Presentation, Template, Matt, Brochure, Orange, Guide, Description, Multicolor, Marketing, Gray, Development, Title, Management, Honeycomb, Illustration, Six, Catalog, Direction, Plans, Blue, Text, Reports, Financial, Workplace, Navigation, Parts. The prominent colors used in the PowerPoint template are Yellow, Gray, Black.

Big Data Benefits Analytics In Healthcare Ppt PowerPoint Presentation Example 2015
This is a big data benefits analytics in healthcare ppt powerpoint presentation example 2015. This is a four stage process. The stages in this process are increased efficiency, better business decision making, improved customer experience and engagement, achieved financial savings.

Business Diagram Four Colored Pie Charts For Result Analysis Data Driven PowerPoint Slide
This business diagram displays graphic of pie charts. This business slide is suitable to present and compare business data. Use this diagram to build professional presentations for your viewers.

Social Networks Marketing To Improve Youtube Advertising Audience Overview Report Microsoft PDF
This slide represents statistical data representing the usage of YouTube by audience worldwide. It includes details related to potential reach of ads on YouTube, YouTube ad reach vs total population etc. Do you have an important presentation coming up Are you looking for something that will make your presentation stand out from the rest Look no further than Social Networks Marketing To Improve Youtube Advertising Audience Overview Report Microsoft PDF. With our professional designs, you can trust that your presentation will pop and make delivering it a smooth process. And with Slidegeeks, you can trust that your presentation will be unique and memorable. So why wait Grab Social Networks Marketing To Improve Youtube Advertising Audience Overview Report Microsoft PDF today and make your presentation stand out from the rest.

We Shall Overcome Business PowerPoint Templates And PowerPoint Backgrounds 0711
Microsoft PowerPoint Template and Background with the hand showing successful growth of stock market trends
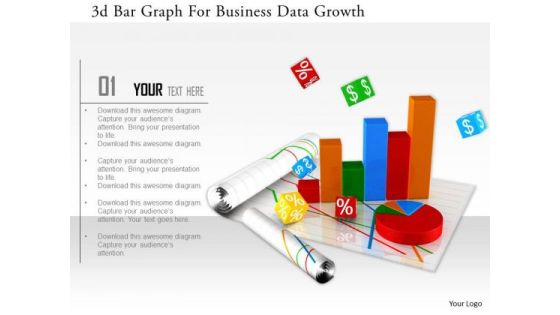
Stock Photo 3d Bar Graph For Business Data Growth Image Graphics For PowerPoint Slide
This image slide has graphics of financial charts and reports. This contains bar graph and pie chart to present business reports. Build an innovative presentations using this professional image slide.

P And L Kpis Template 2 Ppt PowerPoint Presentation Outline Clipart
This is a p and l kpis template 2 ppt powerpoint presentation outline clipart. This is a four stage process. The stages in this process are net sales, total income, expenses, profit before tax, profit after tax.

Data Center Infrastructure Management IT What Is Data Center Consolidation Information PDF
This slide depicts the data center consolidation and how it would be beneficial for companies in saving money through operational expenses and facility costs. Deliver an awe inspiring pitch with this creative data center infrastructure management it what is data center consolidation information pdf bundle. Topics like costs, performance, economic, data centers can be discussed with this completely editable template. It is available for immediate download depending on the needs and requirements of the user.

Business Data Graph Finance PowerPoint Templates And PowerPoint Backgrounds 0511
Microsoft PowerPoint Template and Background with increasing bar chart business data graph with world map
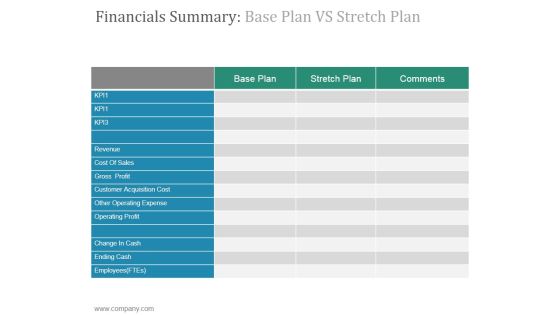
Financials Summary Base Plan VS Stretch Plan Ppt PowerPoint Presentation Design Ideas
This is a financials summary base plan vs stretch plan ppt powerpoint presentation design ideas. This is a three stage process. The stages in this process are ending cash, change in cash, operating profit, other operating expense.
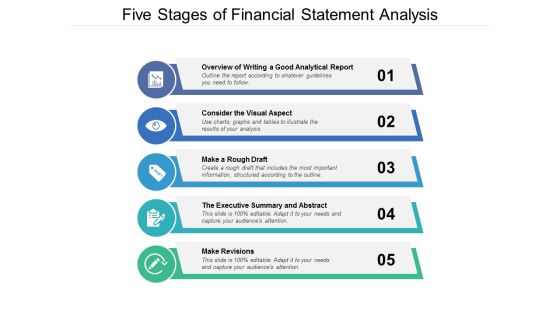
Five Stages Of Financial Statement Analysis Ppt PowerPoint Presentation Model Background Designs
Presenting this set of slides with name five stages of financial statement analysis ppt powerpoint presentation model background designs. This is a five stage process. The stages in this process are data report, infographics brochure, business statement. This is a completely editable PowerPoint presentation and is available for immediate download. Download now and impress your audience.

Data Lake Development With Azure Cloud Software Use Cases Of Centralized Repository Data Lake Icons PDF
This slide depicts the use cases of data lakes such as data in place analytics, machine learning model training and archival and historical data storage. Presenting Data Lake Development With Azure Cloud Software Use Cases Of Centralized Repository Data Lake Icons PDF to provide visual cues and insights. Share and navigate important information on five stages that need your due attention. This template can be used to pitch topics like Business Metrics, Economic, Analysis. In addtion, this PPT design contains high resolution images, graphics, etc, that are easily editable and available for immediate download.

Introduction To Data Driven Marketing Portrait PDF
This slide represents the overview of marketing used by enterprises to gain clarity regarding their target audience to effectively market their products to the customers. It includes details related to types of data significant to marketers such as customer data, financial data etc. Explore a selection of the finest Introduction To Data Driven Marketing Portrait PDF here. With a plethora of professionally designed and pre-made slide templates, you can quickly and easily find the right one for your upcoming presentation. You can use our Introduction To Data Driven Marketing Portrait PDF to effectively convey your message to a wider audience. Slidegeeks has done a lot of research before preparing these presentation templates. The content can be personalized and the slides are highly editable. Grab templates today from Slidegeeks.
Icon For Data Tracking And Market Assessment Framework Brochure PDF
This is a Icon For Data Tracking And Market Assessment Framework Brochure PDF template with various stages. Focus and dispense information on three stages using this creative set, that comes with editable features. It contains large content boxes to add your information on topics like Icon For Data, Tracking Market, Assessment Framework. You can also showcase facts, figures, and other relevant content using this PPT layout. Grab it now.
Graph02 Business PowerPoint Templates And PowerPoint Backgrounds 0511
Microsoft PowerPoint Template and Background with line graph, showing up trend in business

Adoption Curve Ppt PowerPoint Presentation Designs
This is a adoption curve ppt powerpoint presentation designs. This is a five stage process. The stages in this process are innovators, early adopters, early majority, late majority, laggards.

Digital Transformation Toolkit Accounting Finance Record To Report Value Stream With Financial Planning Download PDF
This slide elaborates how financial planning and analysis strategy can play a vital role in vendor management and order management in value stream. Deliver an awe inspiring pitch with this creative digital transformation toolkit accounting finance record to report value stream with financial planning download pdf bundle. Topics like data management, demand management, strategic sourcing, vendor mgmt can be discussed with this completely editable template. It is available for immediate download depending on the needs and requirements of the user.

Analyze Results Ppt PowerPoint Presentation Slide
This is a analyze results ppt powerpoint presentation slide. This is a two stage process. The stages in this process are analysis, business, marketing, finance, pie chart.

Financial PAR Project Budget Ppt Infographics Ideas PDF
Deliver and pitch your topic in the best possible manner with this financial par project budget ppt infographics ideas pdf. Use them to share invaluable insights on develop, cost, perform, acceptance and impress your audience. This template can be altered and modified as per your expectations. So, grab it now.
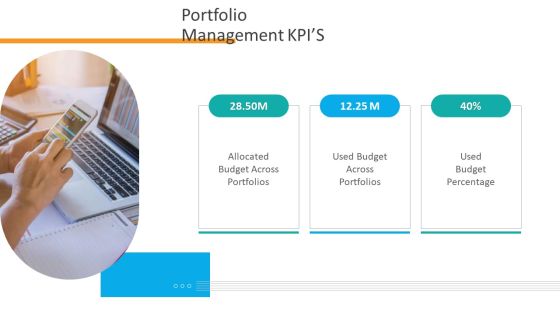
Organizational Financial Assets Assessment Portfolio Management KPIS Information PDF
Presenting organizational financial assets assessment portfolio management kpis information pdf. to provide visual cues and insights. Share and navigate important information on three stages that need your due attention. This template can be used to pitch topics like allocated budget across portfolios, used budget percentage. In addtion, this PPT design contains high resolution images, graphics, etc, that are easily editable and available for immediate download.

Big Data Financial Market Analysis Ppt PowerPoint Presentation Inspiration Graphics Download Cpb Pdf
Presenting this set of slides with name big data financial market analysis ppt powerpoint presentation inspiration graphics download cpb pdf. This is an editable Powerpoint three stages graphic that deals with topics like big data financial market analysis to help convey your message better graphically. This product is a premium product available for immediate download and is 100 percent editable in Powerpoint. Download this now and use it in your presentations to impress your audience.

Data And Customer Analysis Company Outline Development Initiatives Pictures PDF
This slide highlights the development initiatives to drive growth which includes new segments and markets, product innovation and platform automation. Make sure to capture your audiences attention in your business displays with our gratis customizable Data And Customer Analysis Company Outline Development Initiatives Pictures PDF. These are great for business strategies, office conferences, capital raising or task suggestions. If you desire to acquire more customers for your tech business and ensure they stay satisfied, create your own sales presentation with these plain slides.

Data Safety Initiatives Communication Plan For Cyber Breaches Topics PDF
Mentioned slide portrays communication plan that company will use for effectively managing cyber breaches. Sections covered here are what to communicate, description, delivery method, frequency and responsible. Presenting data safety initiatives communication plan for cyber breaches topics pdf to provide visual cues and insights. Share and navigate important information on four stages that need your due attention. This template can be used to pitch topics like communicate, delivery method, frequency, responsible, product report. In addtion, this PPT design contains high resolution images, graphics, etc, that are easily editable and available for immediate download.

Financial Data Analytics Ppt Powerpoint Presentation Show Smartart Cpb
This is a financial data analytics ppt powerpoint presentation show smartart cpb. This is a four stage process. The stages in this process are financial data analytics.
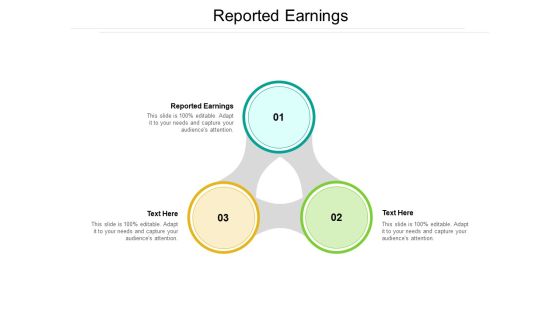
Reported Earnings Ppt PowerPoint Presentation Styles Guidelines Cpb Pdf
Presenting this set of slides with name reported earnings ppt powerpoint presentation styles guidelines cpb pdf. This is an editable Powerpoint three stages graphic that deals with topics like reported earnings to help convey your message better graphically. This product is a premium product available for immediate download and is 100 percent editable in Powerpoint. Download this now and use it in your presentations to impress your audience.
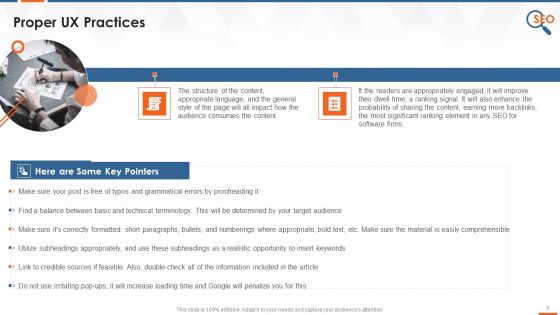
IT Company SEO Approach UX Guidelines Training Ppt
This slide covers optimizing UX or UI as SEO strategy for IT or SaaS or software companies. It also depicts that if the readers are appropriately engaged, it will improve their delay time, a ranking signal, and the probability of sharing the content, earning more backlinks, etc.

Business Framework Economic Value Add PowerPoint Presentation
This image slide displays business framework for economic value added diagram. This image slide may be used in your presentations to depict firms economic profits and business financial reports. You may change color, size and orientation of any icon to your liking. Create professional presentations using this image slide.

Financial Analysis Software Pricing Plans Effective Planning For Monetary Strategy Mockup PDF
This slide provides glimpse about multiple pricing plans for selected financial analysis software with its features. It includes features such as various financial tools and reports, sample reports availability, liquidity and profitability analysis, etc.From laying roadmaps to briefing everything in detail, our templates are perfect for you. You can set the stage with your presentation slides. All you have to do is download these easy-to-edit and customizable templates. Financial Analysis Software Pricing Plans Effective Planning For Monetary Strategy Mockup PDF will help you deliver an outstanding performance that everyone would remember and praise you for. Do download this presentation today.
Icon Showing Budget Report Of Project Planning Brochure PDF
Presenting icon showing budget report of project planning brochure pdf to dispense important information. This template comprises three stages. It also presents valuable insights into the topics including icon showing budget report of project planning. This is a completely customizable PowerPoint theme that can be put to use immediately. So, download it and address the topic impactfully.

Economic Performance Analysis Report Template Ppt PowerPoint Presentation Infographic Template Portrait
Presenting this set of slides with name economic performance analysis report template ppt powerpoint presentation infographic template portrait. The topics discussed in these slides are annual performance review, process, business performance. This is a completely editable PowerPoint presentation and is available for immediate download. Download now and impress your audience.

Investor Pitch Deck To Collect Capital From Subordinated Loan Competitive Analysis By Operational And Financial Data Diagrams PDF
The slide provides the Competitive landscape of the company on the basis of financial data sales and profit and operational data employee count, locations, year of existence etc. Deliver an awe-inspiring pitch with this creative investor pitch deck to collect capital from subordinated loan competitive analysis by operational and financial data diagrams pdf bundle. Topics like year existence, locations, major product service, interest rate, sales, employee count, profit can be discussed with this completely editable template. It is available for immediate download depending on the needs and requirements of the user.

Customer Service Focus Ppt PowerPoint Presentation Model Icon
This is a customer service focus ppt powerpoint presentation model icon. This is a four stage process. The stages in this process are marketing automation, sales force automation, customer service automation, financial system integration.

Future Agenda Business Plan Development Process Topics PDF
The slide carries future plan building to outline various actions required for achieving business success. Various steps included are research, strategize, financial forecast, build a plan and revise.Persuade your audience using this Future Agenda Business Plan Development Process Topics PDF. This PPT design covers five stages, thus making it a great tool to use. It also caters to a variety of topics including Financial Forecast, Establish Strategies, Determine Suitable Download this PPT design now to present a convincing pitch that not only emphasizes the topic but also showcases your presentation skills.
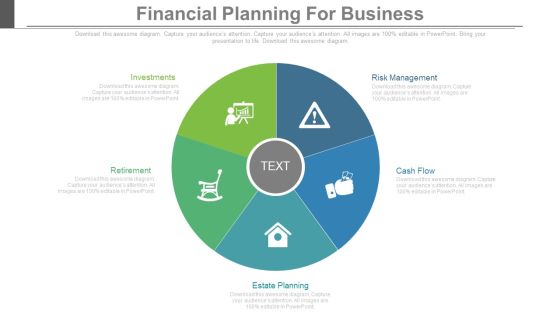
Financial Planning For Business Ppt Slides
This is a financial planning for business ppt slides. This is a five stage process. The stages in this process are business, success, marketing.

AI And ML Driving Monetary Value For Organization Need For Using AI Technologies In Business Portrait PDF
This slide shows importance of introducing AI technologies in business functions. AI technology will help the firm in providing full time customer support, enhanced decision making, data security and product flexibility. Presenting ai and ml driving monetary value for organization need for using ai technologies in business portrait pdf to provide visual cues and insights. Share and navigate important information on three stages that need your due attention. This template can be used to pitch topics like full time customer support, data security, product flexibility, enhanced decision making. In addtion, this PPT design contains high resolution images, graphics, etc, that are easily editable and available for immediate download.

Key Performance Indicators For Business Sales Analysis Ppt PowerPoint Presentation Infographic Template Introduction PDF
Presenting key performance indicators for business sales analysis ppt powerpoint presentation infographic template introduction pdf to dispense important information. This template comprises five stages. It also presents valuable insights into the topics including average purchase value, sales opportunities, sales bookings, average profit margin, sales growth. This is a completely customizable PowerPoint theme that can be put to use immediately. So, download it and address the topic impactfully.

Quantitative Analysis Of Data 5 Stages Business Plan For Bar PowerPoint Slides
We present our quantitative analysis of data 5 stages business plan for bar PowerPoint Slides.Use our Circle Charts PowerPoint Templates because Our PowerPoint Templates and Slides will give good value for money. They also have respect for the value of your time. Download our Business PowerPoint Templates because Our PowerPoint Templates and Slides will let you Leave a lasting impression to your audiences. They possess an inherent longstanding recall factor. Use our Shapes PowerPoint Templates because You can safely bank on our PowerPoint Templates and Slides. They will provide a growth factor to your valuable thoughts. Use our Signs PowerPoint Templates because You have gained great respect for your brilliant ideas. Use our PowerPoint Templates and Slides to strengthen and enhance your reputation. Download and present our Metaphors-Visual Concepts PowerPoint Templates because Our PowerPoint Templates and Slides are Clear and concise. Use them and dispel any doubts your team may have.Use these PowerPoint slides for presentations relating to business, chart, circle, circular, diagram, economy, finance, framework, graph, isolated, percentage, pie chart, results, scheme, statistics, stats, strategy, success. The prominent colors used in the PowerPoint template are Purple, Yellow, Green.

Financial Analysis Basics Ppt Slide Examples
This is a financial analysis basics ppt slide examples. This is a three stage process. The stages in this process are reduce uncertainty, apply analytical tools, involves data transform.

Business Operations Assessment Business Management Kpis Metrics Ppt Infographic Template Deck PDF
This is a business operations assessment business management kpis metrics ppt infographic template deck pdf template with various stages. Focus and dispense information on six stages using this creative set, that comes with editable features. It contains large content boxes to add your information on topics like budgeted income, received income, accounts receivable, budgeted expenses, paid expenses, accounts payable. You can also showcase facts, figures, and other relevant content using this PPT layout. Grab it now.
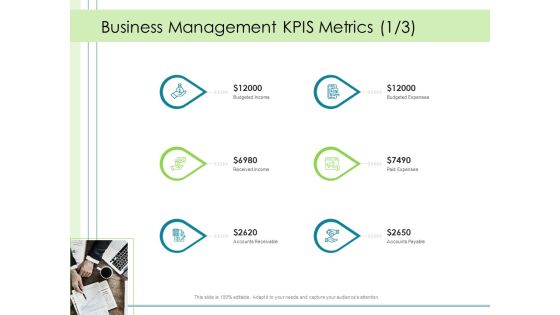
In Depth Business Assessment Business Management Kpis Metrics Ppt PowerPoint Presentation Show Demonstration PDF
This is a in depth business assessment business management kpis metrics ppt powerpoint presentation show demonstration pdf template with various stages. Focus and dispense information on six stages using this creative set, that comes with editable features. It contains large content boxes to add your information on topics like budgeted income, received income, accounts receivable, budgeted expenses, paid expenses, accounts payable. You can also showcase facts, figures, and other relevant content using this PPT layout. Grab it now.

Administrative Regulation Business Management KPIs Metrics Ppt PowerPoint Presentation Slides Shapes PDF
This is a administrative regulation business management kpis metrics ppt powerpoint presentation slides shapes pdf template with various stages. Focus and dispense information on six stages using this creative set, that comes with editable features. It contains large content boxes to add your information on topics like budgeted income, received income, accounts receivable, budgeted expenses, paid expenses, accounts payable. You can also showcase facts, figures, and other relevant content using this PPT layout. Grab it now.

Business Management Kpis Metrics Accounts Business Analysis Method Ppt Portfolio Information PDF
This is a business management kpis metrics accounts business analysis method ppt portfolio information pdf template with various stages. Focus and dispense information on six stages using this creative set, that comes with editable features. It contains large content boxes to add your information on topics like budgeted income, received income, accounts receivable, budgeted expenses, paid expenses. You can also showcase facts, figures, and other relevant content using this PPT layout. Grab it now.

Supplementary Debt Financing Pitch Deck Competitive Analysis By Operational And Financial Data Mockup PDF
Deliver and pitch your topic in the best possible manner with this supplementary debt financing pitch deck competitive analysis by operational and financial data mockup pdf. Use them to share invaluable insights on sales, service, existence, competitive, quality and impress your audience. This template can be altered and modified as per your expectations. So, grab it now.

Business Financial Data Analysis Vector Icon Ppt PowerPoint Presentation File Samples PDF
Persuade your audience using this business financial data analysis vector icon ppt powerpoint presentation file samples pdf. This PPT design covers three stages, thus making it a great tool to use. It also caters to a variety of topics including business financial data analysis vector icon. Download this PPT design now to present a convincing pitch that not only emphasizes the topic but also showcases your presentation skills.

Graph Important Concept Diagram Business Plan Template PowerPoint Templates
We present our graph important concept diagram business plan template PowerPoint templates.Use our Arrows PowerPoint Templates because Watching this your Audience will Grab their eyeballs, they wont even blink. Present our Finance PowerPoint Templates because Our PowerPoint Templates and Slides will Activate the energies of your audience. Get their creative juices flowing with your words. Download our Marketing PowerPoint Templates because Our PowerPoint Templates and Slides are topically designed to provide an attractive backdrop to any subject. Use our Signs PowerPoint Templates because Our PowerPoint Templates and Slides are specially created by a professional team with vast experience. They diligently strive to come up with the right vehicle for your brilliant Ideas. Use our Business PowerPoint Templates because It will get your audience in sync.Use these PowerPoint slides for presentations relating to chart, bar, data, pie, percent, forecasting, economy, white, achievement, future, business, arrow, sign, line, symbol, diagram, styles, finance, stock, report, marketing, gray, analyzing, shape, abstract, graph, modern, economic, up, money, solution, design, making, growth, moving, grid, progress, artistic, profit, inspiration, background, investment, successful, financial, concepts, structure, ideas. The prominent colors used in the PowerPoint template are Blue, Green, Black.

Product Planning Tool Data Quality Analysis Financial Management Ppt PowerPoint Presentation Styles Graphics Template
This is a product planning tool data quality analysis financial management ppt powerpoint presentation styles graphics template. This is a five stage process. The stages in this process are product planning tool, data quality analysis, financial management.
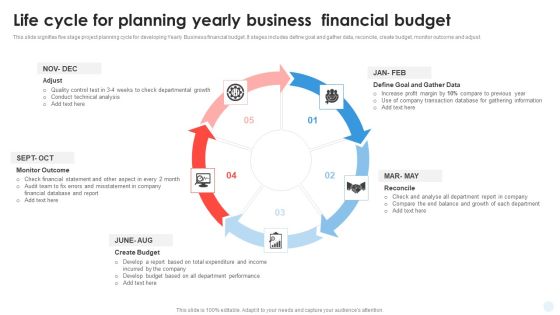
Life Cycle For Planning Yearly Business Financial Budget Template PDF
This slide signifies five stage project planning cycle for developing Yearly Business financial budget. It stages includes define goal and gather data, reconcile, create budget, monitor outcome and adjust.Persuade your audience using this Life Cycle For Planning Yearly Business Financial Budget Template PDF. This PPT design covers five stages, thus making it a great tool to use. It also caters to a variety of topics including Conduct Technical Analysis, Misstatement Company, Transaction Database. Download this PPT design now to present a convincing pitch that not only emphasizes the topic but also showcases your presentation skills.
Healthcare Financial Analysis Scorecard With Turnover And Net Income Ppt Icon Show PDF
This graph or chart is linked to excel, and changes automatically based on data. Just left click on it and select Edit Data. Deliver and pitch your topic in the best possible manner with this Healthcare Financial Analysis Scorecard With Turnover And Net Income Ppt Icon Show PDF. Use them to share invaluable insights on Planned Turnover Net, 2016 To 2020 and impress your audience. This template can be altered and modified as per your expectations. So, grab it now.

Customer Service Focus Ppt PowerPoint Presentation Model
This is a customer service focus ppt powerpoint presentation model. This is a one stage process. The stages in this process are marketing automation, customer service automation, sales force automation, financial system integration.

data collection and analysis control chart ppt powerpoint presentation styles
This is a data collection and analysis control chart ppt powerpoint presentation styles. This is a one stage process. The stages in this process are upper limit, centerline, plotted points, lower limit, point labels.
Test Tubes With Financial Data In Percentage Ratio Powerpoint Slides
This PowerPoint template contains graphics of test tubes with percentage values. You may download this PPT slide design to display financial ratio analysis. You can easily customize this template to make it more unique as per your need.
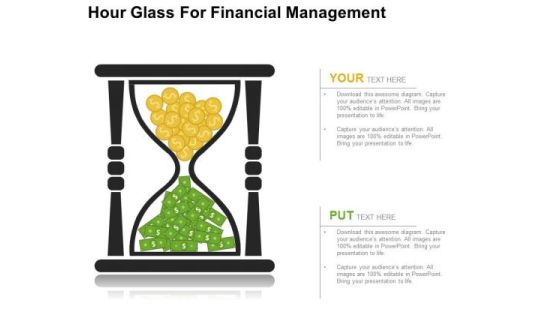
Hour Glass For Financial Management PowerPoint Templates
Create dynamic presentations with this professional slide containing a graphic of hour glass with dollar currency notes and coins. This template is designed to portray the concepts of financial management. Add this slide in your presentations to visually support your content
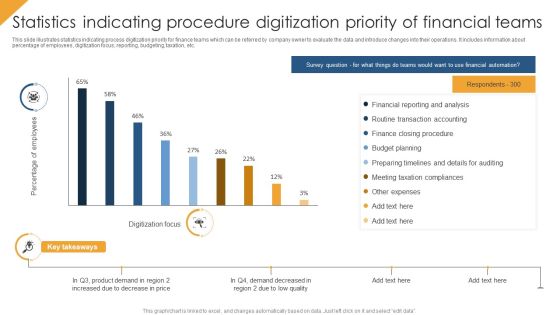
Statistics Indicating Procedure Digitization Priority Of Financial Teams Themes PDF
This slide illustrates statistics indicating process digitization priority for finance teams which can be referred by company owner to evaluate the data and introduce changes into their operations. It includes information about percentage of employees, digitization focus, reporting, budgeting, taxation, etc. Showcasing this set of slides titled Statistics Indicating Procedure Digitization Priority Of Financial Teams Themes PDF. The topics addressed in these templates are Budget Planning, Financial Reporting And Analysis, Other Expenses. All the content presented in this PPT design is completely editable. Download it and make adjustments in color, background, font etc. as per your unique business setting.

Financial Data Revelation To Varied Stakeholders Limitations Related To Financial Reporting Management Information PDF
This slide shows the limitations related to managing financial reports such as not provides full information, other sources, etc. This Financial Data Revelation To Varied Stakeholders Limitations Related To Financial Reporting Management Information PDF is perfect for any presentation, be it in front of clients or colleagues. It is a versatile and stylish solution for organizing your meetings. The Financial Data Revelation To Varied Stakeholders Limitations Related To Financial Reporting Management Information PDF features a modern design for your presentation meetings. The adjustable and customizable slides provide unlimited possibilities for acing up your presentation. Slidegeeks has done all the homework before launching the product for you. So, do not wait, grab the presentation templates today.

Yearly Business Report For 2012 2013 PowerPoint Templates Ppt Backgrounds For Slides 0313
We present our Yearly Business Report For 2012 2013 PowerPoint Templates PPT Backgrounds For Slides 0313.Download our Finance PowerPoint Templates because They will Put the wind in your sails. Skim smoothly over the choppy waters of the market. Download our Success PowerPoint Templates because You can Be the star of the show with our PowerPoint Templates and Slides. Rock the stage with your ideas. Present our Money PowerPoint Templates because You should Bet on your luck with our PowerPoint Templates and Slides. Be assured that you will hit the jackpot. Present our Business PowerPoint Templates because Our PowerPoint Templates and Slides are topically designed to provide an attractive backdrop to any subject. Use our Shapes PowerPoint Templates because You can Hit the nail on the head with our PowerPoint Templates and Slides. Embed your ideas in the minds of your audience.Use these PowerPoint slides for presentations relating to business growth per year, business, finance, success, money, shapes. The prominent colors used in the PowerPoint template are Green, Red, Yellow.

Key Performance Indicators Of The Company Ppt Professional Skills PDF
Deliver and pitch your topic in the best possible manner with this key performance indicators of the company ppt professional skills pdf. Use them to share invaluable insights on gross profit, turnover, gross profit margin, operating profit and impress your audience. This template can be altered and modified as per your expectations. So, grab it now.
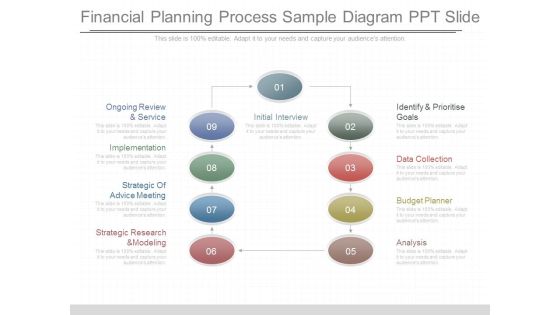
Financial Planning Process Sample Diagram Ppt Slide
This is a financial planning process sample diagram ppt slide. This is a nine stage process. The stages in this process are initial interview, identify and prioritise goals, data collection, budget planner, analysis, strategic research and modeling, strategic of advice meeting, implementation, ongoing review and service.

Ppt Homogenous Way To Prevent Banking Losses Four PowerPoint Slide Numbers Templates
PPT homogenous way to prevent banking losses four powerpoint slide numbers Templates-This PowerPoint Diagram shows you the Homogenous way to prevent Banking losses or losses in Business related Activities. It is shown by different shades of Brown color. It consists of four Stages.-PPT homogenous way to prevent banking losses four powerpoint slide numbers Templates-Arrow, Bank, Benefit, Business, Calculate, Calculation, Capitalist, Communication, Company, Concern, Connection, Data, Diagram, Digital, Drawing, Earnings, Economic, Finance, Financial, Flow, Forecast, Gain, Goal, Graph, Growth, Illustration, Increase, Information, Interest, Investing, Management, Market, Money, Move, Network, Objective, Plan, Process, Profit, Progress, Report, Rise, Risk, Shares, Statistics, Stock, System, Technology
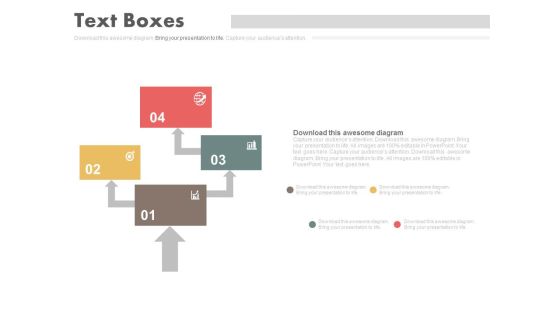
Four Steps Arrow Chart Design Powerpoint Slides
This PowerPoint template has been designed with four steps arrow chart. This PPT slide can be used to prepare presentations for marketing reports and also for financial data analysis. You can download finance PowerPoint template to prepare awesome presentations.

Money Valuation Analysis Pre And Post Funding Formats PDF
This slide shows the companys balance sheet before and after Series A fund raising. Key metrics covered in this are enterprise value, cash, debt, equity value, share price etc. Showcasing this set of slides titled Money Valuation Analysis Pre And Post Funding Formats PDF. The topics addressed in these templates are Share Price, Equity Value, Enterprise Value. All the content presented in this PPT design is completely editable. Download it and make adjustments in color, background, font etc. as per your unique business setting.
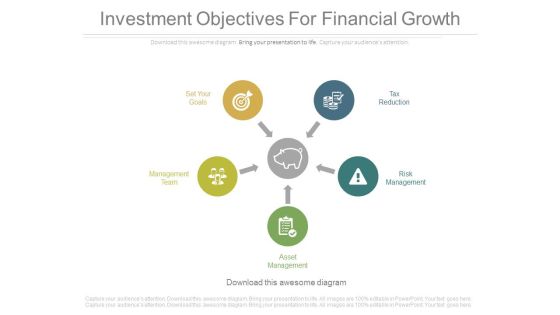
Investment Objectives For Financial Growth Ppt Slides
This is an investment objectives for financial growth ppt slides. This is a five stage process. The stages in this process are marketing, business, success, arrows.
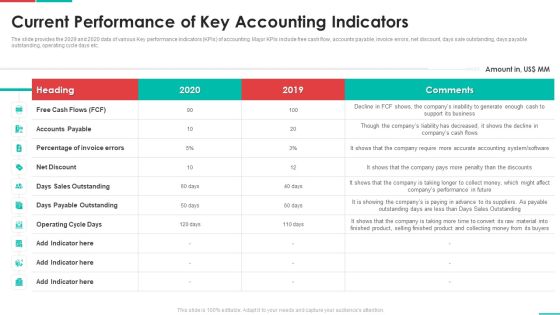
Roadmap For Financial Accounting Transformation Current Performance Of Key Accounting Indicators Elements PDF
The slide provides the 2029 and 2020 data of various Key performance indicators KPIs of accounting. Major KPIs include free cash flow, accounts payable, invoice errors, net discount, days sale outstanding, days payable outstanding, operating cycle days etc. Deliver an awe inspiring pitch with this creative roadmap for financial accounting transformation current performance of key accounting indicators elements pdf bundle. Topics like accounts payable, operating cycle days, days payable outstanding, net discount can be discussed with this completely editable template. It is available for immediate download depending on the needs and requirements of the user.

Dollars With Lock And Chain Money Investment PowerPoint Templates And PowerPoint Themes 1012
Dollars With Lock And Chain Money Investment PowerPoint Templates And PowerPoint Themes 1012-Create dynamic Microsoft office PPT Presentations with our professional templates containing a graphic of dollars with lock and chain. This image signifies the concept of data security and money investment. This image has been conceived to enable you to emphatically communicate your ideas in your Business and Financial PPT presentations on finance, protection and banking. Our PPT images are so perfectly designed that it reveals the very basis of our PPT template to make your clients understand.-Dollars With Lock And Chain Money Investment PowerPoint Templates And PowerPoint Themes 1012-This PowerPoint template can be used for presentations relating to-Dollars chained and locked, business, security, finance, money, chains

RCCA To Prevent System Program Malfunctioning Ppt PowerPoint Presentation Gallery Show PDF
Persuade your audience using this rcca to prevent system program malfunctioning ppt powerpoint presentation gallery show pdf. This PPT design covers two stages, thus making it a great tool to use. It also caters to a variety of topics including root cause, corrective action, financial. Download this PPT design now to present a convincing pitch that not only emphasizes the topic but also showcases your presentation skills.

Data Driven Marketing Solutions Firm Company Profile Net Income And Profit Margin Portrait PDF
The following slide highlights the companys net income and profit margin from all operations. It shows net income data from 2018 to 2023 to showcase growth in income Explore a selection of the finest Data Driven Marketing Solutions Firm Company Profile Net Income And Profit Margin Portrait PDF here. With a plethora of professionally designed and pre made slide templates, you can quickly and easily find the right one for your upcoming presentation. You can use our Data Driven Marketing Solutions Firm Company Profile Net Income And Profit Margin Portrait PDF to effectively convey your message to a wider audience. Slidegeeks has done a lot of research before preparing these presentation templates. The content can be personalized and the slides are highly editable. Grab templates today from Slidegeeks.
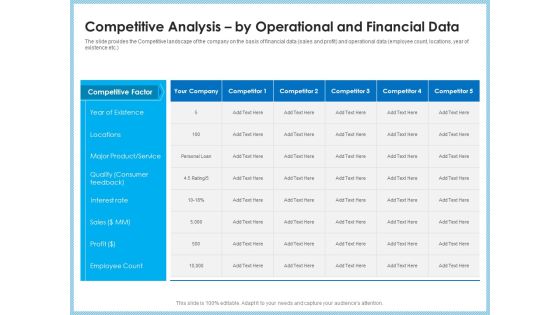
Investment Pitch To Generating Capital From Mezzanine Credit Competitive Analysis By Operational And Financial Data Inspiration PDF
The slide provides the Competitive landscape of the company on the basis of financial data sales and profit and operational data employee count, locations, year of existence etc. Deliver and pitch your topic in the best possible manner with this investment pitch to generating capital from mezzanine credit competitive analysis by operational and financial data inspiration pdf. Use them to share invaluable insights on competitive factor, year existence, locations, major product, service, quality consumer, interest rate and impress your audience. This template can be altered and modified as per your expectations. So, grab it now.

Company Financials Report Icon Illustrating Product Financial Performance Infographics PDF
Persuade your audience using this Company Financials Report Icon Illustrating Product Financial Performance Infographics PDF. This PPT design covers one stage, thus making it a great tool to use. It also caters to a variety of topics including Company Financials, Report Icon, Illustrating Product. Download this PPT design now to present a convincing pitch that not only emphasizes the topic but also showcases your presentation skills.
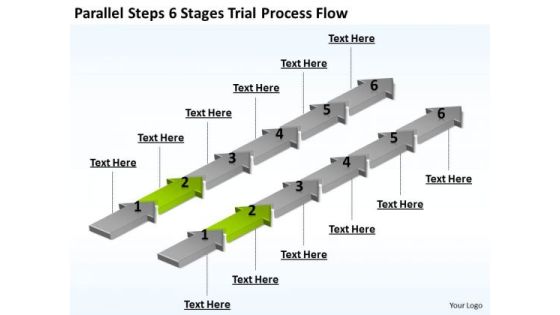
Parallel Data Processing Steps 6 Stages Trial Flow PowerPoint Templates
We present our parallel data processing steps 6 stages trial flow PowerPoint templates.Use our Arrows PowerPoint Templates because Our PowerPoint Templates and Slides are designed to help you succeed. They have all the ingredients you need. Download and present our Steps PowerPoint Templates because You can Bask in the warmth of our PowerPoint Templates and Slides. Enjoy the heartfelt glowing response of your listeners. Download and present our Success PowerPoint Templates because You will get more than you ever bargained for. Download our Process and Flows PowerPoint Templates because It can Bubble and burst with your ideas. Download our Flow Charts PowerPoint Templates because You canTake a leap off the starting blocks with our PowerPoint Templates and Slides. They will put you ahead of the competition in quick time.Use these PowerPoint slides for presentations relating to Arrows,business, chart, concept, connection,cycle, development, diagram, direction, element, environment, exchange, finance,financial, flow, graph, graphic, graphicpresentation, group, icon, illustration,investment, isolated, isometric, market, motion, movement, organization, process, processchart, recycle, report, sign, step, stock,success, symbol, vector. The prominent colors used in the PowerPoint template are Green lime, Gray, White. Presenters tell us our parallel data processing steps 6 stages trial flow PowerPoint templates are designed by a team of presentation professionals. Presenters tell us our connection PowerPoint templates and PPT Slides will get their audience's attention. Customers tell us our parallel data processing steps 6 stages trial flow PowerPoint templates will make the presenter successul in his career/life. Use our development PowerPoint templates and PPT Slides are designed by professionals Customers tell us our parallel data processing steps 6 stages trial flow PowerPoint templates look good visually. Presenters tell us our concept PowerPoint templates and PPT Slides are visually appealing.

AI And ML Driving Monetary Value For Organization AI Based IT Operations Workflow Prediction Inspiration PDF
Following slide covers artificial intelligence-based IT operations workflow. It includes information about data sources, build phase, operational phase and outcomes. Deliver and pitch your topic in the best possible manner with this ai and ml driving monetary value for organization ai based it operations workflow prediction inspiration pdf. Use them to share invaluable insights on data source, infrastructure sensors, outcomes, capacity planning, resource optimization and impress your audience. This template can be altered and modified as per your expectations. So, grab it now.

Convertible Note Pitch Deck Funding Strategy Competitive Analysis By Financial And Operational Data Ppt PowerPoint Presentation Styles Structure PDF
Presenting this set of slides with name convertible note pitch deck funding strategy competitive analysis by financial and operational data ppt powerpoint presentation styles structure pdf. The topics discussed in these slides are competitive factor, existence, locations, product service, quality consumer feedback, sales, profit marg, employee count. This is a completely editable PowerPoint presentation and is available for immediate download. Download now and impress your audience.

Proportion Circle Visual For Financial Data Analysis Guidelines PDF
Showcasing this set of slides titled proportion circle visual for financial data analysis guidelines pdf. The topics addressed in these templates are proportion circle visual for financial data analysis. All the content presented in this PPT design is completely editable. Download it and make adjustments in color, background, font etc. as per your unique business setting.

Project Context For Financial Services Data Analysis Ppt PowerPoint Presentation Professional Guidelines
Presenting this set of slides with name project context for financial services data analysis ppt powerpoint presentation professional guidelines. This is a two stage process. The stages in this process are agenda, target audiences, preferred by many, values client, strategy. This is a completely editable PowerPoint presentation and is available for immediate download. Download now and impress your audience.

Key Performance Indicators For Ecommerce Diagram Ppt Design
This is a key performance indicators for ecommerce diagram ppt design. This is a eight stage process. The stages in this process are cost strategies, price strategies, market share strategies, market size strategies, conversion optimization, social sentiment, economic factors, brand awareness.
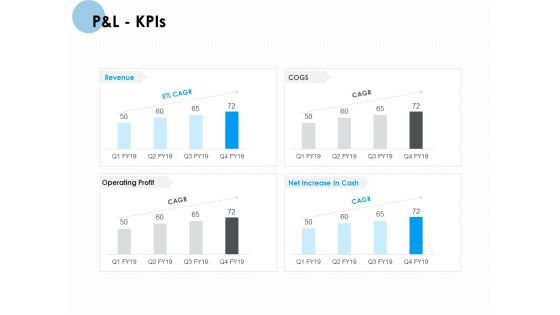
P And L Kpis Ppt PowerPoint Presentation Pictures Visual Aids
Presenting this set of slides with name p and l kpis ppt powerpoint presentation pictures visual aids. The topics discussed in these slides are net sales, total income, expenses, financing cost, profit before tax, profit after tax. This is a completely editable PowerPoint presentation and is available for immediate download. Download now and impress your audience.

Ppt Homogenous Way To Avoid Development Losses Four Steps PowerPoint Templates
PPT homogenous way to avoid development losses four steps PowerPoint Templates-The theme of this PowerPoint template is linear arrows. Use them to illustrate a stepwise process or a phase structure. You can easily change its colors-PPT homogenous way to avoid development losses four steps PowerPoint Templates-Arrow, Bank, Benefit, Business, Calculate, Calculation, Capitalist, Communication, Company, Concern, Connection, Data, Diagram, Digital, Drawing, Earnings, Economic, Finance, Financial, Flow, Forecast, Gain, Goal, Graph, Growth, Illustration, Increase, Information, Interest, Investing, Management, Market, Money, Move, Network, Objective, Plan, Process, Profit, Progress, Report, Rise, Risk, Shares, Statistics, Stock, System, Technology
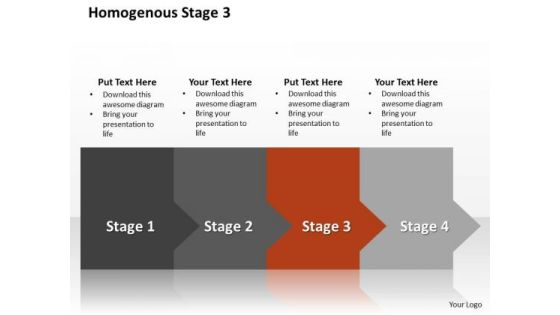
Ppt Homogenous Way To Prevent Banking Losses Stage 3 PowerPoint Templates
PPT homogenous way to prevent banking losses stage 3 PowerPoint Templates-The theme of this PowerPoint template is linear arrows. Use them to illustrate a stepwise process or a phase structure. You can easily change its colors-PPT homogenous way to prevent banking losses stage 3 PowerPoint Templates-Arrow, Bank, Benefit, Business, Calculate, Calculation, Capitalist, Communication, Company, Concern, Connection, Data, Diagram, Digital, Drawing, Earnings, Economic, Finance, Financial, Flow, Forecast, Gain, Goal, Graph, Growth, Illustration, Increase, Information, Interest, Investing, Management, Market, Money, Move, Network, Objective, Plan, Process, Profit, Progress, Report, Rise, Risk, Shares, Statistics, Stock, System, Technology

Investor Pitch Deck New Venture Capital Raising Financial Projections And Key Metrics Ideas PDF
Deliver and pitch your topic in the best possible manner with this investor pitch deck new venture capital raising financial projections and key metrics ideas pdf. Use them to share invaluable insights on sales, expenses, profits and impress your audience. This template can be altered and modified as per your expectations. So, grab it now.

Data Assimilation Foundational Data Modelling Bus Ppt Styles Ideas PDF
Deliver an awe inspiring pitch with this creative data assimilation foundational data modelling bus ppt styles ideas pdf bundle. Topics like financial, administrative, research, operational, profitability can be discussed with this completely editable template. It is available for immediate download depending on the needs and requirements of the user.

Comparative Analysis Of Data Map Software Ppt PowerPoint Presentation File Objects PDF
This slide shows data inventory software comparative assessment. It provides information such as availability of templates, customization, secured data, instant download, etc. Presenting Comparative Analysis Of Data Map Software Ppt PowerPoint Presentation File Objects PDF to dispense important information. This template comprises four stages. It also presents valuable insights into the topics including Multiple Formats, Secured Data, External Usage. This is a completely customizable PowerPoint theme that can be put to use immediately. So, download it and address the topic impactfully.

Scatter Chart Illustrating Data Analysis Ppt PowerPoint Presentation Show Graphic Tips PDF
Presenting scatter chart illustrating data analysis ppt powerpoint presentation show graphic tips pdf to dispense important information. This template comprises three stages. It also presents valuable insights into the topics including scatter chart illustrating data analysis. This is a completely customizable PowerPoint theme that can be put to use immediately. So, download it and address the topic impactfully.

Project Management Integration Icon Depicting Data Analysis Ppt Inspiration Elements PDF
Presenting Project Management Integration Icon Depicting Data Analysis Ppt Inspiration Elements PDF to dispense important information. This template comprises three stages. It also presents valuable insights into the topics including Project Management, Integration Icon, Depicting Data Analysis. This is a completely customizable PowerPoint theme that can be put to use immediately. So, download it and address the topic impactfully.
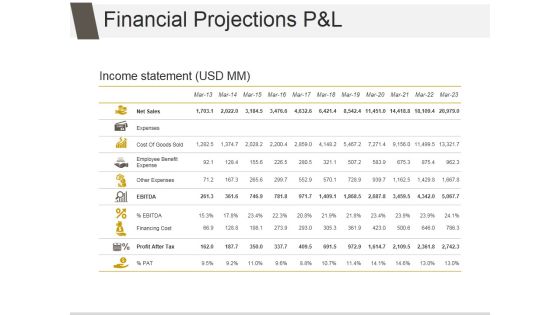
Financial Projections P And L Ppt PowerPoint Presentation Design Ideas
This is a financial projections p and l ppt powerpoint presentation design ideas. This is a eleven stage process. The stages in this process are net sales, expenses, cost of goods sold, employee benefit expense, other expenses, financing cost.

Data Collection And Analysis Control Chart Ppt PowerPoint Presentation Summary Templates
This is a data collection and analysis control chart ppt powerpoint presentation summary templates. This is a one stage process. The stages in this process are business, marketing, point label, upper limit, lower limit.

Data Collection And Analysis Control Chart Ppt PowerPoint Presentation Slide Download
This is a data collection and analysis control chart ppt powerpoint presentation slide download. This is a three stage process. The stages in this process are line chart, finance, marketing, management, investment.
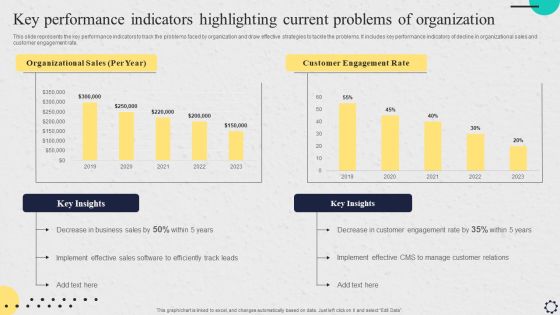
Software Implementation Strategy Key Performance Indicators Highlighting Current Problems Of Organization Professional PDF
This slide represents the key performance indicators to track the problems faced by organization and draw effective strategies to tackle the problems. It includes key performance indicators of decline in organizational sales and customer engagement rate. Make sure to capture your audiences attention in your business displays with our gratis customizable Software Implementation Strategy Key Performance Indicators Highlighting Current Problems Of Organization Professional PDF. These are great for business strategies, office conferences, capital raising or task suggestions. If you desire to acquire more customers for your tech business and ensure they stay satisfied, create your own sales presentation with these plain slides.
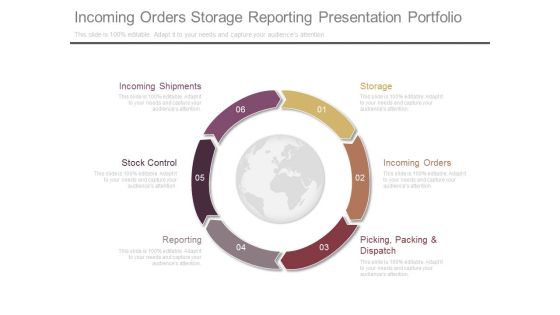
Incoming Orders Storage Reporting Presentation Portfolio
This is a incoming orders storage reporting presentation portfolio. This is a six stage process. The stages in this process are storage, incoming orders, picking packing and dispatch, reporting, stock control, incoming shipments.

Data Analyst Job Profile Description Report Infographics PDF
This slide illustrate job description of data analyst that helps to solve complex business problems and use data to find useful insights that helps in generating profit. It includes elements such as skill set required, benefits and perks, salary, roles and responsibility etc. Presenting Data Analyst Job Profile Description Report Infographics PDF to dispense important information. This template comprises three stages. It also presents valuable insights into the topics including Skill Required, Benefits Perks, Skill Required. This is a completely customizable PowerPoint theme that can be put to use immediately. So, download it and address the topic impactfully.

Data Mining In CRM Customer Relationship Management CRM Graphics PDF
Deliver and pitch your topic in the best possible manner with this data mining in crm customer relationship management crm graphics pdf. Use them to share invaluable insights on analysis, strategies, profitable, target marketing and impress your audience. This template can be altered and modified as per your expectations. So, grab it now.

Advanced Email Metrics And Analysis Services Diagram Slide
This is a advanced email metrics and analysis services diagram slide. This is a four stage process. The stages in this process are analytics data warehouse, data mining, financial modeling.

Key Kpis To Measure Sustainability At Organization Icons PDF
This slide highlights various performance indicators to measure sustainability performance at workplace to monitor and track practices. It includes key components such as environmental KPIs, social KPIs and economic KPIs. Presenting Key Kpis To Measure Sustainability At Organization Icons PDF to dispense important information. This template comprises three stages. It also presents valuable insights into the topics including Environmental, Social, Economic. This is a completely customizable PowerPoint theme that can be put to use immediately. So, download it and address the topic impactfully.

Data Assimilation Business Intelligence KPI Metrics Days Ppt Infographic Template Designs PDF
This is a data assimilation business intelligence kpi metrics days ppt infographic template designs pdf template with various stages. Focus and dispense information on four stages using this creative set, that comes with editable features. It contains large content boxes to add your information on topics like days since last accident, net profit margin, remaining inventory, response time. You can also showcase facts, figures, and other relevant content using this PPT layout. Grab it now.
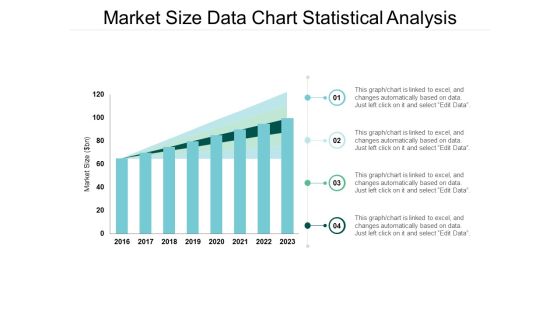
Market Size Data Chart Statistical Analysis Ppt Powerpoint Presentation Model Format
This is a market size data chart statistical analysis ppt powerpoint presentation model format. The topics discussed in this diagram are market growth, market opportunity, market profitability. This is a completely editable PowerPoint presentation, and is available for immediate download.
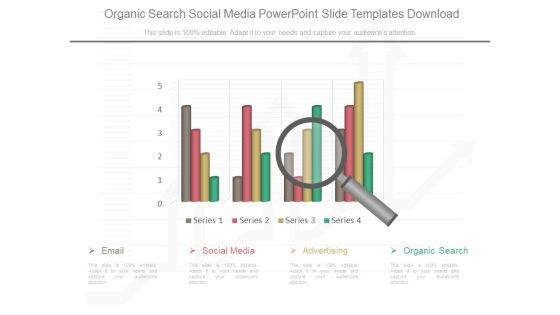
Organic Search Social Media Powerpoint Slide Templates Download
This is a organic search social media powerpoint slide templates download. This is a four stage process. The stages in this process are email, social media, advertising, organic search, series.

Illustration Of 9 Stages Market Analysis Diagram Business Plan PowerPoint Templates
We present our illustration of 9 stages market analysis diagram business plan PowerPoint templates.Download and present our Communication PowerPoint Templates because Our PowerPoint Templates and Slides will let you Hit the target. Go the full distance with ease and elan. Present our Marketing PowerPoint Templates because Our PowerPoint Templates and Slides will weave a web of your great ideas. They are gauranteed to attract even the most critical of your colleagues. Download and present our Business PowerPoint Templates because Our PowerPoint Templates and Slides help you meet the demand of the Market. Just browse and pick the slides that appeal to your intuitive senses. Present our Shapes PowerPoint Templates because Timeline crunches are a fact of life. Meet all deadlines using our PowerPoint Templates and Slides. Present our Process and Flows PowerPoint Templates because Our PowerPoint Templates and Slides will let you Clearly mark the path for others to follow.Use these PowerPoint slides for presentations relating to Market, sales, statistics, economy, target, achievement, corporate, business, success, presentation, diagram, finance, data, stock, analysis, flowchart, drawing, report, calculation, graph, illustration, economic, chart, money, pie-chart, planning, design, growth, pencil, company, competition, progress, investment, analyze, office, banking, financial, cash, exchange. The prominent colors used in the PowerPoint template are Yellow, Gray, Black.

Competitors Analysis Charts Graphs To Display Data Company Profiles Ppt PowerPoint Presentation Outline Visual Aids
This is a competitors analysis charts graphs to display data company profiles ppt powerpoint presentation outline visual aids. This is a five stage process. The stages in this process are finance, analysis, business, investment, marketing.

Illustration Of 9 Stages Market Analysis Diagram Ppt Business Plan Tools PowerPoint Templates
We present our illustration of 9 stages market analysis diagram ppt business plan tools PowerPoint templates.Use our Communication PowerPoint Templates because Our PowerPoint Templates and Slides are specially created by a professional team with vast experience. They diligently strive to come up with the right vehicle for your brilliant Ideas. Use our Marketing PowerPoint Templates because Our PowerPoint Templates and Slides will let you Hit the target. Go the full distance with ease and elan. Use our Business PowerPoint Templates because Our PowerPoint Templates and Slides will let you Leave a lasting impression to your audiences. They possess an inherent longstanding recall factor. Present our Shapes PowerPoint Templates because our PowerPoint Templates and Slides are the string of your bow. Fire of your ideas and conquer the podium. Present our Process and Flows PowerPoint Templates because You aspire to touch the sky with glory. Let our PowerPoint Templates and Slides provide the fuel for your ascent.Use these PowerPoint slides for presentations relating to Market, sales, statistics, economy, target, achievement, corporate, business, success, presentation, diagram, finance, data, stock, analysis, flowchart, drawing, report, calculation, graph, illustration, economic, chart, money, pie-chart, planning, design, growth, pencil, company, competition, progress, investment, analyze, office, banking, financial, cash, exchange. The prominent colors used in the PowerPoint template are Blue, Gray, Black.
Illustration Of 9 Stages Market Analysis Diagram Ppt Personal Business Plan PowerPoint Templates
We present our illustration of 9 stages market analysis diagram ppt personal business plan PowerPoint templates.Download and present our Communication PowerPoint Templates because Our PowerPoint Templates and Slides will let you Clearly mark the path for others to follow. Use our Marketing PowerPoint Templates because You can Bait your audience with our PowerPoint Templates and Slides. They will bite the hook of your ideas in large numbers. Use our Business PowerPoint Templates because Our PowerPoint Templates and Slides provide you with a vast range of viable options. Select the appropriate ones and just fill in your text. Download our Shapes PowerPoint Templates because You can Hit the nail on the head with our PowerPoint Templates and Slides. Embed your ideas in the minds of your audience. Download our Process and Flows PowerPoint Templates because Our PowerPoint Templates and Slides are conceived by a dedicated team. Use them and give form to your wondrous ideas.Use these PowerPoint slides for presentations relating to Market, sales, statistics, economy, target, achievement, corporate, business, success, presentation, diagram, finance, data, stock, analysis, flowchart, drawing, report, calculation, graph, illustration, economic, chart, money, pie-chart, planning, design, growth, pencil, company, competition, progress, investment, analyze, office, banking, financial, cash, exchange. The prominent colors used in the PowerPoint template are Blue, Gray, Black.
Illustration Of 9 Stages Market Analysis Diagram Ppt Business Plan Formats PowerPoint Templates
We present our illustration of 9 stages market analysis diagram ppt business plan formats PowerPoint templates.Download and present our Communication PowerPoint Templates because Our PowerPoint Templates and Slides are aesthetically designed to attract attention. We gaurantee that they will grab all the eyeballs you need. Download and present our Marketing PowerPoint Templates because It will mark the footprints of your journey. Illustrate how they will lead you to your desired destination. Download and present our Business PowerPoint Templates because Our PowerPoint Templates and Slides will fulfill your every need. Use them and effectively satisfy the desires of your audience. Present our Shapes PowerPoint Templates because Our PowerPoint Templates and Slides will let you Illuminate the road ahead to Pinpoint the important landmarks along the way. Download our Process and Flows PowerPoint Templates because It will mark the footprints of your journey. Illustrate how they will lead you to your desired destination.Use these PowerPoint slides for presentations relating to Market, sales, statistics, economy, target, achievement, corporate, business, success, presentation, diagram, finance, data, stock, analysis, flowchart, drawing, report, calculation, graph, illustration, economic, chart, money, pie-chart, planning, design, growth, pencil, company, competition, progress, investment, analyze, office, banking, financial, cash, exchange. The prominent colors used in the PowerPoint template are Green, Gray, Black.
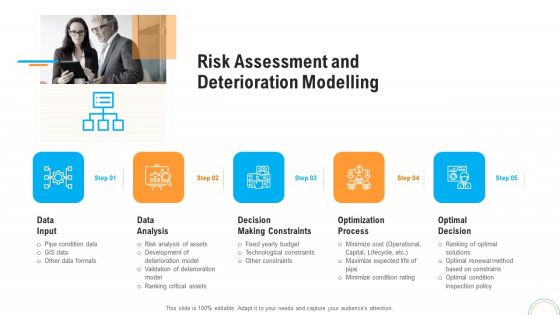
Fiscal And Operational Assessment Risk Assessment And Deterioration Modelling Demonstration PDF
Presenting fiscal and operational assessment risk assessment and deterioration modelling demonstration pdf to provide visual cues and insights. Share and navigate important information on five stages that need your due attention. This template can be used to pitch topics like data analysis, decision making constraints, optimization process. In addtion, this PPT design contains high resolution images, graphics, etc, that are easily editable and available for immediate download.

Different Categories Of Data Centers Types Of Data Centers Managed Services Data Centers Ideas PDF
This slide illustrates managed services type of data center that are managed by third-party organizations and help to save money to the businesses. The Different Categories Of Data Centers Types Of Data Centers Managed Services Data Centers Ideas PDF is a compilation of the most recent design trends as a series of slides. It is suitable for any subject or industry presentation, containing attractive visuals and photo spots for businesses to clearly express their messages. This template contains a variety of slides for the user to input data, such as structures to contrast two elements, bullet points, and slides for written information. Slidegeeks is prepared to create an impression.

Data Collection Histograms Ppt PowerPoint Presentation Outline Show
This is a data collection histograms ppt powerpoint presentation outline show. This is a seven stage process. The stages in this process are business, marketing, strategy, finance, analysis.

Monthly Traffic Source Overview Ppt PowerPoint Presentation Layouts Show
This is a monthly traffic source overview ppt powerpoint presentation layouts show. This is a three stage process. The stages in this process are google, vine press net, yahoo, bing, sources.

Data Interpretation And Analysis Playbook Automated Discovery Of Insights Challenges Clipart PDF
This template covers the problems while implementing automated discovery of insights in the organization. The challenges are that traditional BI only succeeds when users know the right questions to ask and organizations are missing out on the hidden interpretation of the data, which might be useful. This is a data interpretation and analysis playbook automated discovery of insights challenges clipart pdf template with various stages. Focus and dispense information on two stages using this creative set, that comes with editable features. It contains large content boxes to add your information on topics like opportunities, organizations, business. You can also showcase facts, figures, and other relevant content using this PPT layout. Grab it now.

Guidebook For Executing Business Market Intelligence Brief Of Gap Analysis For Data Evaluation Professional PDF
The following slide highlights overview of gap analysis method for data evaluation and identify variance between actual and estimated performance. It also presents various advantages which are profit percentage analysis, process improvement, market opportunities and understand KPIs. Crafting an eye catching presentation has never been more straightforward. Let your presentation shine with this tasteful yet straightforward Guidebook For Executing Business Market Intelligence Brief Of Gap Analysis For Data Evaluation Professional PDF template. It offers a minimalistic and classy look that is great for making a statement. The colors have been employed intelligently to add a bit of playfulness while still remaining professional. Construct the ideal Guidebook For Executing Business Market Intelligence Brief Of Gap Analysis For Data Evaluation Professional PDF that effortlessly grabs the attention of your audience Begin now and be certain to wow your customers.

Data Driven Comparison Charts For Analysis Powerpoint Slides
You can download this PowerPoint template to display statistical data and analysis. This PPT slide contains data driven comparison charts. Draw an innovative business idea using this professional diagram.

Data Analysis Vector Icons Ppt Powerpoint Presentation Layouts Gridlines
This is a data analysis vector icons ppt powerpoint presentation layouts gridlines. This is a two stage process. The stages in this process are data presentation, content presentation, information presentation.

Data Interpretation Percentage Analysis Ppt Powerpoint Presentation Summary Icon
This is a data interpretation percentage analysis ppt powerpoint presentation summary icon. This is a six stage process. The stages in this process are data presentation, content presentation, information presentation.
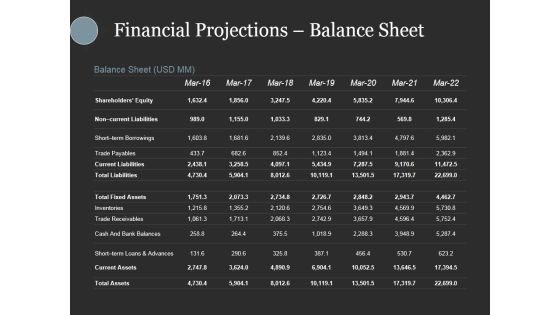
Financial Projections Balance Sheet Ppt PowerPoint Presentation Gallery Design Inspiration
This is a financial projections balance sheet ppt powerpoint presentation gallery design inspiration. This is a seven stage process. The stages in this process are shareholders equity, non current liabilities, short term borrowings, trade payables, current liabilities.
