AI PPT Maker
Templates
PPT Bundles
Design Services
Business PPTs
Business Plan
Management
Strategy
Introduction PPT
Roadmap
Self Introduction
Timelines
Process
Marketing
Agenda
Technology
Medical
Startup Business Plan
Cyber Security
Dashboards
SWOT
Proposals
Education
Pitch Deck
Digital Marketing
KPIs
Project Management
Product Management
Artificial Intelligence
Target Market
Communication
Supply Chain
Google Slides
Research Services
 One Pagers
All Categories
-
Home
- Customer Favorites
- Revenue Dashboard
Revenue Dashboard

Capital Expenditure Budget Planning Report Icon Ppt Infographic Template Graphics Template PDF
Persuade your audience using this Capital Expenditure Budget Planning Report Icon Ppt Infographic Template Graphics Template PDF. This PPT design covers one stages, thus making it a great tool to use. It also caters to a variety of topics including Capital Expenditure, Budget Planning Report, Icon. Download this PPT design now to present a convincing pitch that not only emphasizes the topic but also showcases your presentation skills.
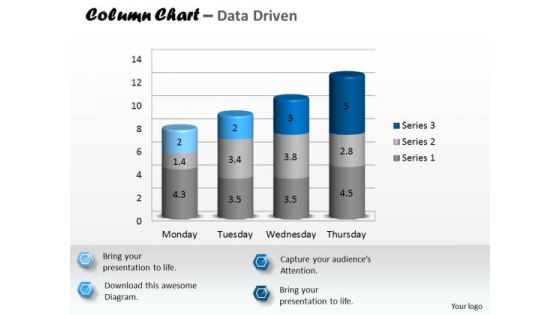
Data Analysis In Excel 3d Column Chart To Represent Information PowerPoint Templates
Rake In The Dough With
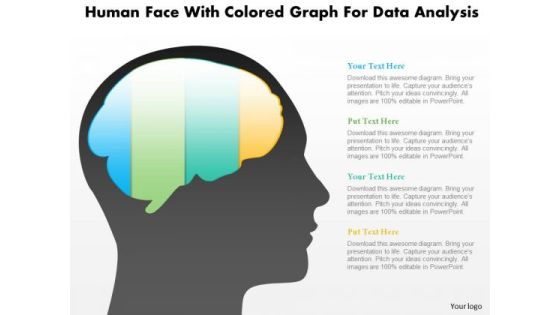
Business Diagram Human Face With Colored Graph For Data Analysis PowerPoint Slide
This diagram displays human face graphic with colored graph. This diagram can be used to represent strategy, planning, thinking of business plan. Display business options in your presentations by using this creative diagram.
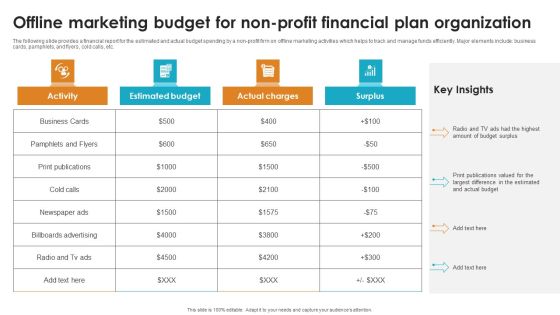
Offline Marketing Budget For Non Profit Financial Plan Organization Diagrams PDF
The following slide provides a financial report for the estimated and actual budget spending by a non profit firm on offline marketing activities which helps to track and manage funds efficiently. Major elements include business cards, pamphlets, and flyers, cold calls, etc.Showcasing this set of slides titled Offline Marketing Budget For Non Profit Financial Plan Organization Diagrams PDF. The topics addressed in these templates are unique. All the content presented in this PPT design is completely editable. Download it and make adjustments in color, background, font etc. as per your business setting.
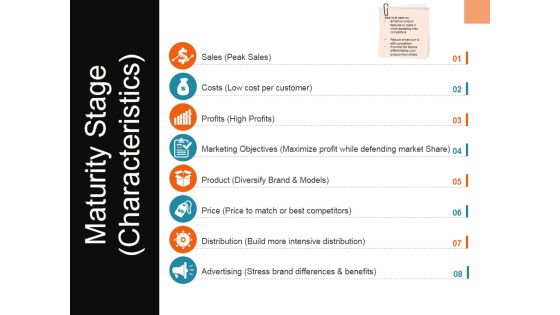
Maturity Stage Characteristics Ppt PowerPoint Presentation Slides Show
This is a maturity stage characteristics ppt powerpoint presentation slides show. This is a eight stage process. The stages in this process are sales, costs, profits, marketing objectives, product.

Accounting Key Performance Indicators Ppt Powerpoint
This is a accounting key performance indicators ppt powerpoint. This is a four stage process. The stages in this process are cost per invoice, invoice processing speed, productivity per team member, variance analysis.

Business And Financial Analysis Ppt PowerPoint Presentation Inspiration Design Templates
This is a business and financial analysis ppt powerpoint presentation inspiration design templates. This is a eight stage process. The stages in this process are investment, equipment, land cost, interior cost, employee cost.
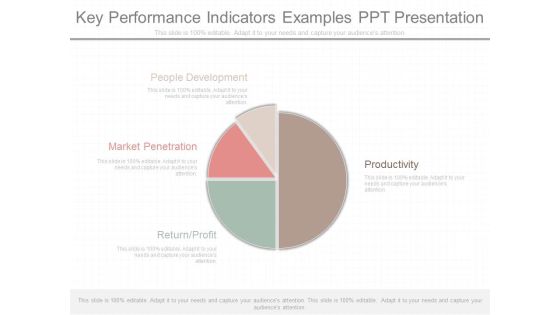
Key Performance Indicators Examples Ppt Presentation
This is a key performance indicators examples ppt presentation. This is a four stage process. The stages in this process are people development, productivity, market penetration, return profit.
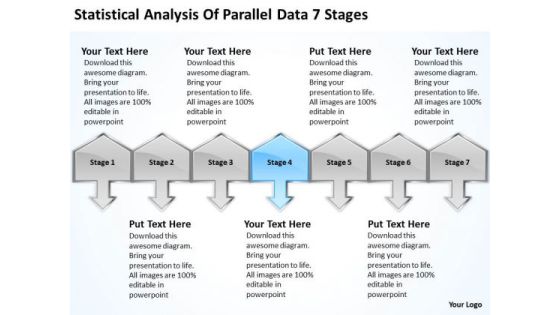
Analysis Of Parallel Data 7 Stages Ppt Cleaning Service Business Plan PowerPoint Templates
We present our analysis of parallel data 7 stages ppt cleaning service business plan PowerPoint templates.Use our Arrows PowerPoint Templates because you have a great training programme in mind to upgrade the skills of your staff. Use our Shapes PowerPoint Templates because you will be able to Highlight your ideas broad-based on strong fundamentals and illustrate how they step by step acheive the set growth factor. Present our Metaphors-Visual Concepts PowerPoint Templates because it helps to anticipate the doubts and questions in the minds of your colleagues and enlighten them with your inspired strategy to garner desired success. Present our Signs PowerPoint Templates because our presentation designs are for those on the go. Use our Business PowerPoint Templates because you have had a great year or so business wise. It is time to celebrate the efforts of your team.Use these PowerPoint slides for presentations relating to achieve, achievement, action, business, chinese, company, concept, conceptual, corporate, definition, idea, macro, market, nature, organization, paintbrush, plan, profit, research, results, sand, shape, single, success, successful, symbol, text, translation, treasure, vision, word. The prominent colors used in the PowerPoint template are Blue light, Gray, Black. People tell us our analysis of parallel data 7 stages ppt cleaning service business plan PowerPoint templates are Handsome. Use our concept PowerPoint templates and PPT Slides are Precious. Use our analysis of parallel data 7 stages ppt cleaning service business plan PowerPoint templates are Multicolored. PowerPoint presentation experts tell us our corporate PowerPoint templates and PPT Slides are topically designed to provide an attractive backdrop to any subject. People tell us our analysis of parallel data 7 stages ppt cleaning service business plan PowerPoint templates are Clever. Customers tell us our concept PowerPoint templates and PPT Slides are Glamorous.
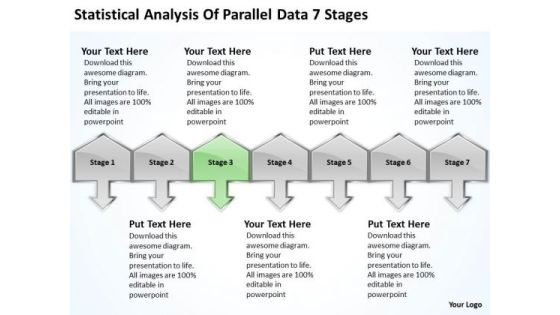
Analysis Of Parallel Data 7 Stages Ppt Franchise Business Plan Sample PowerPoint Slides
We present our analysis of parallel data 7 stages ppt franchise business plan sample PowerPoint Slides.Download our Arrows PowerPoint Templates because You have gained great respect for your brilliant ideas. Use our PowerPoint Templates and Slides to strengthen and enhance your reputation. Download and present our Shapes PowerPoint Templates because you can see clearly through to the bigger bowl ahead. Time your jump to perfection and hit the nail on the head. Download our Metaphors-Visual Concepts PowerPoint Templates because you know that the core of any organisation is the people who work for it. Use our Signs PowerPoint Templates because support groups are an essential element of the on going struggle against cancer. Download our Business PowerPoint Templates because this diagram can set an example to enthuse your team with the passion and fervour of your ideas.Use these PowerPoint slides for presentations relating to achieve, achievement, action, business, chinese, company, concept, conceptual, corporate, definition, idea, macro, market, nature, organization, paintbrush, plan, profit, research, results, sand, shape, single, success, successful, symbol, text, translation, treasure, vision, word. The prominent colors used in the PowerPoint template are Green, Gray, Black. People tell us our analysis of parallel data 7 stages ppt franchise business plan sample PowerPoint Slides are Quaint. Use our action PowerPoint templates and PPT Slides are Nifty. Use our analysis of parallel data 7 stages ppt franchise business plan sample PowerPoint Slides are Ultra. PowerPoint presentation experts tell us our corporate PowerPoint templates and PPT Slides are Magical. People tell us our analysis of parallel data 7 stages ppt franchise business plan sample PowerPoint Slides are Spiffy. Customers tell us our corporate PowerPoint templates and PPT Slides are Dynamic.

Business Diagram Alarm Clock With Pie Chart For Result Analysis PowerPoint Slide
This business slide displays alarm clock with pie chart. This diagram is a data visualization tool that gives you a simple way to present statistical information. This slide helps your audience examine and interpret the data you present.

Convertible Bonds Pitch Deck For Increasing Capitals Competitive Analysis By Financial And Operational Data Microsoft PDF
The slide provides the Competitive landscape of the company on the basis of financial data sales and profit and operational data employee count, locations, year of existence etc. Deliver an awe-inspiring pitch with this creative convertible bonds pitch deck for increasing capitals competitive analysis by financial and operational data microsoft pdf bundle. Topics like locations number outlets, major product, service, quality consumer feedback, sales, profit margin, employee count, year existence can be discussed with this completely editable template. It is available for immediate download depending on the needs and requirements of the user.

Business Diagram Flask With Data Driven Chart PowerPoint Slide
This data driven diagram has been designed with flask graphics. Download this diagram to give your presentations more effective look. It helps in clearly conveying your message to clients and audience.

Business Diagram Laptop With Data Driven Area Chart PowerPoint Slide
This diagram has been designed with laptop and data driven area chart. Download this diagram to give your presentations more effective look. It helps in clearly conveying your message to clients and audience.
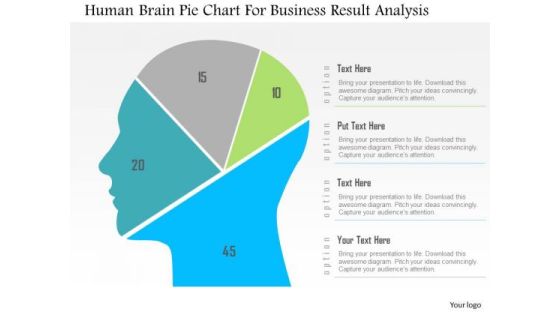
Business Diagram Human Brain Pie Chart For Business Result Analysis PowerPoint Slide
This diagram displays human face graphic divided into sections. This section can be used for data display. Use this diagram to build professional presentations for your viewers.

Corporate Intelligence Business Analysis Foundational Data Modelling Risk Ppt Infographics Vector PDF
Deliver an awe-inspiring pitch with this creative corporate intelligence business analysis foundational data modelling risk ppt infographics vector pdf bundle. Topics like sources systems, data cubes, financial and reporting can be discussed with this completely editable template. It is available for immediate download depending on the needs and requirements of the user.
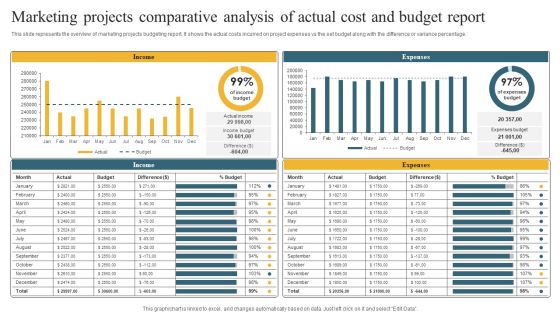
Marketing Projects Comparative Analysis Of Actual Cost And Budget Report Themes PDF
This slide represents the overview of marketing projects budgeting report. It shows the actual costs incurred on project expenses vs the set budget along with the difference or variance percentage. Showcasing this set of slides titled Marketing Projects Comparative Analysis Of Actual Cost And Budget Report Themes PDF. The topics addressed in these templates are Income, Expenses, Report. All the content presented in this PPT design is completely editable. Download it and make adjustments in color, background, font etc. as per your unique business setting.

Business Diagram 3d Colorful Pie Graph With Magnifier Data Search PowerPoint Slide
This business slide displays 3d colorful pie graph with magnifier. This diagram is a data visualization tool that gives you a simple way to present statistical information. This slide helps your audience examine and interpret the data you present.

Business Diagram Data Driven Pie Chart Inside The Magnifier PowerPoint Slide
This business slide displays 3d colorful pie graph with magnifier. This diagram is a data visualization tool that gives you a simple way to present statistical information. This slide helps your audience examine and interpret the data you present.

Budget Report Ppt PowerPoint Presentation Outline Examples
This is a budget report ppt powerpoint presentation outline examples. This is a five stage process. The stages in this process are project, amount, expenses, future scheduled, remaining.
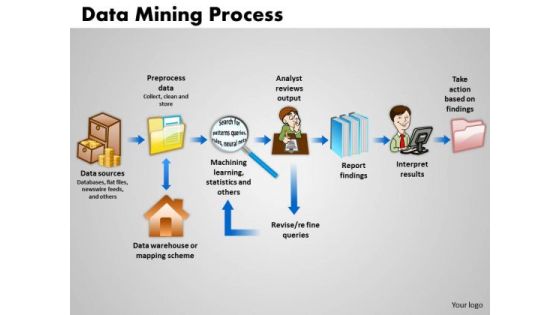
Business Arrows PowerPoint Templates Success Data Mining Process Ppt Slides
Business Arrows PowerPoint Templates Success data mining process PPT Slides-This data mining PowerPoint template can be used for example in presentations where you need to explain data mining algorithms-Business Arrows PowerPoint Templates Success data mining process PPT Slides-This template can be used for presentations relating to Analysis, Anomaly, Artificial, Break, Clean, Computer, Cut, Data, Database, Decision, Detection, Discovery, Divide, Explore, Extract, Hammer, Helmet, Human, Index, Intelligence, Kdd, knowledge, Learning, Light, Mallet, Management, Mining, Model, Movement, Pattern, Predictive, Process, Records, Recycle, Repair, Safety, Science

Company Financial Forecast And Essential Metrics Ppt Model Design Templates PDF
This slide shows the projections of the financials of a company with the key performance indicators to know exactly where the business stands and what needs to be enhanced or reduced to make the business profitable. Showcasing this set of slides titled Company Financial Forecast And Essential Metrics Ppt Model Design Templates PDF. The topics addressed in these templates are Budget, Income, Expense, 2018 To 2022. All the content presented in this PPT design is completely editable. Download it and make adjustments in color, background, font etc. as per your unique business setting.

International Apparel Manufacturing Report With Market Growth Forecast Inspiration PDF
This slide showcases global manufacturing insights for apparel market that can help organization to identify the growth in last financial years and make investment decisions on the basis of past data. It also showcases growth forecast for a period of next 6 financial years. Pitch your topic with ease and precision using this International Apparel Manufacturing Report With Market Growth Forecast Inspiration PDF. This layout presents information on Apparel Manufacturing, Market Growth Forecast, Billion. It is also available for immediate download and adjustment. So, changes can be made in the color, design, graphics or any other component to create a unique layout.
Business Diagram 3d Capsule With Multiple Icons For Business Data Flow PowerPoint Slide
This diagram has been designed with 3d graphic of capsule with multiple icons. This data driven PowerPoint slide can be used to give your presentations more effective look. It helps in clearly conveying your message to clients and audience.
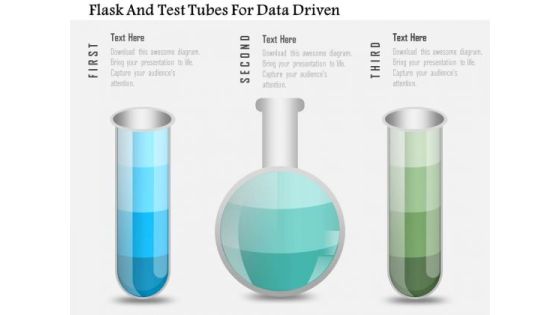
Business Diagram Flask And Test Tubes For Data Driven PowerPoint Slide
This data driven diagram has been designed with flask and test tubes. Download this diagram to give your presentations more effective look. It helps in clearly conveying your message to clients and audience.
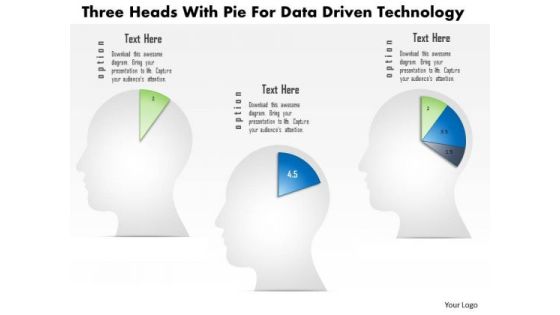
Business Diagram Three Heads With Pie For Data Driven Technology PowerPoint Slide
This business diagram displays three human faces with pie charts. This Power Point template has been designed to compare and present business data. You may use this diagram to impart professional appearance to your presentations.
Financial Charts Data Analysis Vector Icon Ppt PowerPoint Presentation Visual Aids Summary Cpb
This is a financial charts data analysis vector icon ppt powerpoint presentation visual aids summary cpb. This is a three stage process. The stages in this process are data analysis, analytics architecture, analytics framework.

Analyzing Brands Key Financial Indicators Ppt Infographic Template Slides PDF
This slide showcases assessing key indicators for measuring financial performance of brand. It provides details about turnover, marketing costs, sales, administrative expenses, profit, percentage turnover, trade debtor days, headcount, etc. Are you in need of a template that can accommodate all of your creative concepts This one is crafted professionally and can be altered to fit any style. Use it with Google Slides or PowerPoint. Include striking photographs, symbols, depictions, and other visuals. Fill, move around, or remove text boxes as desired. Test out color palettes and font mixtures. Edit and save your work, or work with colleagues. Download Analyzing Brands Key Financial Indicators Ppt Infographic Template Slides PDF and observe how to make your presentation outstanding. Give an impeccable presentation to your group and make your presentation unforgettable.

Effectiveness Of Social Media Data Insights For Marketers Ideas PDF
The following slide depicts the effectiveness of social media insights for marketers. This data analysis helps them to formulate strategies, understand the target audience, evaluate campaign performance, assess ROI etc. Showcasing this set of slides titled Effectiveness Of Social Media Data Insights For Marketers Ideas PDF. The topics addressed in these templates are Effectiveness, Social Media, Marketers. All the content presented in this PPT design is completely editable. Download it and make adjustments in color, background, font etc. as per your unique business setting.

Corporate Execution Financial Liability Report Key Performance Indicators Summary Rules PDF
Presenting this set of slides with name corporate execution financial liability report key performance indicators summary rules pdf. The topics discussed in these slides are procurement, strategic, goals, target, procurement. This is a completely editable PowerPoint presentation and is available for immediate download. Download now and impress your audience.
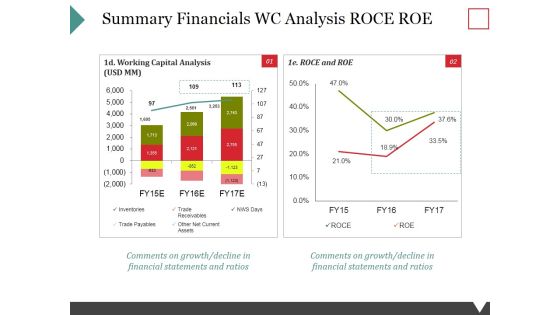
Summary Financials Wc Analysis Roce Roe Ppt PowerPoint Presentation Show Inspiration
This is a summary financials wc analysis roce roe ppt powerpoint presentation show inspiration. This is a two stage process. The stages in this process are inventories, trade payables, trade receivables, other net current assets, nws days.
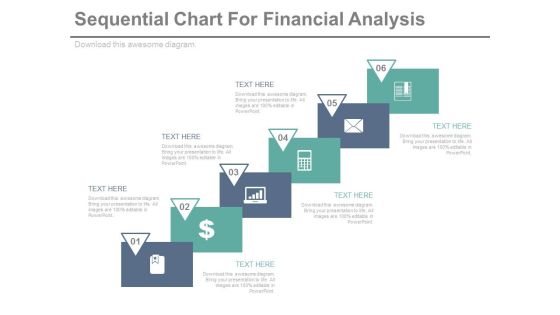
Sequential Steps Chart For Data Analysis Powerpoint Slides
This PowerPoint template has been designed sequential steps chart with icons. This PPT slide can be used to display corporate level financial strategy. You can download finance PowerPoint template to prepare awesome presentations.

Convertible Market Notes Competitive Analysis By Financial And Operational Data Ppt Ideas Examples PDF
Deliver an awe inspiring pitch with this creative convertible market notes competitive analysis by financial and operational data ppt ideas examples pdf bundle. Topics like sales, profit margin, competitor, competitive can be discussed with this completely editable template. It is available for immediate download depending on the needs and requirements of the user.

Eight Stages Of Pie Chart Data Interpretation Business Plan PowerPoint Templates
We present our eight stages of pie chart data interpretation business plan PowerPoint templates.Download and present our Competition PowerPoint Templates because Our PowerPoint Templates and Slides will embellish your thoughts. See them provide the desired motivation to your team. Download and present our Marketing PowerPoint Templates because You should Press the right buttons with our PowerPoint Templates and Slides. They will take your ideas down the perfect channel. Download our Arrows PowerPoint Templates because Your ideas provide food for thought. Our PowerPoint Templates and Slides will help you create a dish to tickle the most discerning palate. Use our Circle Charts PowerPoint Templates because You can Raise a toast with our PowerPoint Templates and Slides. Spread good cheer amongst your audience. Download and present our Business PowerPoint Templates because Our PowerPoint Templates and Slides will let your ideas bloom. Create a bed of roses for your audience.Use these PowerPoint slides for presentations relating to chart, graph, pie, 3d, diagram, graphic, icon, control, business, data, profit, market, sales, display, corporate, concept, render, success, presentation, finance, report, marketing, accounting, management, piece, strategy, money, growth, company, competition, progress, account, sheet, part, information, investment, improvement, banking, index, financial, reflect, results, performance, exchange. The prominent colors used in the PowerPoint template are Blue, Black, Gray.

Consolidate And University Statement Of Changes In Reserves One Pager Documents
This one pager covers about income and expenditure with revaluation reserves on particular data in total. Further it covers about surplus and deficit income. Presenting you an exemplary Consolidate And University Statement Of Changes In Reserves One Pager Documents. Our one-pager comprises all the must-have essentials of an inclusive document. You can edit it with ease, as its layout is completely editable. With such freedom, you can tweak its design and other elements to your requirements. Download this Consolidate And University Statement Of Changes In Reserves One Pager Documents brilliant piece now.
Funnel Ppt PowerPoint Presentation Backgrounds
This is a funnel ppt powerpoint presentation backgrounds. This is a three stage process. The stages in this process are business, marketing, management, funnel, planning.
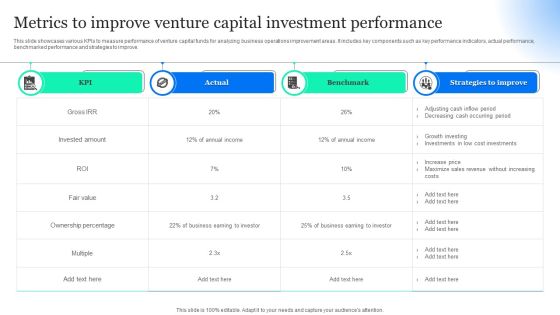
Metrics To Improve Venture Capital Investment Performance Information PDF
This slide showcases various KPIs to measure performance of venture capital funds for analyzing business operations improvement areas. It includes key components such as key performance indicators, actual performance, benchmarked performance and strategies to improve. Pitch your topic with ease and precision using this Metrics To Improve Venture Capital Investment Performance Information PDF. This layout presents information on Actual, Strategies Improve, Benchmark. It is also available for immediate download and adjustment. So, changes can be made in the color, design, graphics or any other component to create a unique layout.
Financial Management And Research Vector Icon Ppt PowerPoint Presentation Styles Outfit PDF
Presenting this set of slides with name financial management and research vector icon ppt powerpoint presentation styles outfit pdf. This is a two stage process. The stages in this process are financial management and research vector icon. This is a completely editable PowerPoint presentation and is available for immediate download. Download now and impress your audience.
Financial Calculations Sumbols And Signs Vector Ilustration Ppt PowerPoint Presentation File Inspiration PDF
Presenting this set of slides with name financial calculations sumbols and signs vector ilustration ppt powerpoint presentation file inspiration pdf. This is a three stage process. The stages in this process are financial calculations sumbols and signs vector ilustration. This is a completely editable PowerPoint presentation and is available for immediate download. Download now and impress your audience.
Vector Of Sales Planning To Ascertain Annual Financial Goals Ppt PowerPoint Presentation Icon Infographics PDF
Presenting this set of slides with name vector of sales planning to ascertain annual financial goals ppt powerpoint presentation icon infographics pdf. This is a three stage process. The stages in this process are vector of sales planning to ascertain annual financial goals. This is a completely editable PowerPoint presentation and is available for immediate download. Download now and impress your audience.

Vector Showing Financial Risk Mitigation Procedure Ppt PowerPoint Presentation Infographic Template Gridlines PDF
Presenting vector showing financial risk mitigation procedure ppt powerpoint presentation infographic template gridlines pdf to dispense important information. This template comprises three stages. It also presents valuable insights into the topics including vector showing financial risk mitigation procedure. This is a completely customizable PowerPoint theme that can be put to use immediately. So, download it and address the topic impactfully.
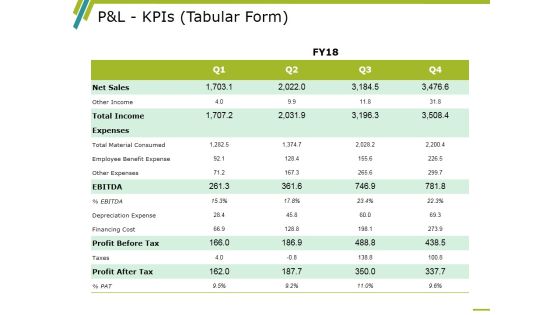
Pandl Kpis Tabular Form Ppt PowerPoint Presentation Icon
This is a pandl kpis tabular form ppt powerpoint presentation icon. This is a four stage process. The stages in this process are business, net sales, total income, expenses, profit before tax, profit after tax.
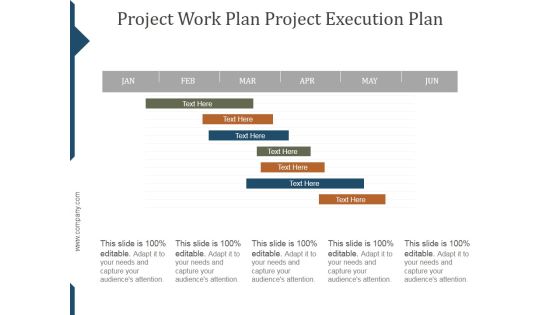
Project Work Plan Project Execution Plan Template Ppt PowerPoint Presentation Styles
This is a project work plan project execution plan template ppt powerpoint presentation styles. This is a seven stage process. The stages in this process are project, management, business, marketing, success.

data collection histograms ppt powerpoint presentation example
This is a data collection histograms ppt powerpoint presentation example. This is a six stage process. The stages in this process are business, planning, marketing, histograms, graph.

Cash Flow Statement Kpis Template 1 Ppt PowerPoint Presentation Gallery Diagrams
This is a cash flow statement kpis template 1 ppt powerpoint presentation gallery diagrams. This is a four stage process. The stages in this process are operations, financing activities, investing activities, net increase in cash.

Business Arrows PowerPoint Templates Business Data Mining Process Ppt Slides
Business Arrows PowerPoint Templates Business data mining process PPT Slides-Use this diagram to show Data Mining Process as a mechanism or group of parts performing one function or serving one purpose in a complex situation-Business Arrows PowerPoint Templates Business data mining process PPT Slides-This template can be used for presentations relating to Analysis, Anomaly, Artificial, Break, Clean, Computer, Cut, Data, Database, Decision, Detection, Discovery, Divide, Explore, Extract, Hammer, Helmet, Human, Index, Intelligence, Kdd, knowledge, Learning, Light, Mallet, Management, Mining, Model, Movement, Pattern, Predictive, Process, Records, Recycle, Repair, Safety, Science
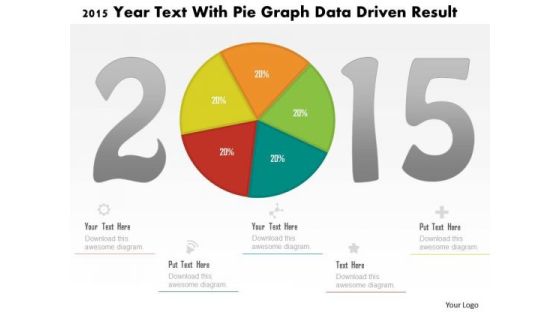
Business Diagram 2015 Year Text With Pie Graph Data Driven Result PowerPoint Slide
This business diagram displays 2015 year numbers with pie chart. This diagram is suitable to display business strategy for year 2015. Download this professional slide to present information in an attractive manner
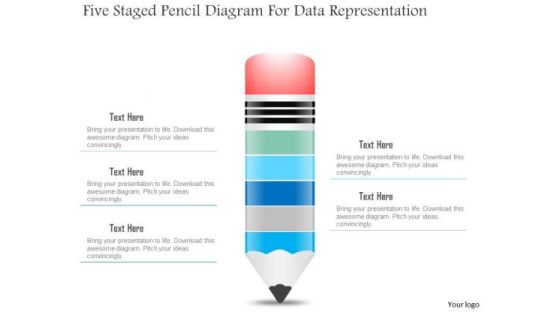
Business Diagram Five Staged Pencil Diagram For Data Representation PowerPoint Slide
This business slide displays five staged pencil diagram. It contains pencil graphic divided into five parts. This diagram slide depicts processes, stages, steps, points, options and education information display. Use this diagram, in your presentations to express your views innovatively.
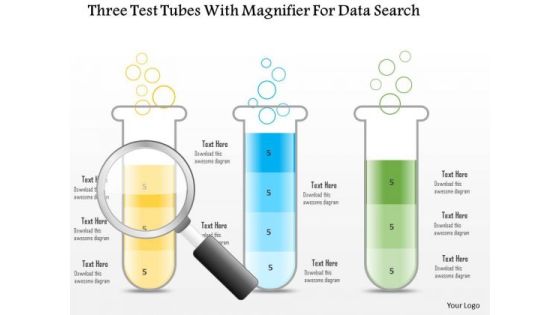
Business Diagram Three Test Tubes With Magnifier For Data Search PowerPoint Slide
This business diagram displays three test tubes with magnifying glass. This diagram is suitable to depict flow of business activities or steps. Download this professional slide to present information in an attractive manner.

Business Diagram Three Trucks For Data Representation For Business PowerPoint Slide
This business diagram displays three trucks graphic. This diagram contains trucks for percentage value growth. Use this diagram to display business growth over a period of time.

Maximizing Profitability Earning Through Sales Initiatives Strategic Action Timeline For Implementing Sales Strategies Formats PDF
This slide shows a Strategic Action Timeline of the company for successfully implementing sales strategy, in order to increase both online and offline sales via Direct Referrals and Facebook Ads, respectively. This slide also provides information on each strategys products, costing, projected sales, proposed deadline, key performance indicators etc. Deliver an awe inspiring pitch with this creative maximizing profitability earning through sales initiatives strategic action timeline for implementing sales strategies formats pdf bundle. Topics like products services, budgeted costs, projected sales, performance indicators can be discussed with this completely editable template. It is available for immediate download depending on the needs and requirements of the user.
P And L Kpis Template 1 Ppt PowerPoint Presentation Infographics Professional
This is a p and l kpis template 1 ppt powerpoint presentation infographics professional. This is a four stage process. The stages in this process are Other Income, Total Income, Ebitda, Profit Before Tax, Profit After Tax.

Financial Data And Analytics Expansion Icon Mockup PDF
Persuade your audience using this Financial Data And Analytics Expansion Icon Mockup PDF. This PPT design covers three stages, thus making it a great tool to use. It also caters to a variety of topics including Financial Data, Analytics, Expansion Icon. Download this PPT design now to present a convincing pitch that not only emphasizes the topic but also showcases your presentation skills.
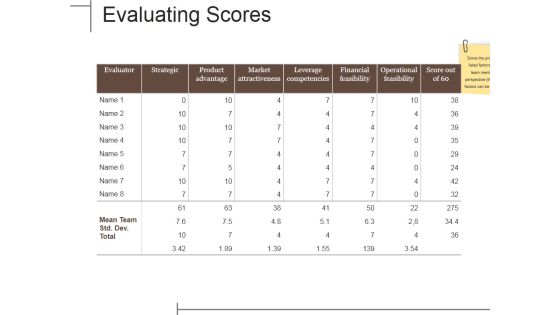
Evaluating Scores Ppt PowerPoint Presentation Infographics Rules
This is a evaluating scores ppt powerpoint presentation infographics rules. This is a seven stage process. The stages in this process are strategic, product advantage, market attractiveness, leverage competencies, financial feasibility, operational feasibility.

Operations Plan Ppt PowerPoint Presentation Model Samples
This is a operations plan ppt powerpoint presentation model samples. This is a three stage process. The stages in this process are sales, marketing, operation, people, financial and admin.

Bar Graph Icon For Data Analysis Ppt PowerPoint Presentation Pictures Ideas
This is a bar graph icon for data analysis ppt powerpoint presentation pictures ideas. This is a four stage process. The stages in this process are financial analysis, quantitative, statistical modelling.
Global Market Intelligence With Competitiveness And Diversification Ppt PowerPoint Presentation Icon Designs Download
Presenting this set of slides with name global market intelligence with competitiveness and diversification ppt powerpoint presentation icon designs download. This is a six stage process. The stages in this process are global competitiveness basics, diversifying sources of income, manageable risk, demanding customers. This is a completely editable PowerPoint presentation and is available for immediate download. Download now and impress your audience.
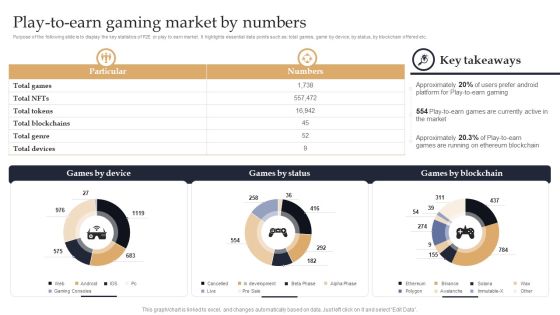
Web 3 0 Blockchain Based P2E Mobile Game Sector Report Promotional Plan Play To Earn Gaming Market By Numbers Summary PDF
Purpose of the following slide is to display the key statistics of P2E or play to earn market. It highlights essential data points such as total games, game by device, by status, by blockchain offered etc. Coming up with a presentation necessitates that the majority of the effort goes into the content and the message you intend to convey. The visuals of a PowerPoint presentation can only be effective if it supplements and supports the story that is being told. Keeping this in mind our experts created Web 3 0 Blockchain Based P2E Mobile Game Sector Report Promotional Plan Play To Earn Gaming Market By Numbers Summary PDF to reduce the time that goes into designing the presentation. This way, you can concentrate on the message while our designers take care of providing you with the right template for the situation.
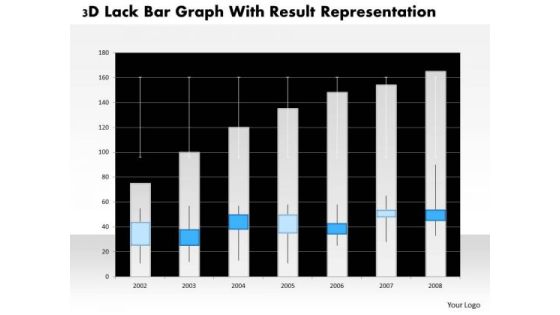
Business Diagram 3d Lack Bar Graph With Result Representation PowerPoint Slide
This business diagram has graphic of 3d lack bar graph. This diagram is a data visualization tool that gives you a simple way to present statistical information. This slide helps your audience examine and interpret the data you present.

Business Diagram Battery Connected With Bulb For Idea Generation PowerPoint Slide
This business slide displays battery icon connected with bulb. This diagram is a data visualization tool that gives you a simple way to present statistical information. This slide helps your audience examine and interpret the data you present.

Business Diagram Human Mind Diagram With Pie Graph For Representation PowerPoint Slide
This diagram displays human face graphic divided into sections. This section can be used for data display. Use this diagram to build professional presentations for your viewers.

Business Diagram Six Staged Pie Charts For Text Representation PowerPoint Slide
This slide displays graphic six staged pie charts. Download this diagram to present and compare business data. Use this diagram to display business process workflows in any presentation.
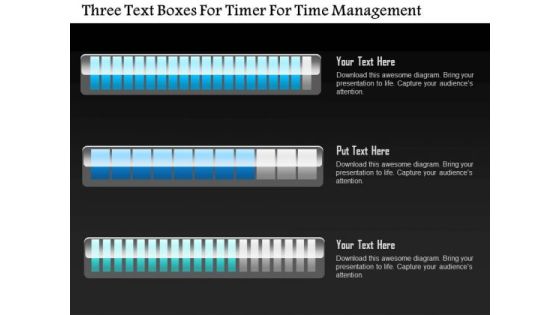
Business Diagram Three Text Boxes For Timer For Time Management PowerPoint Slide
This business diagram displays three text boxes. This diagram contains text boxes for data representation. Use this diagram to display business process workflows in any presentations.
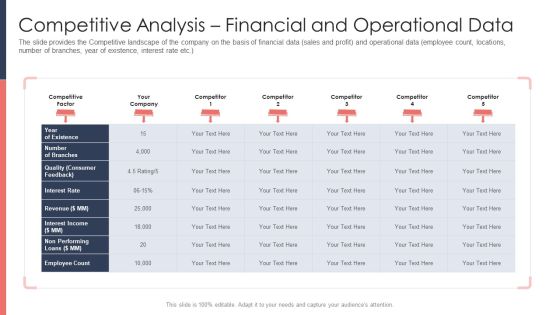
Pitch Deck For Fundraising From Post Market Financing Competitive Analysis Financial And Operational Data Themes PDF
The slide provides the Competitive landscape of the company on the basis of financial data sales and profit and operational data employee count, locations, number of branches, year of existence, interest rate etc.Deliver and pitch your topic in the best possible manner with this pitch deck for fundraising from post market financing competitive analysis financial and operational data themes pdf. Use them to share invaluable insights on quality consumer feedback, interest rate, employee count and impress your audience. This template can be altered and modified as per your expectations. So, grab it now.

Income Assessment Report Interpretation Of Survey Contd Portrait PDF
This slide translates the interpretation of conducting salary survey. It represents the data showing salary raise in previous year, percentage increase in salary, and bonus receive in past year.Deliver and pitch your topic in the best possible manner with this Income Assessment Report Interpretation Of Survey Contd Portrait PDF. Use them to share invaluable insights on Increment Criteria, Projected Increment, Middle Management and impress your audience. This template can be altered and modified as per your expectations. So, grab it now.
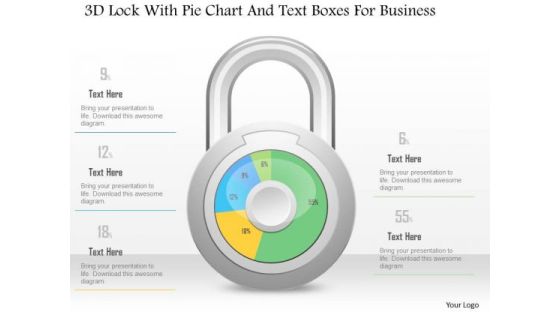
Business Diagram 3d Lock With Pie Chart And Text Boxes For Business PowerPoint Slide
This Power Point diagram has been crafted with pie chart in shape of lock. It contains diagram of lock pie chart to compare and present data in an effective manner. Use this diagram to build professional presentations for your viewers.

Business Diagram 3d Lock With Pie Graph For Result Representation PowerPoint Slide
This Power Point diagram has been crafted with pie chart in shape of lock. It contains diagram of lock pie chart to compare and present data in an effective manner. Use this diagram to build professional presentations for your viewers.

Business Diagram 3d Pencil With Text Boxes For Representation PowerPoint Slide
This Power Point diagram displays graphic of pencil with icons and text spaces. It contains diagram of colorful pencil for data display. Use this diagram to build professional presentations for your viewers.
Business Diagram Human Icons With Bubbles And Different Icons Inside PowerPoint Slide
This diagram displays graph with percentage value growth. This business slide is suitable to present and compare business data. Use this diagram to build professional presentations for your viewers.

Business Diagram Three Staged Pencil Diagram For Graph Formation PowerPoint Slide
This business diagram displays set of pencils. This Power Point template has been designed to compare and present business data. Download this diagram to represent stages of business growth.

Raising Stocks Business PowerPoint Templates And PowerPoint Backgrounds 0811
Microsoft PowerPoint Template and Background with stock market positive trend
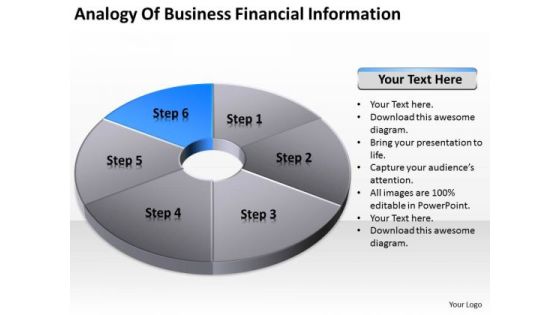
Pie Donut Diagram 6 Stages Ppt Free Downloadable Business Plan Template PowerPoint Templates
We present our pie donut diagram 6 stages ppt free downloadable business plan template PowerPoint templates.Present our Finance PowerPoint Templates because Our PowerPoint Templates and Slides are a sure bet. Gauranteed to win against all odds. Use our Marketing PowerPoint Templates because They will Put the wind in your sails. Skim smoothly over the choppy waters of the market. Present our Money PowerPoint Templates because Our PowerPoint Templates and Slides are conceived by a dedicated team. Use them and give form to your wondrous ideas. Download our Success PowerPoint Templates because Our PowerPoint Templates and Slides are designed to help you succeed. They have all the ingredients you need. Download our Business PowerPoint Templates because It will Give impetus to the hopes of your colleagues. Our PowerPoint Templates and Slides will aid you in winning their trust.Use these PowerPoint slides for presentations relating to Pie, Chart, Market, Statistics, Sales, Slice, Economy, Display, Corporate, Business, Concept, Render, Success, Presentation, Diagram, Percentage, Graphic, Finance, Data, Bank, Report, Marketing, Accounting, Management, Graph, Illustration, Icon, Piece, Strategy, Money, Growth, Company, Control, Competition, Progress, Account, Sheet, Profit, Part, Information, Investment, Improvement, Banking, Index, Financial. The prominent colors used in the PowerPoint template are Blue, Gray, White.
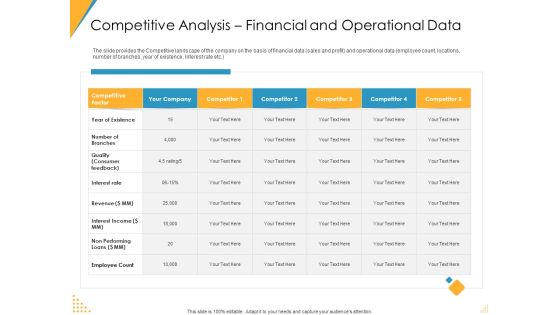
Investor Pitch Deck Post Market Financing Competitive Analysis Financial And Operational Data Demonstration PDF
The slide provides the Competitive landscape of the company on the basis of financial data sales and profit and operational data employee count, locations, number of branches, year of existence, interest rate etc. Deliver an awe-inspiring pitch with this creative investor pitch deck post market financing competitive analysis financial and operational data demonstration pdf bundle. Topics like competitive factor, your company, competitor 1 to competitor 5 can be discussed with this completely editable template. It is available for immediate download depending on the needs and requirements of the user.

Investment Annual Performance Report Pictures PDF
This slide highlights a statistical data showing performance of investment funds for developing financial growth plan. It includes key components such as global equities, aggressive, growth, balanced, moderate, conservative and cash. Pitch your topic with ease and precision using this Investment Annual Performance Report Pictures PDF. This layout presents information on Low Interest Rates, Wage Subsidies, Returns Due Market Drop. It is also available for immediate download and adjustment. So, changes can be made in the color, design, graphics or any other component to create a unique layout.
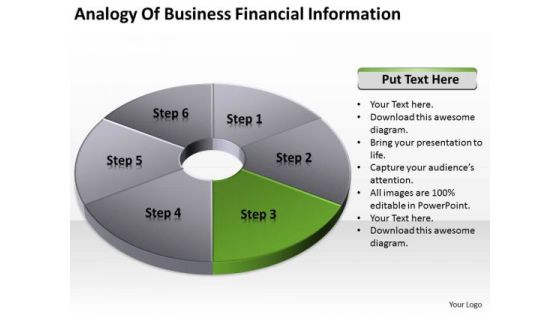
Pie Donut Diagram 6 Stages Professional Business Plan Template PowerPoint Templates
We present our pie donut diagram 6 stages professional business plan template PowerPoint templates.Use our Finance PowerPoint Templates because Our PowerPoint Templates and Slides come in all colours, shades and hues. They help highlight every nuance of your views. Present our Marketing PowerPoint Templates because Our PowerPoint Templates and Slides are effectively colour coded to prioritise your plans They automatically highlight the sequence of events you desire. Download and present our Money PowerPoint Templates because It can be used to Set your controls for the heart of the sun. Our PowerPoint Templates and Slides will be the propellant to get you there. Download and present our Success PowerPoint Templates because Our PowerPoint Templates and Slides will let your words and thoughts hit bullseye everytime. Download and present our Business PowerPoint Templates because Our PowerPoint Templates and Slides are conceived by a dedicated team. Use them and give form to your wondrous ideas.Use these PowerPoint slides for presentations relating to Pie, Chart, Market, Statistics, Sales, Slice, Economy, Display, Corporate, Business, Concept, Render, Success, Presentation, Diagram, Percentage, Graphic, Finance, Data, Bank, Report, Marketing, Accounting, Management, Graph, Illustration, Icon, Piece, Strategy, Money, Growth, Company, Control, Competition, Progress, Account, Sheet, Profit, Part, Information, Investment, Improvement, Banking, Index, Financial. The prominent colors used in the PowerPoint template are Green, Gray, White.

Maximizing Profitability Earning Through Sales Initiatives Table Of Contents Ppt Visual Aids Outline PDF
Deliver an awe inspiring pitch with this creative maximizing profitability earning through sales initiatives table of contents ppt visual aids outline pdf bundle. Topics like strategy implementation, market segmentation analysis, sales key performance indicators, types of sales strategies with details and related costs, business overview can be discussed with this completely editable template. It is available for immediate download depending on the needs and requirements of the user.

Stock Photo Golden Dollar Symbol With Pie Graph PowerPoint Slide
This Power Point template has been crafted with graphic of golden dollar symbol and pie chart on a tablet. Display the concept of financial data analysis with this image. Use this image to present financial reports in business presentations.

Key Performance Indicators Template 2 Ppt PowerPoint Presentation Model Example
This is a key performance indicators template 2 ppt powerpoint presentation model example. This is a four stage process. The stages in this process are objective, measures, targets, invites, indicators.
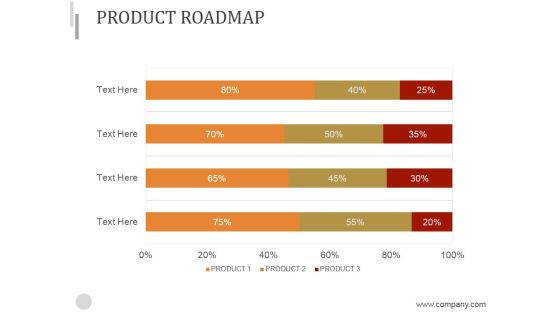
Product Roadmap Ppt PowerPoint Presentation Inspiration
This is a product roadmap ppt powerpoint presentation inspiration. This is a four stage process. The stages in this process are roadmap, finance, strategy, success, management.

Financial Key Performance Indicators Ppt PowerPoint Presentation Ideas Aids Cpb
This is a financial key performance indicators ppt powerpoint presentation ideas aids cpb. This is a four stage process. The stages in this process are financial key performance indicators.
Business Diagram Battery Icon With Power Icons Energy Technology PowerPoint Slide
This business diagram displays battery icon with power charging. Use this diagram, in your presentations to display energy saving, battery and technology. Create professional presentations using this diagram slide.
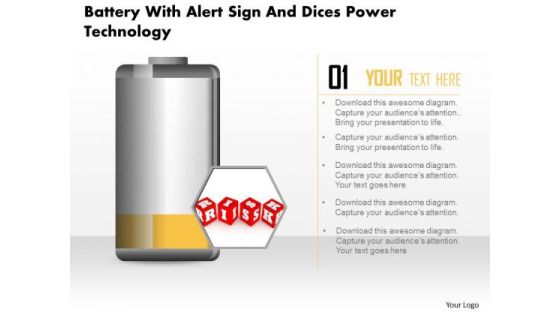
Business Diagram Battery With Alert Sign And Dices Power Technology PowerPoint Slide
This business diagram displays risk alert on battery icon. Use this diagram, in your presentations to display energy saving, battery and technology. Create professional presentations using this diagram slide.
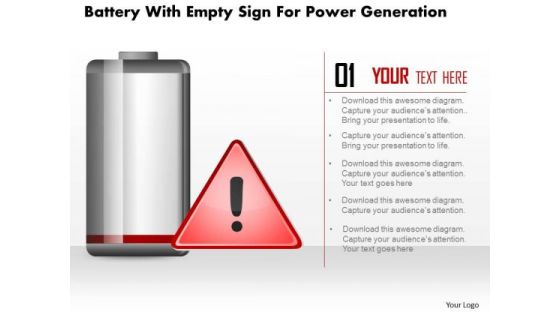
Business Diagram Battery With Empty Sign For Power Generation PowerPoint Slide
This business diagram displays empty sign alert on battery icon. Use this diagram, in your presentations to display energy saving, battery and technology. Create professional presentations using this diagram slide.

Business Diagram Five Staged Timeline Diagram For Business PowerPoint Slide
This PowerPoint template displays five points timeline diagram. This business diagram has been designed with graphic of timeline with five points, text space and start, end points. Use this diagram, in your presentations to display process steps, stages, timelines and business management. Make wonderful presentations using this business slide.
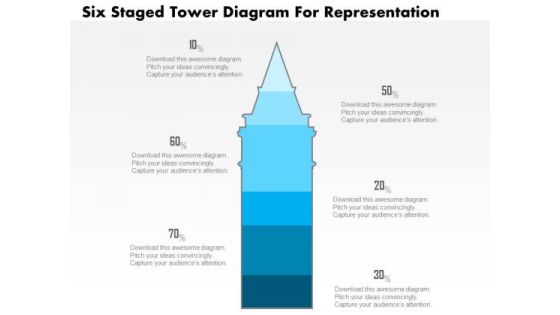
Business Diagram Five Staged Tower Diagram For Representation PowerPoint Slide
This business slide displays five staged tower diagram. It contains blue tower graphic divided into five parts. This diagram slide depicts processes, stages, steps, points, options information display. Use this diagram, in your presentations to express your views innovatively.
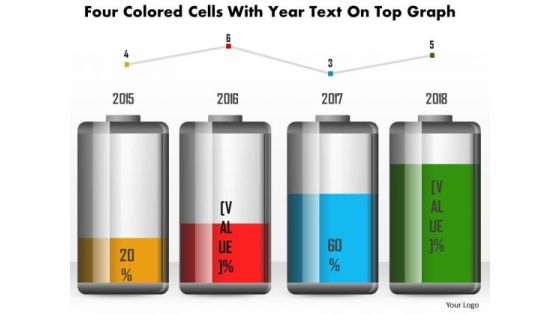
Business Diagram Four Colored Cells With Year Text On Top Graph PowerPoint Slide
This business diagram has been designed with battery cell graphic for business timeline. This slide can be used for business planning and management. Use this diagram for your business and success milestones related presentations.
Business Diagram Green Battery Cell With Full Charging Symbol PowerPoint Slide
This business diagram displays full battery charge icon. Use this diagram, in your presentations to display energy saving, battery and technology. Create professional presentations using this diagram slide.

Business Diagram Four Steps With 3d Business Person Standing Over It PowerPoint Slide
This business diagram displays bar graph with business person standing on it. This Power Point template has been designed to display personal growth. You may use this diagram to impart professional appearance to your presentations.
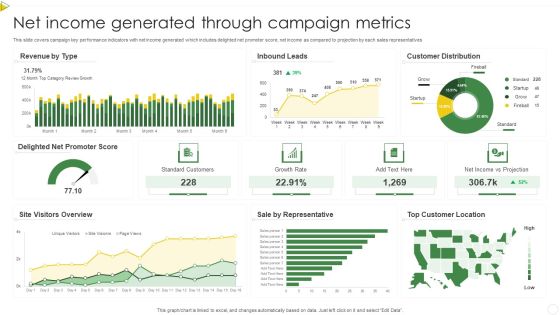
Net Income Generated Through Campaign Metrics Summary PDF
This slide covers campaign key performance indicators with net income generated which includes delighted net promoter score, net income as compared to projection by each sales representatives. Pitch your topic with ease and precision using this Net Income Generated Through Campaign Metrics Summary PDF. This layout presents information on Standard Customers, Growth Rate, Net Income. It is also available for immediate download and adjustment. So, changes can be made in the color, design, graphics or any other component to create a unique layout.

AI And ML Driving Monetary Value For Organization Customer Data Processing Workflow Guidelines PDF
This slide illustrates customer data processing workflow. It cover three stages namely detection, prediction and generation. This is a ai and ml driving monetary value for organization customer data processing workflow guidelines pdf template with various stages. Focus and dispense information on three stages using this creative set, that comes with editable features. It contains large content boxes to add your information on topics like tangible benefits, intangible benefits. You can also showcase facts, figures, and other relevant content using this PPT layout. Grab it now.

Investor Report Finance PowerPoint Templates And PowerPoint Backgrounds 0711
Microsoft PowerPoint Template and Background with stock market charts for investor analysis
Financial Key Performance Indicators Table Powerpoint Slide Deck
This is a financial key performance indicators table powerpoint slide deck. This is a six stage process. The stages in this process are business, strategy, marketing, success, table.

Person Checking Money Market Trends On Laptop Ppt PowerPoint Presentation Gallery Clipart PDF
Presenting person checking money market trends on laptop ppt powerpoint presentation gallery clipart pdf to dispense important information. This template comprises one stage. It also presents valuable insights into the topics including person checking money market trends on laptop. This is a completely customizable PowerPoint theme that can be put to use immediately. So, download it and address the topic impactfully.
Subordinated Loan Funding Competitive Analysis By Operational And Financial Data Ppt Icon Infographic Template PDF
The slide provides the Competitive landscape of the company on the basis of financial data sales and profit and operational data employee count, locations, year of existence etc.Deliver an awe inspiring pitch with this creative subordinated loan funding competitive analysis by operational and financial data ppt icon infographic template pdf. bundle. Topics like competitive factor, locations major, product service, quality consumer, feedback. can be discussed with this completely editable template. It is available for immediate download depending on the needs and requirements of the user.

Data Driven Analytics Chart Powerpoint Presentation Templates
This is a data driven analytics chart powerpoint presentation templates. This is a five stage process. The stages in this process are category.

Eight Stages Of Pie Chart Data Interpretation Business Plan PowerPoint Slides
We present our eight stages of pie chart data interpretation business plan PowerPoint Slides.Use our Competition PowerPoint Templates because Our PowerPoint Templates and Slides will let you Clearly mark the path for others to follow. Download and present our Marketing PowerPoint Templates because Our PowerPoint Templates and Slides will weave a web of your great ideas. They are gauranteed to attract even the most critical of your colleagues. Present our Arrows PowerPoint Templates because Our PowerPoint Templates and Slides will let you Hit the target. Go the full distance with ease and elan. Use our Circle Charts PowerPoint Templates because You have gained great respect for your brilliant ideas. Use our PowerPoint Templates and Slides to strengthen and enhance your reputation. Download our Business PowerPoint Templates because You are an avid believer in ethical practices. Highlight the benefits that accrue with our PowerPoint Templates and Slides.Use these PowerPoint slides for presentations relating to chart, graph, pie, 3d, diagram, graphic, icon, control, business, data, profit, market, sales, display, corporate, concept, render, success, presentation, finance, report, marketing, accounting, management, piece, strategy, money, growth, company, competition, progress, account, sheet, part, information, investment, improvement, banking, index, financial, reflect, results, performance, exchange. The prominent colors used in the PowerPoint template are Blue, Black, Gray.

Nursing Administration Financial Performance Key Trends Ppt Infographics Themes PDF
Deliver an awe inspiring pitch with this creative nursing administration financial performance key trends ppt infographics themes pdf bundle. Topics like data analytics, avoid overbuilding, cybersecurity investment, value based payments, updating the financial leadership model can be discussed with this completely editable template. It is available for immediate download depending on the needs and requirements of the user.

Stock Photo Bar Graph With Cubes For Financial Data PowerPoint Slide
Graphic of bar graph and cubes are used to decorate this image template. This PPT contains the concept of financial data analysis. Use this PPT for finance and business related presentations.
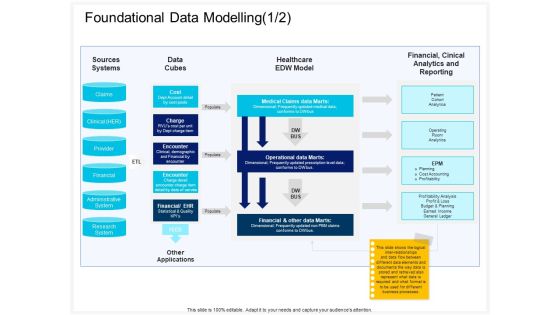
Enterprise Problem Solving And Intellect Foundational Data Modelling Applications Ppt PowerPoint Presentation Inspiration Example Introduction PDF
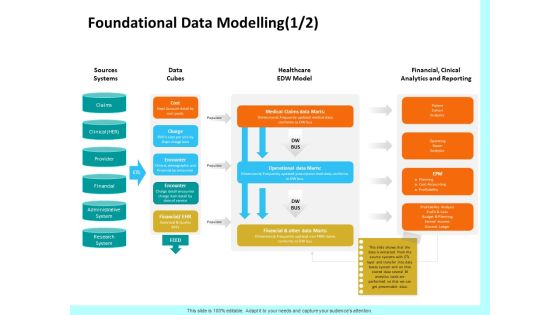
Presenting this set of slides with name enterprise problem solving and intellect foundational data modelling applications ppt powerpoint presentation inspiration example introduction pdf. This is a one stage process. The stages in this process are sources systems, data cubes, healthcare, edw model, financial, cinical analytics and reporting, cost, charge, encounter. This is a completely editable PowerPoint presentation and is available for immediate download. Download now and impress your audience.
Firm Productivity Administration Foundational Data Modelling Sources Ppt PowerPoint Presentation Inspiration Designs Download PDF
Presenting this set of slides with name firm productivity administration foundational data modelling sources ppt powerpoint presentation inspiration designs download pdf. This is a one stage process. The stages in this process are sources systems, data cubes, healthcare, edw model, financial, cinical analytics and reporting, cost, charge, encounter. This is a completely editable PowerPoint presentation and is available for immediate download. Download now and impress your audience.
Real Estate Marketing Strategy Vendors Target Seller Client Persona Microsoft PDF
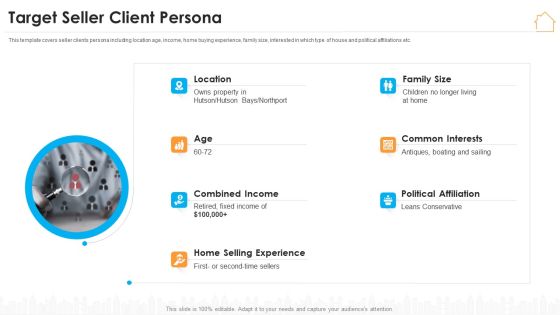
This template covers seller clients persona including location age, income, home buying experience, family size, interested in which type of house and political affiliations etc. This is a real estate marketing strategy vendors target seller client persona microsoft pdf template with various stages. Focus and dispense information on seven stages using this creative set, that comes with editable features. It contains large content boxes to add your information on topics like location, political affiliation, selling experience. You can also showcase facts, figures, and other relevant content using this PPT layout. Grab it now.

Data Collection Histograms Ppt PowerPoint Presentation Design Templates
This is a data collection histograms ppt powerpoint presentation design templates. This is a five stage process. The stages in this process are histogram, business, marketing, analysis, chart.

Competitive Analysis Financial And Operational Data Portrait PDF
The slide provides the Competitive landscape of the company on the basis of financial data sales and profit and operational data employee count, locations, number of branches, year of existence, interest rate etc.Deliver an awe inspiring pitch with this creative competitive analysis financial and operational data portrait pdf bundle. Topics like competitive analysis financial and operational data can be discussed with this completely editable template. It is available for immediate download depending on the needs and requirements of the user.

Rings Forming Structured Data 7 Stages Step By Business Plan Template PowerPoint Slides
We present our rings forming structured data 7 stages step by business plan template PowerPoint Slides.Use our Circle Charts PowerPoint Templates because They will Put your wonderful verbal artistry on display. Our PowerPoint Templates and Slides will provide you the necessary glam and glitter. Present our Shapes PowerPoint Templates because It will Give impetus to the hopes of your colleagues. Our PowerPoint Templates and Slides will aid you in winning their trust. Download and present our Signs PowerPoint Templates because Our PowerPoint Templates and Slides will let you Clearly mark the path for others to follow. Download and present our Maketing PowerPoint Templates because It will mark the footprints of your journey. Illustrate how they will lead you to your desired destination. Use our Metaphors-Visual Concepts PowerPoint Templates because Our PowerPoint Templates and Slides has conjured up a web of all you need with the help of our great team. Use them to string together your glistening ideas.Use these PowerPoint slides for presentations relating to diagram, circular, market, bar, advertise, interface, business, concept, vector, sign, success, presentation, symbol, template, circle, brochure, finance, data, description, report, marketing, title, label, abstract, management, graph, four, illustration, icon, pie, chart, strategy, catalog, research, web, design, growth, text, professional, banner, account, profit, information, background, info-graphic, analyze, financial, button, goals. The prominent colors used in the PowerPoint template are Blue, Blue light, White.

Human Capital Data Analytics Ppt PowerPoint Presentation File Model Cpb
Presenting this set of slides with name human capital data analytics ppt powerpoint presentation file model cpb. This is an editable Powerpoint four stages graphic that deals with topics like human capital data analytics to help convey your message better graphically. This product is a premium product available for immediate download and is 100 percent editable in Powerpoint. Download this now and use it in your presentations to impress your audience.

9 Correlated Blocks Of Structured Data Download Business Plans PowerPoint Templates
We present our 9 correlated blocks of structured data download business plans PowerPoint templates.Download our Marketing PowerPoint Templates because Our PowerPoint Templates and Slides are conceived by a dedicated team. Use them and give form to your wondrous ideas. Download our Business PowerPoint Templates because It can Bubble and burst with your ideas. Present our Finance PowerPoint Templates because Our PowerPoint Templates and Slides will let you Hit the right notes. Watch your audience start singing to your tune. Present our Process and Flows PowerPoint Templates because Our PowerPoint Templates and Slides will give good value for money. They also have respect for the value of your time. Download our Arrows PowerPoint Templates because It will let you Set new benchmarks with our PowerPoint Templates and Slides. They will keep your prospects well above par.Use these PowerPoint slides for presentations relating to Diagram, Chart, Business, Background, Vector, Pie, Brown, Abstract, Wheel, Options, Board, Website, Cross, Statistics, Model, Item, Document, Media, Beehives, Red, Hive, Concept, Presentation, Template, Matt, Brochure, Orange, Guide, Description, Multicolor, Marketing, Gray, Development, Title, Management, Honeycomb, Illustration, Six, Catalog, Direction, Plans, Blue, Text, Reports, Financial, Workplace, Navigation, Parts. The prominent colors used in the PowerPoint template are Blue, Gray, Black.

Financial PAR Key Performance Indicators Summary Ppt Summary Graphics PDF
Deliver an awe inspiring pitch with this creative financial par key performance indicators summary ppt summary graphics pdf bundle. Topics like procurement, strategic, goals, target, procurement can be discussed with this completely editable template. It is available for immediate download depending on the needs and requirements of the user.
Insurance Organization Pitch Deck To Raise Money Current Market Trends And Future Outlook Mockup PDF
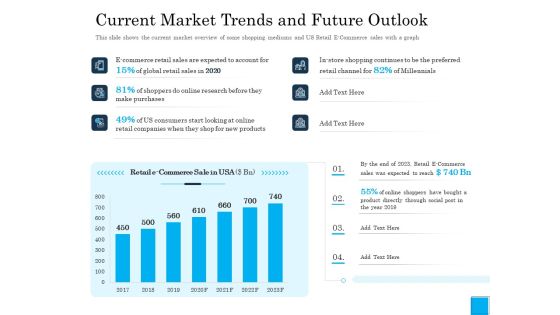
Deliver and pitch your topic in the best possible manner with this insurance organization pitch deck to raise money current market trends and future outlook mockup pdf. Use them to share invaluable insights on social, e commerce, sales, global, consumers and impress your audience. This template can be altered and modified as per your expectations. So, grab it now.
The Solution Ppt PowerPoint Presentation Portfolio Background
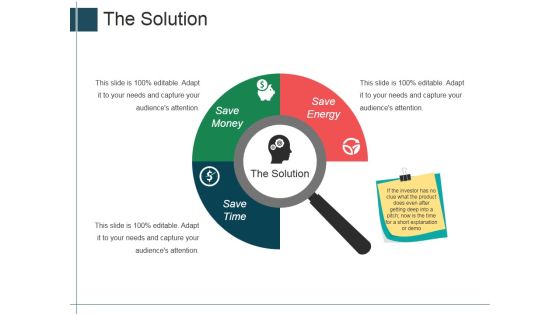
This is a the solution ppt powerpoint presentation portfolio background. This is a three stage process. The stages in this process are save time, save money, save energy, the solution.
Process Of Annual Report Analysis With Information And Output Source Brochure PDF
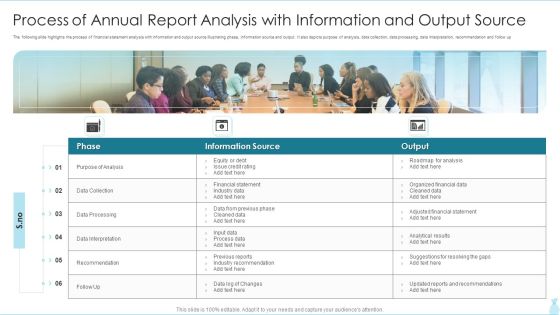
The following slide highlights the process of financial statement analysis with information and output source illustrating phase, information source and output. It also depicts purpose of analysis, data collection, data processing, data interpretation, recommendation and follow up.Presenting Process Of Annual Report Analysis With Information And Output Source Brochure PDF to dispense important information. This template comprises six stages. It also presents valuable insights into the topics including Information Source, Financial Statement, Industry Data This is a completely customizable PowerPoint theme that can be put to use immediately. So, download it and address the topic impactfully.
Ppt Consecutive Demonstration Of Arrow Process Using Stage 1 PowerPoint Templates
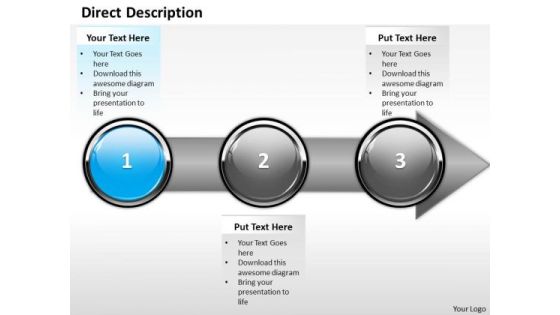
PPT consecutive demonstration of arrow process using stage 1 PowerPoint Templates-With this pre-designed process arrows diagram you can visualize almost any type of concept, chronological process or steps of your strategies.-PPT consecutive demonstration of arrow process using stage 1 PowerPoint Templates-Arrow, Bank, Benefit, Business, Calculate, Calculation, Capitalist, Communication, Company, Concern, Connection, Data, Diagram, Digital, Drawing, Earnings, Economic, Finance, Financial, Flow, Forecast, Gain, Goal, Graph, Growth, Illustration, Increase, Information, Interest, Investing, Management, Market, Money, Move, Network, Objective, Plan, Process, Profit, Progress, Report, Rise, Risk, Shares, Statistics, Stock, System, Technology
Ppt Consecutive Description Of Banking Process Using 3 State Diagram PowerPoint Templates
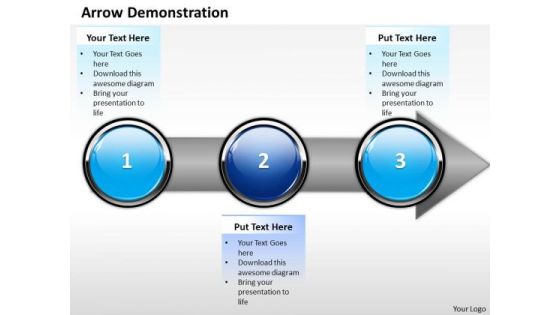
PPT consecutive description of banking process using 3 state diagram PowerPoint Templates-With this pre-designed process arrows diagram you can visualize almost any type of concept, chronological process or steps of your strategies.-PPT consecutive description of banking process using 3 state diagram PowerPoint Templates-Arrow, Bank, Benefit, Business, Calculate, Calculation, Capitalist, Communication, Company, Concern, Connection, Data, Diagram, Digital, Drawing, Earnings, Economic, Finance, Financial, Flow, Forecast, Gain, Goal, Graph, Growth, Illustration, Increase, Information, Interest, Investing, Management, Market, Money, Move, Network, Objective, Plan, Process, Profit, Progress, Report, Rise, Risk, Shares, Statistics, Stock, System, Technology

Ppt Direct Description Of Arrow Process Using Stage 3 PowerPoint Templates
PPT direct description of arrow process using stage 3 PowerPoint Templates-With this pre-designed process arrows diagram you can visualize almost any type of concept, chronological process or steps of your strategies.-PPT direct description of arrow process using stage 3 PowerPoint Templates-Arrow, Bank, Benefit, Business, Calculate, Calculation, Capitalist, Communication, Company, Concern, Connection, Data, Diagram, Digital, Drawing, Earnings, Economic, Finance, Financial, Flow, Forecast, Gain, Goal, Graph, Growth, Illustration, Increase, Information, Interest, Investing, Management, Market, Money, Move, Network, Objective, Plan, Process, Profit, Progress, Report, Rise, Risk, Shares, Statistics, Stock, System, Technology

Ppt Direct Illustration Of Banking Process Using Stage 2 PowerPoint Templates
PPT direct illustration of banking process using stage 2 PowerPoint Templates-With this pre-designed process arrows diagram you can visualize almost any type of concept, chronological process or steps of your strategies.-PPT direct illustration of banking process using stage 2 PowerPoint Templates-Arrow, Bank, Benefit, Business, Calculate, Calculation, Capitalist, Communication, Company, Concern, Connection, Data, Diagram, Digital, Drawing, Earnings, Economic, Finance, Financial, Flow, Forecast, Gain, Goal, Graph, Growth, Illustration, Increase, Information, Interest, Investing, Management, Market, Money, Move, Network, Objective, Plan, Process, Profit, Progress, Report, Rise, Risk, Shares, Statistics, Stock, System, Technology

Evaluating Performance Earned Value EV Ppt Infographics Styles PDF
Deliver and pitch your topic in the best possible manner with this evaluating performance earned value EV ppt infographics styles pdf. Use them to share invaluable insights on PV planned value, EV earned value, AC actual cost and impress your audience. This template can be altered and modified as per your expectations. So, grab it now.

Clustered Bar Ppt PowerPoint Presentation Good
This is a clustered bar ppt powerpoint presentation good. This is a five stage process. The stages in this process are product, circular, business, marketing, bar graph.

Formulating Money Laundering Enhancing Identification Process Through Customer Pictures PDF
This slide showcases improving transaction monitoring process through customer segmentation. It provides information about algorithm , membership, transaction patterns and activities, customer data, fraud, compliance, false positives, data analysis, etc. If your project calls for a presentation, then Slidegeeks is your go-to partner because we have professionally designed, easy-to-edit templates that are perfect for any presentation. After downloading, you can easily edit Formulating Money Laundering Enhancing Identification Process Through Customer Pictures PDF and make the changes accordingly. You can rearrange slides or fill them with different images. Check out all the handy templates.

Economic Capital And Solvency Compliance And Reporting Diagram Presentation Background Images
This is a economic capital and solvency compliance and reporting diagram presentation background images. This is a six stage process. The stages in this process are confidence level, standard report templates, expected loss, algo financial modeler, standard formula model, economic capital.
Business Data Analysis Chart Shows Changes Over The Time PowerPoint Templates
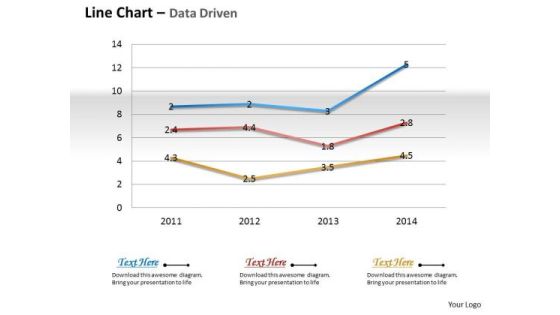
Document The Process On Our business data analysis chart shows changes over the time Powerpoint Templates. Make A Record Of Every Detail.

