AI PPT Maker
Templates
PPT Bundles
Design Services
Business PPTs
Business Plan
Management
Strategy
Introduction PPT
Roadmap
Self Introduction
Timelines
Process
Marketing
Agenda
Technology
Medical
Startup Business Plan
Cyber Security
Dashboards
SWOT
Proposals
Education
Pitch Deck
Digital Marketing
KPIs
Project Management
Product Management
Artificial Intelligence
Target Market
Communication
Supply Chain
Google Slides
Research Services
 One Pagers
All Categories
-
Home
- Customer Favorites
- Revenue Dashboard
Revenue Dashboard

Raising Venture Capital Ppt PowerPoint Presentation Slides Show Cpb
Presenting this set of slides with name raising venture capital ppt powerpoint presentation slides show cpb. This is an editable Powerpoint five stages graphic that deals with topics like raising venture capital to help convey your message better graphically. This product is a premium product available for immediate download and is 100 percent editable in Powerpoint. Download this now and use it in your presentations to impress your audience.

Data Collection Tools And Techniques With Financial Reports Ppt PowerPoint Presentation Icon Example File PDF
Persuade your audience using this data collection tools and techniques with financial reports ppt powerpoint presentation icon example file pdf. This PPT design covers two stages, thus making it a great tool to use. It also caters to a variety of topics including government report, sales reports, financial reports. Download this PPT design now to present a convincing pitch that not only emphasizes the topic but also showcases your presentation skills.

Predictive Data Model Predictive Analytics In Finding Better Customer Leads Sample PDF
This slide represents how predictive analytics can help the marketing industry find better customer leads and can be used in ad targeting, suggestive copywriting, lead prospecting, and targeted sales conversations. Slidegeeks has constructed Predictive Data Model Predictive Analytics In Finding Better Customer Leads Sample PDF after conducting extensive research and examination. These presentation templates are constantly being generated and modified based on user preferences and critiques from editors. Here, you will find the most attractive templates for a range of purposes while taking into account ratings and remarks from users regarding the content. This is an excellent jumping-off point to explore our content and will give new users an insight into our top-notch PowerPoint Templates.
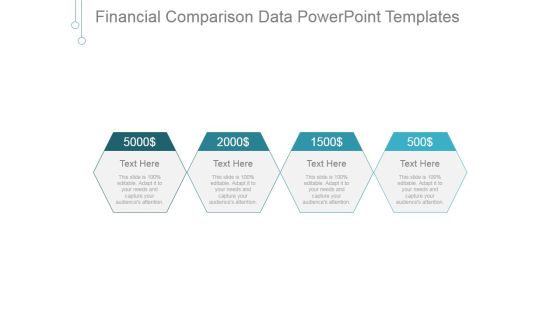
Financial Comparison Data Ppt PowerPoint Presentation Gallery
This is a financial comparison data ppt powerpoint presentation gallery. This is a four stage process. The stages in this process are business, marketing, management, dollar, finance.

Startup Presentation For Collaborative Capital Funding Magnifying Glass Introduction PDF
Presenting this set of slides with name startup presentation for collaborative capital funding magnifying glass introduction pdf. This is a two stage process. The stages in this process are magnifying glass. This is a completely editable PowerPoint presentation and is available for immediate download. Download now and impress your audience.

Adjusting Financial Strategies And Planning Measuring Business Earnings With Profitability Ratios Download PDF
This slide provides glimpse about profitability ratio analysis for calculating our firms business earnings and net profit margin. It includes quarterly gross profit margin, quarterly net profit margin, key insights, etc. The Adjusting Financial Strategies And Planning Measuring Business Earnings With Profitability Ratios Download PDF is a compilation of the most recent design trends as a series of slides. It is suitable for any subject or industry presentation, containing attractive visuals and photo spots for businesses to clearly express their messages. This template contains a variety of slides for the user to input data, such as structures to contrast two elements, bullet points, and slides for written information. Slidegeeks is prepared to create an impression.
Icon Showing Market Research Of Financial Information Template PDF
Persuade your audience using this Icon Showing Market Research Of Financial Information Template PDF This PPT design covers three stages, thus making it a great tool to use. It also caters to a variety of topics including Icon Showing, Market Research, Financial Information Download this PPT design now to present a convincing pitch that not only emphasizes the topic but also showcases your presentation skills.

Money Growth Chart On Laptop With Mouse Powerpoint Template
This business slide displays money growth chart on laptop with mouse. This diagram is a data visualization tool that gives you a simple way to present statistical information. This slide helps your audience examine and interpret the data you present.
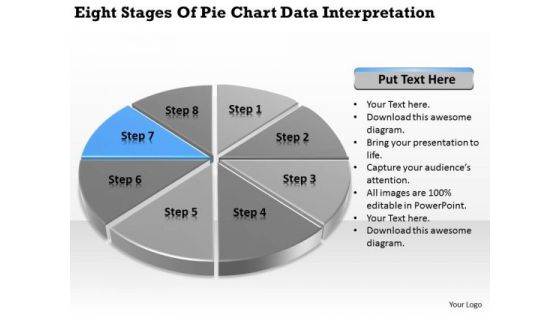
Stages Of Pie Chart Data Interpretation Business Plan Template PowerPoint Templates
We present our stages of pie chart data interpretation business plan template PowerPoint templates.Download and present our Circle Charts PowerPoint Templates because You can Stir your ideas in the cauldron of our PowerPoint Templates and Slides. Cast a magic spell on your audience. Download our Marketing PowerPoint Templates because Our PowerPoint Templates and Slides will let you Hit the target. Go the full distance with ease and elan. Use our Business PowerPoint Templates because Our PowerPoint Templates and Slides are truly out of this world. Even the MIB duo has been keeping tabs on our team. Download our Shapes PowerPoint Templates because Watching this your Audience will Grab their eyeballs, they wont even blink. Download our Process and Flows PowerPoint Templates because It will Give impetus to the hopes of your colleagues. Our PowerPoint Templates and Slides will aid you in winning their trust.Use these PowerPoint slides for presentations relating to achievement, analysis, background, bank, banking, business, calculation, chart, circle, commerce, commercial, commission, concept, credit, crisis, debt, deposit, design, detail, diagram, earnings, economics, economy, element, finance, goal, gold, golden, graph, graphic, growth, icon, idea, illustration, income, increase, invest, isolated, level, loss, market, marketing, metal, modern, money, new, object, part, percent, percentage, pie, plot, politics, profit, progress, ratio, reflection, reflective. The prominent colors used in the PowerPoint template are Blue, Gray, Black.

Budget Report Ppt PowerPoint Presentation Topics
This is a budget report ppt powerpoint presentation topics. This is a five stage process. The stages in this process are project, incurred, future scheduled, budget, remaining.

7 Stages Data Flow Process Diagram Business Plan PowerPoint Templates
We present our 7 stages data flow process diagram business plan PowerPoint templates.Download and present our Circle Charts PowerPoint Templates because Our PowerPoint Templates and Slides ensures Effective communication. They help you put across your views with precision and clarity. Download our Shapes PowerPoint Templates because Our PowerPoint Templates and Slides will let your team Walk through your plans. See their energy levels rise as you show them the way. Present our Signs PowerPoint Templates because Our PowerPoint Templates and Slides are Clear and concise. Use them and dispel any doubts your team may have. Present our Maketing PowerPoint Templates because Our PowerPoint Templates and Slides are aesthetically designed to attract attention. We gaurantee that they will grab all the eyeballs you need. Download and present our Metaphors-Visual Concepts PowerPoint Templates because Our PowerPoint Templates and Slides offer you the needful to organise your thoughts. Use them to list out your views in a logical sequence.Use these PowerPoint slides for presentations relating to diagram, circular, market, bar, advertise, interface, business, concept, vector, sign, success, presentation, symbol, template, circle, brochure, finance, data, description, report, marketing, title, label, abstract, management, graph, four, illustration, icon, pie, chart, strategy, catalog, research, web, design, growth, text, professional, banner, account, profit, information, background, info-graphic, analyze, financial, button, goals. The prominent colors used in the PowerPoint template are Blue, Blue light, White.

Economic Capital And Solvency Compliance And Reporting Diagram Ppt Slides
This is a economic capital and solvency compliance and reporting diagram ppt slides. This is a seven stage process. The stages in this process are expected loss, solvency reports, standard report templates, economic capital, confidence level, standard formula model, standard formula inputs.

Financial Initiatives Plan For Non Profit Organisations Infographics PDF
This slide presents financial action plan for non-profit organisations, helpful in managing their finances and maximizing return on activities. It includes creating budget based on past data, considering overhead expenses and making informed decision. Presenting Financial Initiatives Plan For Non Profit Organisations Infographics PDF to dispense important information. This template comprises four stages. It also presents valuable insights into the topics including Financial Action Plan, Make Informed Decisions, Create Organized System. This is a completely customizable PowerPoint theme that can be put to use immediately. So, download it and address the topic impactfully.

Big Data Analytics Tools And Techniques Ppt PowerPoint Presentation Infographic Template Good
Presenting this set of slides with name big data analytics tools and techniques ppt powerpoint presentation infographic template good. This is a one stage process. The stages in this process are big data analysis, data management, technologies segmentation. This is a completely editable PowerPoint presentation and is available for immediate download. Download now and impress your audience.
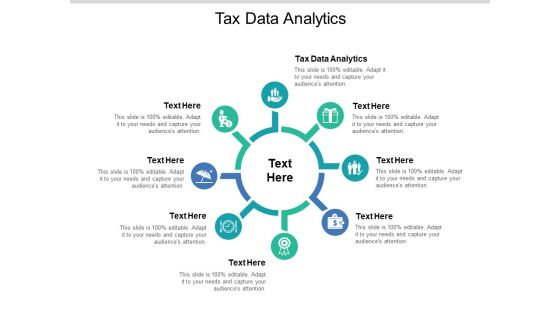
Tax Data Analytics Ppt PowerPoint Presentation Ideas Topics Cpb Pdf
Presenting this set of slides with name tax data analytics ppt powerpoint presentation ideas topics cpb pdf. This is an editable Powerpoint eight stages graphic that deals with topics like tax data analytics to help convey your message better graphically. This product is a premium product available for immediate download and is 100 percent editable in Powerpoint. Download this now and use it in your presentations to impress your audience.
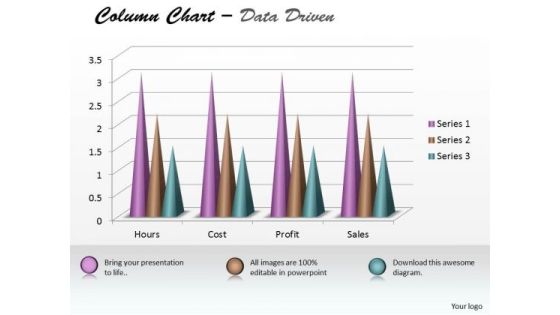
Excel Data Analysis Data Tools Data Methods Statistical Tool Survey Chart PowerPoint Templates
Analyze Ailments On Our excel data analysis data tools data methods statistical tool survey chart Powerpoint Templates . Bring Out The Thinking Doctor In You. Dock Your Thoughts With Our Excel Data Analysis . They Will Launch Them Into Orbit.
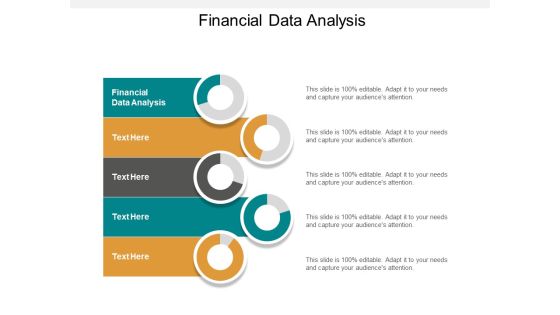
financial data analysis ppt powerpoint presentation infographics tips cpb
Presenting this set of slides with name financial data analysis ppt powerpoint presentation infographics tips cpb. This is a five stage process. The stages in this process are financial data analysis. This is a completely editable PowerPoint presentation and is available for immediate download. Download now and impress your audience.
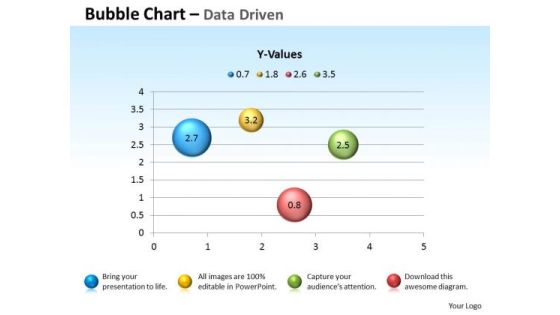
Excel Data Analysis Data Tools Data Methods Statistical Chart For Process PowerPoint Templates
Blend Your Views With Our excel data analysis data tools data methods statistical chart for process Powerpoint Templates . They Are Made For Each Other.

Excel Data Analysis Data Tools Data Methods Statistical Driven PowerPoint Slides Templates
There Is No Subject Too Dull For Our excel data analysis data tools data methods statistical driven powerpoint slides Templates . They Will Always Generate Keenness.
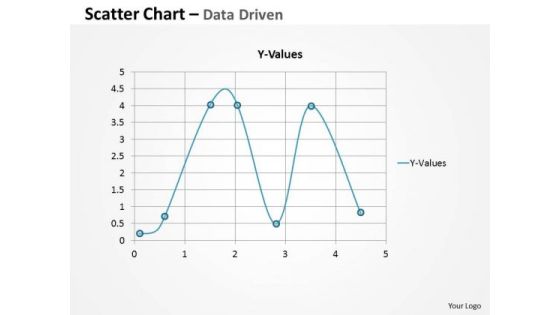
Excel Data Analysis Data Tools Data Methods Statistical Survey Driven PowerPoint Slides Templates
Ask For Assistance From Our excel data analysis data tools data methods statistical survey driven powerpoint slides Templates . You Will Be Duly Satisfied.
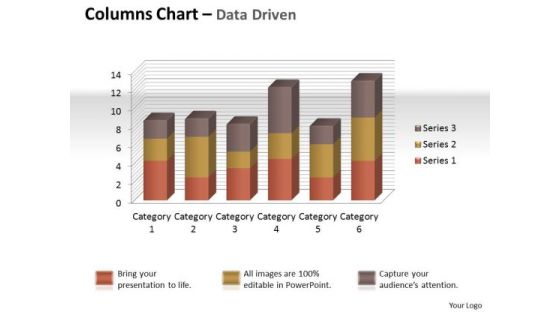
Excel Data Analysis Data Tools Data Methods Statistical Tool Chart PowerPoint Templates
Give Your Thoughts Some Durability. Coat Them With Our excel data analysis data tools data methods statistical tool chart Powerpoint Templates .
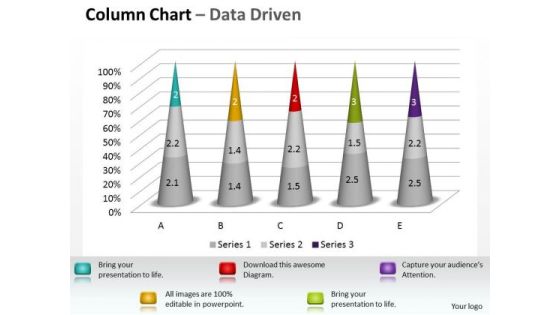
Excel Data Analysis Data Tools Data Methods Statistical Tool Survey 3d Chart PowerPoint Templates
Dumbfound Them With Our excel data analysis data tools data methods statistical tool survey 3d chart Powerpoint Templates . Your Audience Will Be Astounded With Your Ideas.

Excel Data Analysis Data Tools Data Methods Statistical Tool Survey PowerPoint Slides Templates
Get Out Of The Dock With Our excel data analysis data tools data methods statistical tool survey powerpoint slides Templates . Your Mind Will Be Set Free.

Bar Graph Icon For Research Analysis Ppt PowerPoint Presentation Summary Portfolio
Presenting this set of slides with name bar graph icon for research analysis ppt powerpoint presentation summary portfolio. This is a three stage process. The stages in this process are data visualization icon, research analysis, business focus. This is a completely editable PowerPoint presentation and is available for immediate download. Download now and impress your audience.

Data Collection And Analysis Control Chart Ppt PowerPoint Presentation Visuals
This is a data collection and analysis control chart ppt powerpoint presentation visuals. This is a ten stage process. The stages in this process are upper limit, centerline, lower limit, plotted points.
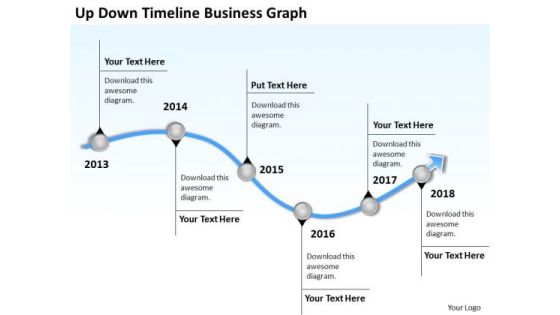
Business Analysis Diagrams PowerPoint Presentations Graph Templates
We present our business analysis diagrams powerpoint presentations graph templates.Download and present our Curves and Lines PowerPoint Templates because Your audience will believe you are the cats whiskers. Present our Business PowerPoint Templates because Our PowerPoint Templates and Slides will effectively help you save your valuable time. They are readymade to fit into any presentation structure. Present our Business PowerPoint Templates because Our PowerPoint Templates and Slides will give good value for money. They also have respect for the value of your time. Use our Arrows PowerPoint Templates because It will get your audience in sync. Present our Process and Flows PowerPoint Templates because It can Conjure up grand ideas with our magical PowerPoint Templates and Slides. Leave everyone awestruck by the end of your presentation.Use these PowerPoint slides for presentations relating to 3d, account, accounting, annual, balance, business, chart, commerce, crisis, data,earnings, economics, economy, exchange, figures, finance, financial, graph,graphic, growth, illustration, index, information, investment, list, line,management,market, marketing, money, monitoring, numbers, office, paperwork, plan, price,printout, report, research, sale, statistical, statistics, stock, success, tax, trade,work. The prominent colors used in the PowerPoint template are Blue light, Gray, White.
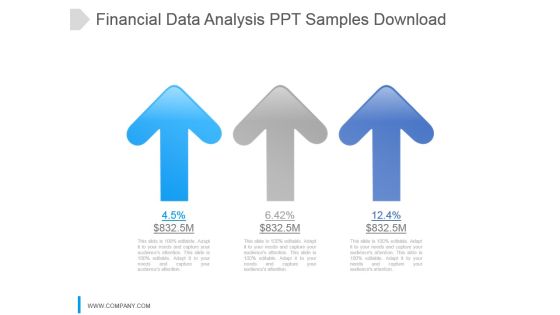
Financial Data Analysis Ppt Samples Download
This is a financial data analysis ppt samples download. This is a three stage process. The stages in this process are arrow, growth, percentage, finance, success.

Financial Analysis Growth Rate Diagram Powerpoint Layout
This is a financial analysis growth rate diagram powerpoint layout. This is a three stage process. The stages in this process are data analysis, result analysis, growth.

Concept Of Locked Money Finance PowerPoint Templates And PowerPoint Themes 1012
Concept Of Locked Money Finance PowerPoint Templates And PowerPoint Themes 1012-Develop competitive advantage with our above template which contains a diagram of 3d money and lock. This image signifies the concept of data security. This image has been conceived to enable you to emphatically communicate your ideas in your Business and Financial PPT presentations on finance, protection and banking. Our PPT images are so perfectly designed that it reveals the very basis of our PPT template to make your clients understand.-Concept Of Locked Money Finance PowerPoint Templates And PowerPoint Themes 1012-This PowerPoint template can be used for presentations relating to-Money and lock, security, success, money, finance, business
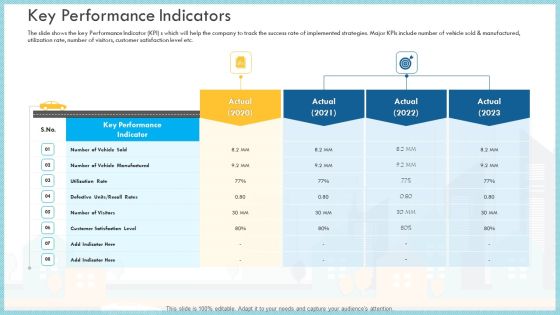
Loss Of Income And Financials Decline In An Automobile Organization Case Study Key Performance Indicators Brochure PDF
The slide shows the key Performance Indicator KPI s which will help the company to track the success rate of implemented strategies. Major KPIs include number of vehicle sold and manufactured, utilization rate, number of visitors, customer satisfaction level etc.Deliver an awe inspiring pitch with this creative loss of income and financials decline in an automobile organization case study key performance indicators brochure pdf bundle. Topics like key performance indicator, utilization rate, customer satisfaction level can be discussed with this completely editable template. It is available for immediate download depending on the needs and requirements of the user

Customer Centric Business Model Ppt Presentation
This is a customer centric business model ppt presentation. This is a four stage process. The stages in this process are success, arrows, business.
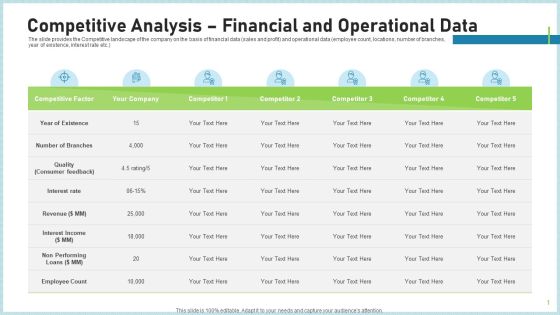
Pitch Deck To Attract Funding After IPO Market Competitive Analysis Financial And Operational Data Inspiration PDF
The slide provides the Competitive landscape of the company on the basis of financial data sales and profit and operational data employee count, locations, number of branches, year of existence, interest rate etc.Deliver and pitch your topic in the best possible manner with this pitch deck to attract funding after ipo market competitive analysis financial and operational data inspiration pdf . Use them to share invaluable insights on quality consumer feedback, interest income, employee count and impress your audience. This template can be altered and modified as per your expectations. So, grab it now.

Stages Of Pie Chart Data Interpretation How To Write Business Plan PowerPoint Templates
We present our stages of pie chart data interpretation how to write business plan PowerPoint templates.Present our Circle Charts PowerPoint Templates because Our PowerPoint Templates and Slides will provide you a launch platform. Give a lift off to your ideas and send them into orbit. Present our Marketing PowerPoint Templates because Our PowerPoint Templates and Slides will let you Hit the right notes. Watch your audience start singing to your tune. Use our Business PowerPoint Templates because Our PowerPoint Templates and Slides come in all colours, shades and hues. They help highlight every nuance of your views. Download our Shapes PowerPoint Templates because It can Leverage your style with our PowerPoint Templates and Slides. Charm your audience with your ability. Use our Process and Flows PowerPoint Templates because You can Connect the dots. Fan expectations as the whole picture emerges.Use these PowerPoint slides for presentations relating to achievement, analysis, background, bank, banking, business, calculation, chart, circle, commerce, commercial, commission, concept, credit, crisis, debt, deposit, design, detail, diagram, earnings, economics, economy, element, finance, goal, gold, golden, graph, graphic, growth, icon, idea, illustration, income, increase, invest, isolated, level, loss, market, marketing, metal, modern, money, new, object, part, percent, percentage, pie, plot, politics, profit, progress, ratio, reflection, reflective. The prominent colors used in the PowerPoint template are Blue, Gray, Black.
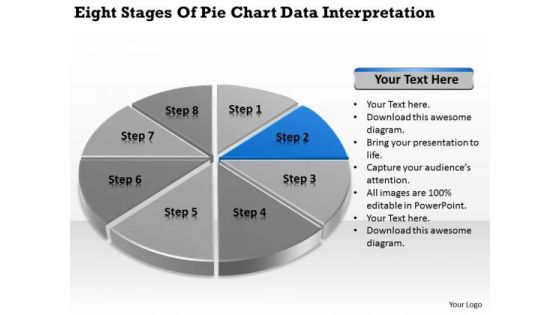
Stages Of Pie Chart Data Interpretation Vending Machine Business Plan PowerPoint Slides
We present our stages of pie chart data interpretation vending machine business plan PowerPoint Slides.Present our Circle Charts PowerPoint Templates because You should Bet on your luck with our PowerPoint Templates and Slides. Be assured that you will hit the jackpot. Present our Marketing PowerPoint Templates because Our PowerPoint Templates and Slides will provide you the cutting edge. Slice through the doubts in the minds of your listeners. Download our Business PowerPoint Templates because you should Experience excellence with our PowerPoint Templates and Slides. They will take your breath away. Download our Shapes PowerPoint Templates because It will Raise the bar of your Thoughts. They are programmed to take you to the next level. Present our Process and Flows PowerPoint Templates because Our PowerPoint Templates and Slides will give good value for money. They also have respect for the value of your time.Use these PowerPoint slides for presentations relating to achievement, analysis, background, bank, banking, business, calculation, chart, circle, commerce, commercial, commission, concept, credit, crisis, debt, deposit, design, detail, diagram, earnings, economics, economy, element, finance, goal, gold, golden, graph, graphic, growth, icon, idea, illustration, income, increase, invest, isolated, level, loss, market, marketing, metal, modern, money, new, object, part, percent, percentage, pie, plot, politics, profit, progress, ratio, reflection, reflective. The prominent colors used in the PowerPoint template are Blue, Gray, Black.
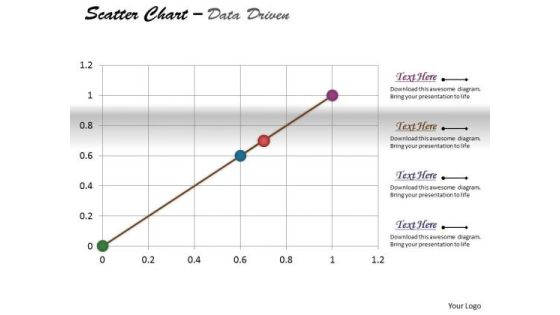
Excel Data Analysis Data Methods Statistical Tool Survey Driven PowerPoint Slides Templates
Be The Duke Of The Dais With Our excel data analysis data methods statistical tool survey driven powerpoint slides Templates . Acquire Royalty Status With Your Thoughts.

Year Based Company Financial Highlights Ppt Images
This is a year based company financial highlights ppt images. This is a two stage process. The stages in this process are turnover, gross dividend per share, shareholders funds, paid up share capital.
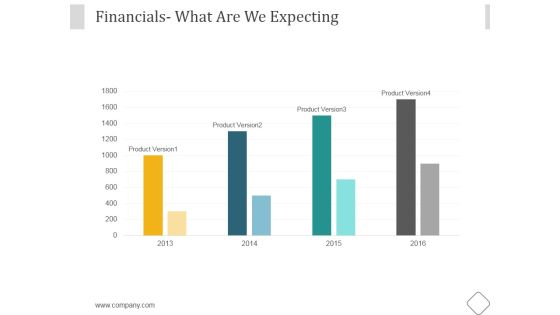
Financials Ppt PowerPoint Presentation Samples
This is a financials ppt powerpoint presentation samples. This is a four stage process. The stages in this process are business, marketing, management, financial, expecting.

Business Checklist For Financial Budget Allocation Within Departments Summary PDF
This slide represents the financial budget allocation checklist to evaluate department. It includes various question related to the strategies that are either implemented in an organisation for growth. Deliver an awe inspiring pitch with this creative Business Checklist For Financial Budget Allocation Within Departments Summary PDF bundle. Topics like Document Financial, Data Budget, Spreadsheet Develop can be discussed with this completely editable template. It is available for immediate download depending on the needs and requirements of the user.
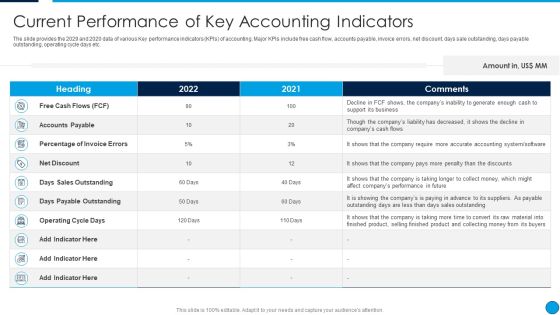
Summary Financial Current Performance Of Key Accounting Indicators Template PDF
The slide provides the 2029 and 2020 data of various Key performance indicators KPIs of accounting. Major KPIs include free cash flow, accounts payable, invoice errors, net discount, days sale outstanding, days payable outstanding, operating cycle days etc. Deliver an awe inspiring pitch with this creative Summary Financial Current Performance Of Key Accounting Indicators Template PDF bundle. Topics like Free Cash Flows, Accounts Payable, Percentage Of Invoice Errors, Net Discount can be discussed with this completely editable template. It is available for immediate download depending on the needs and requirements of the user.
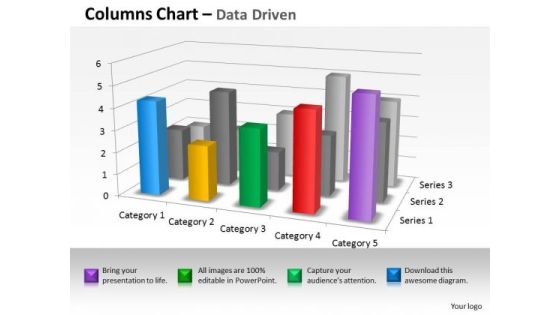
Quantitative Data Analysis 3d Interpretation Of Statistical Quality Control PowerPoint Templates
Land The Idea With Our quantitative data analysis 3d interpretation of statistical quality control Powerpoint Templates . Help It Grow With Your Thoughts.

Best Practices To Create Marketing Document Portrait PDF
This slide outlines tips to develop marketing reports aimed at keeping marketing activities accountable to create value for company in competitive markets. It covers five practices schedule reports, gather feedback, create templates, use valuable data, data visualization. Presenting Best Practices To Create Marketing Document Portrait PDF to dispense important information. This template comprises five stages. It also presents valuable insights into the topics including Schedule Reports, Create Templates, Data Visualization. This is a completely customizable PowerPoint theme that can be put to use immediately. So, download it and address the topic impactfully.

Pie Charts For Financial Ratio Analysis Powerpoint Slides
This PowerPoint template has been designed with diagram of pie charts. This PPT slide can be used to prepare presentations for profit growth report and also for financial data analysis. You can download finance PowerPoint template to prepare awesome presentations.
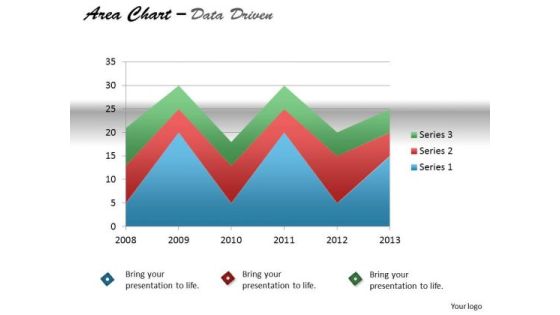
Quantitative Data Analysis Driven Display Series With Area Chart PowerPoint Slides Templates
Our quantitative data analysis driven display series with area chart powerpoint slides Templates Enjoy Drama. They Provide Entertaining Backdrops.
Icon For Yearly Business Financials Evaluation Introduction PDF
Presenting Icon For Yearly Business Financials Evaluation Introduction PDF to dispense important information. This template comprises Three stages. It also presents valuable insights into the topics including Icon For Yearly Business, Financials Evaluation. This is a completely customizable PowerPoint theme that can be put to use immediately. So, download it and address the topic impactfully.
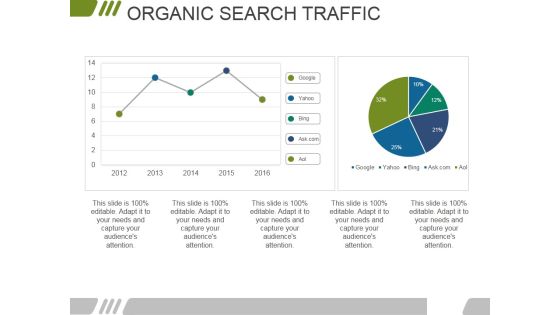
Organic Search Traffic Ppt PowerPoint Presentation Model Slideshow
This is a organic search traffic ppt powerpoint presentation model slideshow. This is a two stage process. The stages in this process are business, marketing, finance, management, organic.

Hang On Trend Business PowerPoint Templates And PowerPoint Backgrounds 0611
Microsoft PowerPoint Template and Background with hanging on market arrow

Data Representation Vector Icon Ppt PowerPoint Presentation Infographic Template Samples
Presenting this set of slides with name data representation vector icon ppt powerpoint presentation infographic template samples. This is a one stage process. The stages in this process are data visualization icon, research analysis, business focus. This is a completely editable PowerPoint presentation and is available for immediate download. Download now and impress your audience.
Vulnerability Management Process Business Accounting Venture Capital Availability Ppt PowerPoint Presentation Icon Graphics
This is a vulnerability management process business accounting venture capital availability ppt powerpoint presentation icon graphics. This is a two stage process. The stages in this process are vulnerability management process, business accounting, venture capital availability.
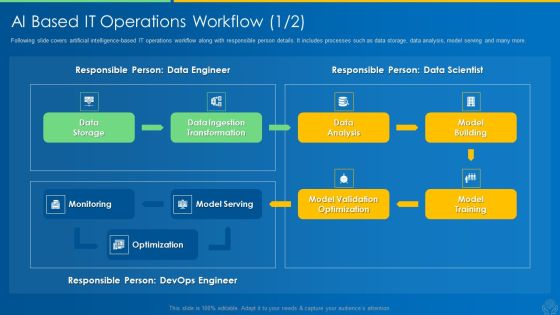
AI And ML Driving Monetary Value For Organization AI Based IT Operations Workflow Data Topics PDF
Following slide covers artificial intelligence-based IT operations workflow along with responsible person details. It includes processes such as data storage, data analysis, model serving and many more. Deliver an awe inspiring pitch with this creative ai and ml driving monetary value for organization ai based it operations workflow data topics pdf bundle. Topics like data storage, data ingestion transformation, data analysis, model building, model training can be discussed with this completely editable template. It is available for immediate download depending on the needs and requirements of the user.
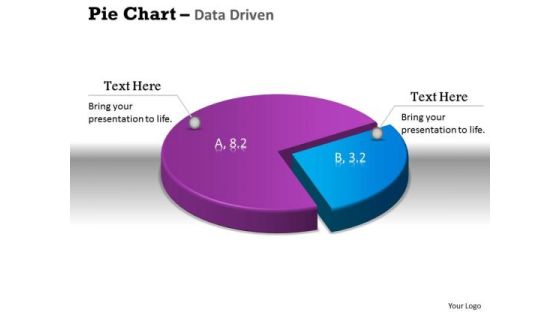
Data Analysis Excel 3d Pie Chart Shows Relative Size Of PowerPoint Templates
Get The Doers Into Action. Activate Them With Our data analysis excel 3d pie chart shows relative size of Powerpoint Templates.

Data Analysis Excel Driven Percentage Breakdown Pie Chart PowerPoint Slides Templates
Be A Donor Of Great Ideas. Display Your Charity On Our data analysis excel driven percentage breakdown pie chart powerpoint slides Templates.

Data Analysis Excel Driven Pie Chart For Business Stratregy PowerPoint Slides Templates
Open Up Doors That Lead To Success. Our data analysis excel driven pie chart for business stratregy powerpoint slides Templates Provide The Handles.
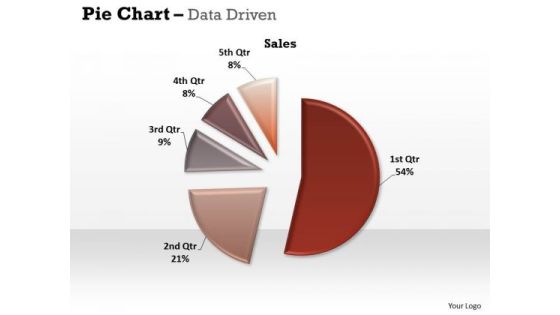
Data Analysis Excel Driven Pie Chart For Easy Comparison PowerPoint Slides Templates
Our data analysis excel driven pie chart for easy comparison powerpoint slides Templates Abhor Doodling. They Never Let The Interest Flag.
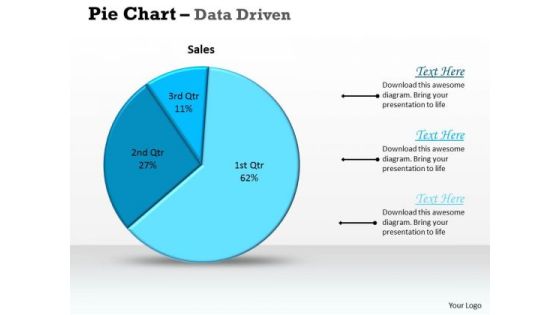
Data Analysis Excel Driven Pie Chart For Sales Process PowerPoint Slides Templates
Deliver The Right Dose With Our data analysis excel driven pie chart for sales process powerpoint slides Templates . Your Ideas Will Get The Correct Illumination.
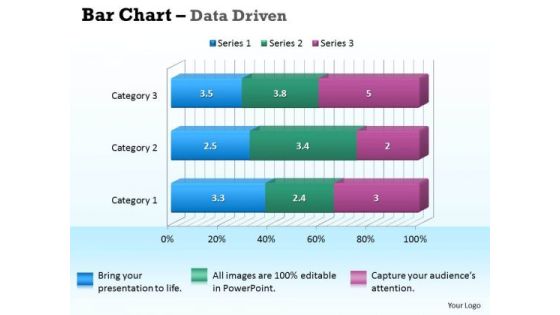
Data Analysis In Excel 3d Bar Chart For Business Information PowerPoint Templates
Our data analysis in excel 3d bar chart for business information Powerpoint Templates Deliver At Your Doorstep. Let Them In For A Wonderful Experience.
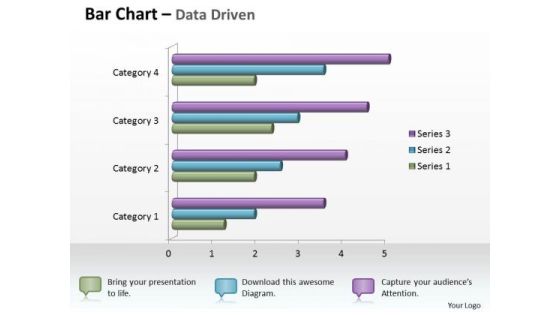
Data Analysis In Excel 3d Bar Chart For Business Statistics PowerPoint Templates
Knock On The Door To Success With Our data analysis in excel 3d bar chart for business statistics Powerpoint Templates . Be Assured Of Gaining Entry.

Data Analysis In Excel 3d Bar Chart For Business Trends PowerPoint Templates
Connect The Dots With Our data analysis in excel 3d bar chart for business trends Powerpoint Templates . Watch The Whole Picture Clearly Emerge.

Data Analysis In Excel 3d Bar Chart For Comparison Of Time Series PowerPoint Templates
Double Your Chances With Our data analysis in excel 3d bar chart for comparison of time series Powerpoint Templates . The Value Of Your Thoughts Will Increase Two-Fold.
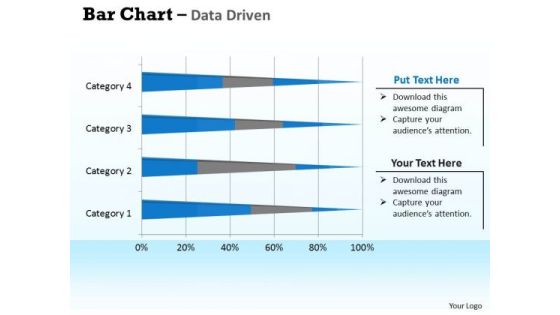
Data Analysis In Excel 3d Bar Chart For Interpretation PowerPoint Templates
Double Up Our data analysis in excel 3d bar chart for interpretation Powerpoint Templates With Your Thoughts. They Will Make An Awesome Pair.

Data Analysis In Excel 3d Column Chart For Sets Of Information PowerPoint Templates
Double The Impact With Our data analysis in excel 3d column chart for sets of information Powerpoint Templates . Your Thoughts Will Have An Imposing Effect.
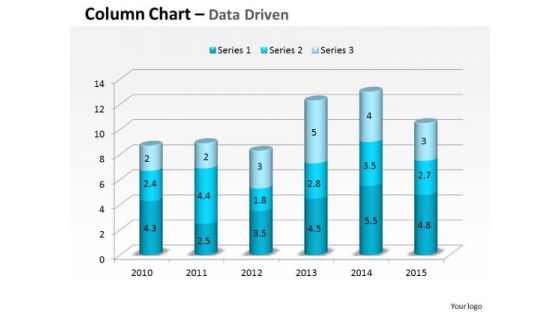
Data Analysis In Excel 3d Compare Yearly Business Performance PowerPoint Templates
Plan For All Contingencies With Our data analysis in excel 3d compare yearly business performance Powerpoint Templates . Douse The Fire Before It Catches.
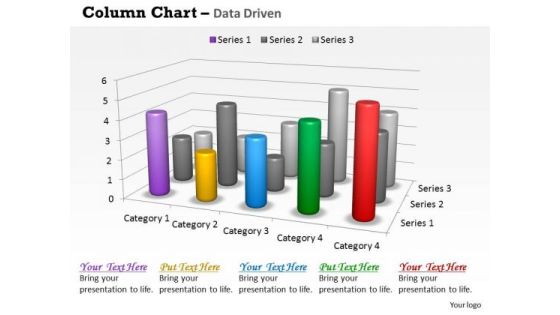
Data Analysis In Excel 3d Survey For Sales Chart PowerPoint Templates
Good Camaraderie Is A Key To Teamwork. Our data analysis in excel 3d survey for sales chart Powerpoint Templates Can Be A Cementing Force.
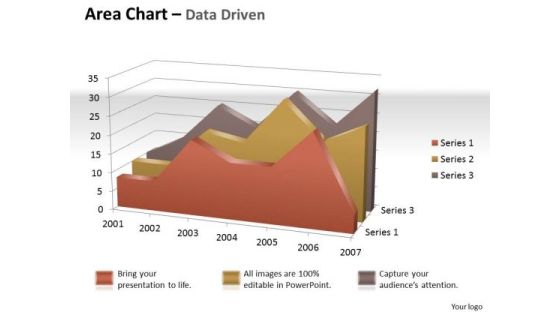
Data Analysis In Excel 3d Visual Display Of Area Chart PowerPoint Templates
Brace Yourself, Arm Your Thoughts. Prepare For The Hustle With Our data analysis in excel 3d visual display of area chart Powerpoint Templates .

Data Analysis In Excel Column Chart For Business Project PowerPoint Templates
Edit Your Work With Our data analysis in excel column chart for business project Powerpoint Templates . They Will Help You Give The Final Form.

Data Analysis In Excel Column Chart Of Various Fields PowerPoint Templates
Land The Idea With Our data analysis in excel column chart of various fields Powerpoint Templates . Help It Grow With Your Thoughts.
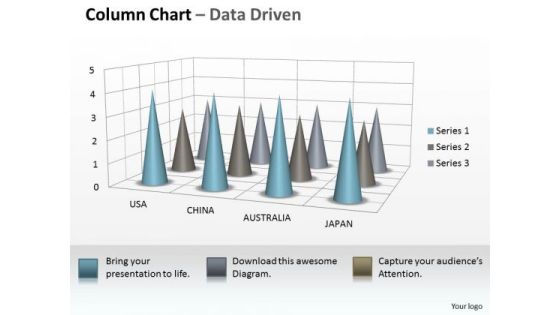
Data Analysis On Excel 3d Chart To Incorporate Business Information PowerPoint Templates
Our data analysis on excel 3d chart to incorporate business information Powerpoint Templates Allow You To Do It With Ease. Just Like Picking The Low Hanging Fruit.

Data Analysis On Excel 3d Chart To Monitor Business Process PowerPoint Templates
Make Some Dough With Our data analysis on excel 3d chart to monitor business process Powerpoint Templates . Your Assets Will Rise Significantly.
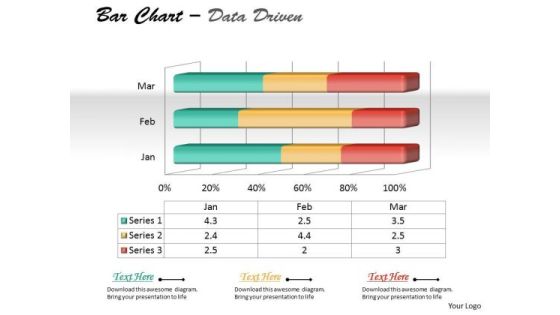
Data Analysis On Excel 3d Chart To Represent Quantitative Differences PowerPoint Templates
Draft It Out On Our data analysis on excel 3d chart to represent quantitative differences Powerpoint Templates . Give The Final Touches With Your Ideas.

Data Analysis On Excel 3d Chart With Sets Of PowerPoint Templates
Reduce The Drag With Our data analysis on excel 3d chart with sets of Powerpoint Templates . Give More Lift To Your Thoughts.
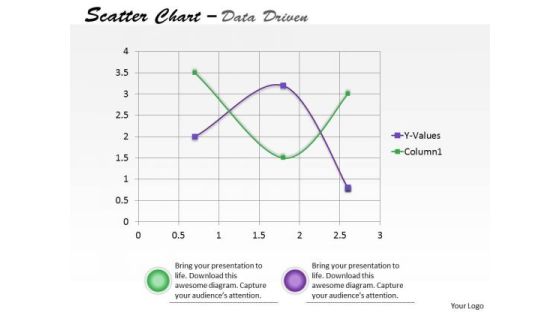
Data Analysis On Excel Driven Scatter Chart To Predict Future Movements PowerPoint Slides Templates
Our data analysis on excel driven scatter chart to predict future movements powerpoint slides Templates Enjoy Drama. They Provide Entertaining Backdrops.

Data Analysis On Excel Driven Sets Of Business Information PowerPoint Slides Templates
Break The Deadlock With Our data analysis on excel driven sets of business information powerpoint slides Templates . Let The Words Start To Flow.

Data Analysis On Excel Driven Stacked Area Chart PowerPoint Slides Templates
Be The Dramatist With Our data analysis on excel driven stacked area chart powerpoint slides Templates . Script Out The Play Of Words.

Data Analysis On Excel Driven Stock Chart For Business Growth PowerPoint Slides Templates
Add Some Dramatization To Your Thoughts. Our data analysis on excel driven stock chart for business growth powerpoint slides Templates Make Useful Props.
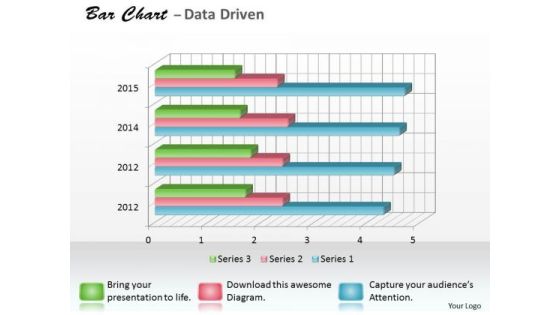
Data Analysis Programs 3d Bar Chart For Research In Statistics PowerPoint Templates
Draw It Out On Our data analysis programs 3d bar chart for research in statistics Powerpoint Templates . Provide Inspiration To Your Colleagues.
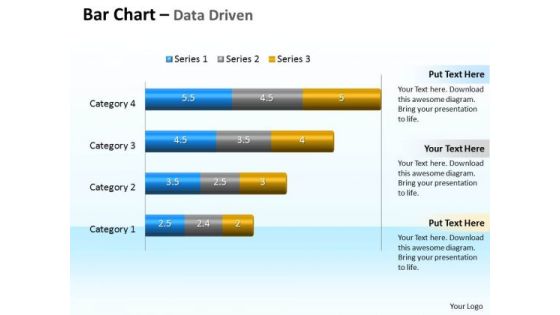
Data Analysis Programs 3d Bar Chart To Compare Categories PowerPoint Templates
Discover Decisive Moments With Our data analysis programs 3d bar chart to compare categories Powerpoint Templates . They Help Make That Crucial Difference.
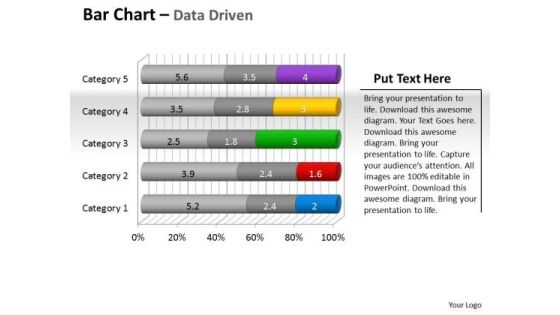
Data Analysis Programs 3d Bar Chart To Put Information PowerPoint Templates
Draw Up Your Agenda On Our data analysis programs 3d bar chart to put information Powerpoint Templates . Coax Your Audience Into Acceptance.
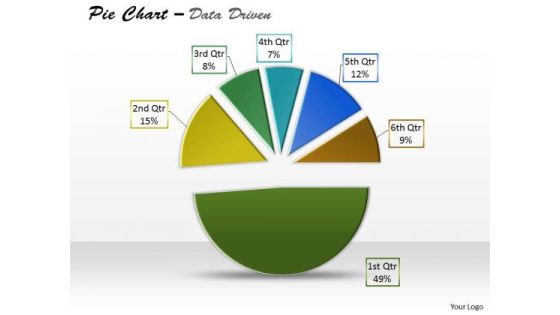
Data Analysis Template Driven Express Business Facts Pie Chart PowerPoint Slides Templates
Display Your Drive On Our data analysis template driven express business facts pie chart powerpoint slides Templates . Invigorate The Audience With Your Fervor.

Data Analysis Template Driven Ineract With Stock Chart PowerPoint Slides Templates
Drive Your Passion With Our data analysis template driven ineract with stock chart powerpoint slides Templates . Steer Yourself To Achieve Your Aims.

Data Analysis Template Driven Line Chart Business Graph PowerPoint Slides Templates
Bottle Your Thoughts In Our data analysis template driven line chart business graph powerpoint slides Templates . Pass It Around For Your Audience To Sip.
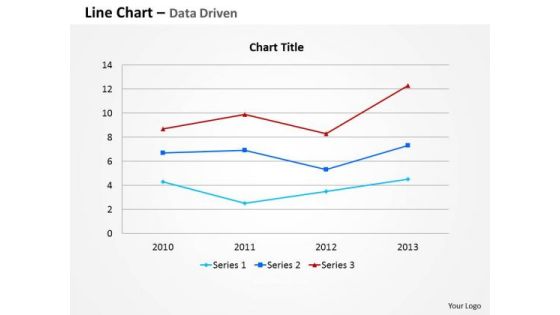
Data Analysis Template Driven Line Chart For Business Information PowerPoint Slides Templates
Your Thoughts Are Dripping With Wisdom. Lace It With Our data analysis template driven line chart for business information powerpoint slides Templates .
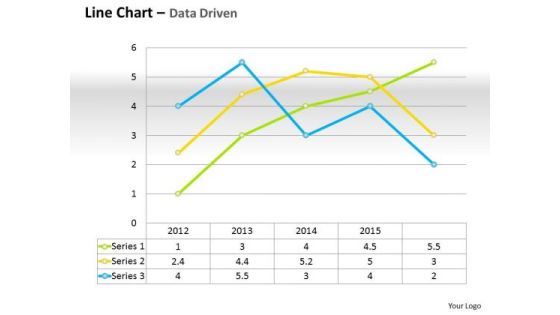
Data Analysis Template Driven Line Chart For Business Performance PowerPoint Slides Templates
Do Not Allow Things To Drift. Ring In Changes With Our data analysis template driven line chart for business performance powerpoint slides Templates .
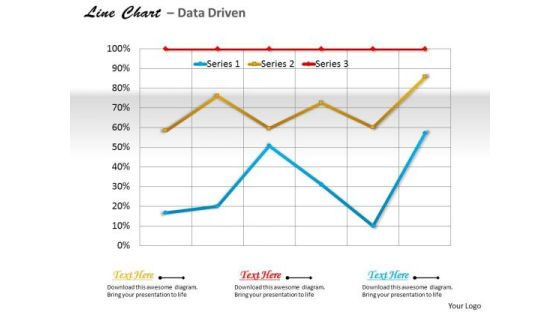
Data Analysis Template Driven Line Chart For Business Trends PowerPoint Slides Templates
Use Our data analysis template driven line chart for business trends powerpoint slides Templates As The Bit. Drill Your Thoughts Into Their Minds.
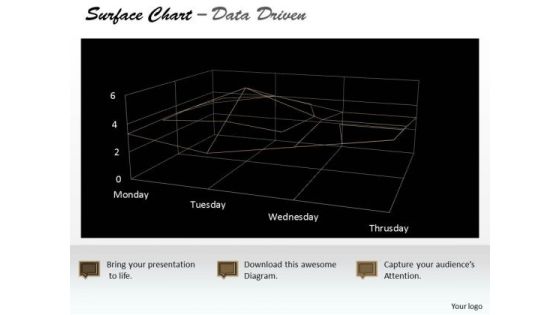
Data Analysis Template Driven Surface Chart Indicating Areas PowerPoint Slides Templates
Highlight Your Drive With Our data analysis template driven surface chart indicating areas powerpoint slides Templates . Prove The Fact That You Have Control.
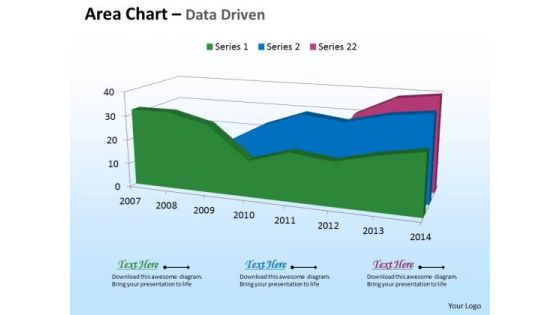
Microsoft Excel Data Analysis 3d Area Chart For Time Based PowerPoint Templates
Deliver The Right Dose With Our microsoft excel data analysis 3d area chart for time based Powerpoint Templates . Your Ideas Will Get The Correct Illumination.
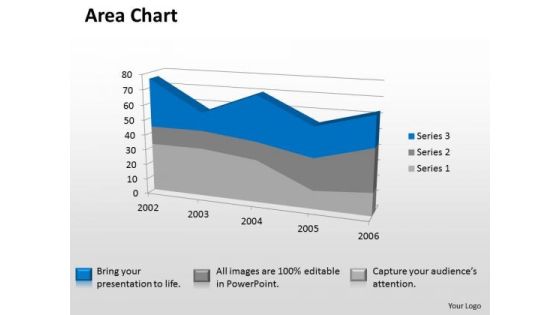
Microsoft Excel Data Analysis 3d Area Chart Showimg Change In Values PowerPoint Templates
Our microsoft excel data analysis 3d area chart showimg change in values Powerpoint Templates Deliver At Your Doorstep. Let Them In For A Wonderful Experience.
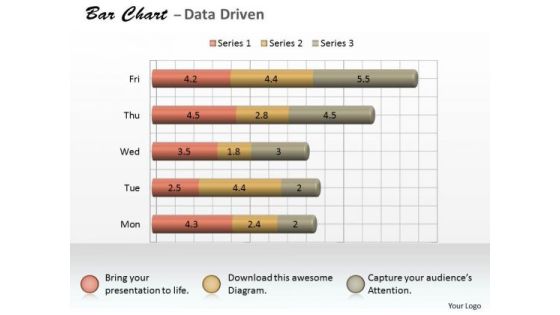
Microsoft Excel Data Analysis 3d Bar Chart As Research Tool PowerPoint Templates
Knock On The Door To Success With Our microsoft excel data analysis 3d bar chart as research tool Powerpoint Templates . Be Assured Of Gaining Entry.
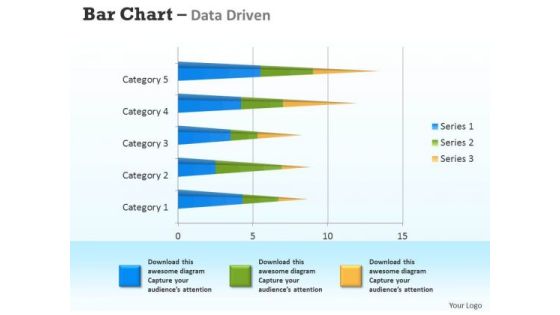
Microsoft Excel Data Analysis 3d Bar Chart For Analyzing Survey PowerPoint Templates
Connect The Dots With Our microsoft excel data analysis 3d bar chart for analyzing survey Powerpoint Templates . Watch The Whole Picture Clearly Emerge.

Microsoft Excel Data Analysis 3d Change In Business Process Chart PowerPoint Templates
Double Your Chances With Our microsoft excel data analysis 3d change in business process chart Powerpoint Templates . The Value Of Your Thoughts Will Increase Two-Fold.

Microsoft Excel Data Analysis 3d Chart For Business Observation PowerPoint Templates
Double Up Our microsoft excel data analysis 3d chart for business observation Powerpoint Templates With Your Thoughts. They Will Make An Awesome Pair.
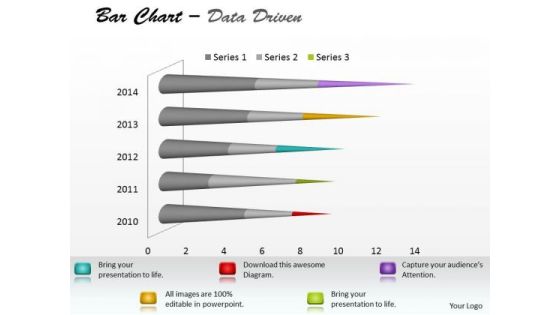
Microsoft Excel Data Analysis Bar Chart To Communicate Information PowerPoint Templates
With Our microsoft excel data analysis bar chart to communicate information Powerpoint Templates You Will Be Doubly Sure. They Possess That Stamp Of Authority.

Microsoft Excel Data Analysis Bar Chart To Compare Quantities PowerPoint Templates
Our microsoft excel data analysis bar chart to compare quantities Powerpoint Templates Leave No One In Doubt. Provide A Certainty To Your Views.
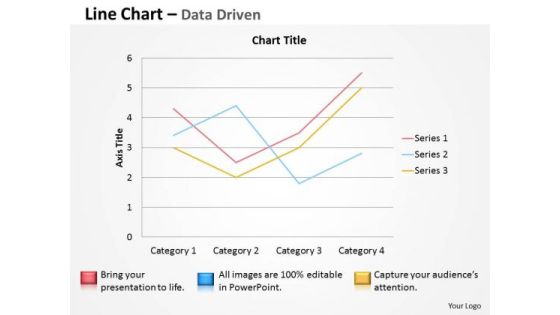
Multivariate Data Analysis Driven Line Chart To Demonstrate PowerPoint Slides Templates
Brace Yourself, Arm Your Thoughts. Prepare For The Hustle With Our multivariate data analysis driven line chart to demonstrate powerpoint slides Templates .
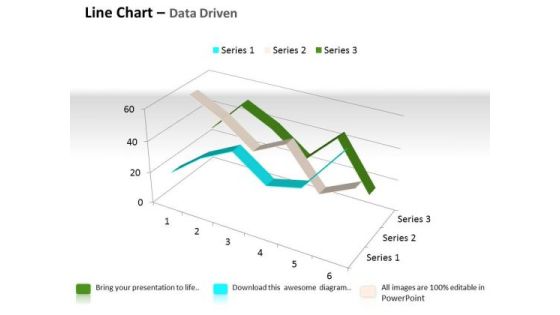
Quantitative Data Analysis 3d Line Chart For Comparison Of PowerPoint Templates
Touch Base With Our quantitative data analysis 3d line chart for comparison of Powerpoint Templates . Review Your Growth With Your Audience.

Quantitative Data Analysis 3d Pie Chart For Business Process PowerPoint Templates
Put Them On The Same Page With Our quantitative data analysis 3d pie chart for business process Powerpoint Templates . Your Team Will Sing From The Same Sheet.
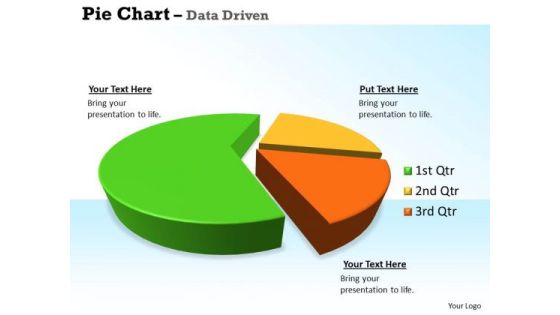
Quantitative Data Analysis 3d Pie Chart For Business Statistics PowerPoint Templates
Our quantitative data analysis 3d pie chart for business statistics Powerpoint Templates Allow You To Do It With Ease. Just Like Picking The Low Hanging Fruit.

Market Competitiveness Template 1 Ppt PowerPoint Presentation Slides Template
This is a market competitiveness template 1 ppt powerpoint presentation slides template. This is a three stage process. The stages in this process are financial position, advertising, market share, brand image, customer loyalty.
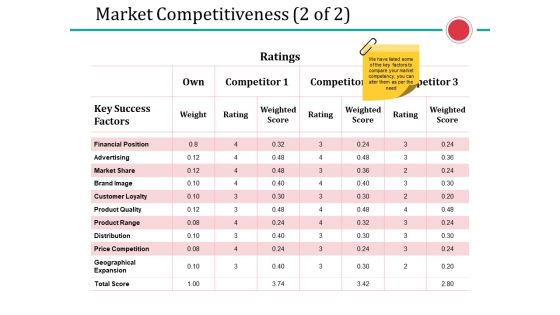
Market Competitiveness Template 2 Ppt PowerPoint Presentation Portfolio Graphic Tips
This is a market competitiveness template 2 ppt powerpoint presentation portfolio graphic tips. This is a three stage process. The stages in this process are financial position, advertising, market share, brand image, customer loyalty.
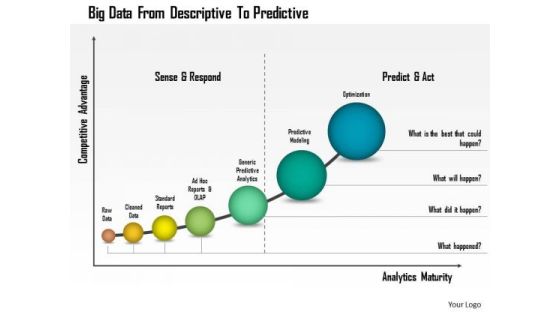
Business Diagram Big Data From Descriptive To Predictive Presentation Template
This business diagram has been designed with graphic of linear bar graph. This growing bar graph depicts the concept of big data analysis. Use this professional diagram for your financial and business analysis.
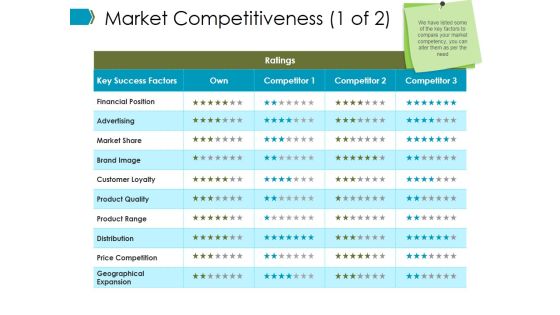
Market Competitiveness Template Ppt PowerPoint Presentation Summary Ideas
This is a market competitiveness template ppt powerpoint presentation summary ideas. This is a three stage process. The stages in this process are financial position, advertising, market share, brand image, customer loyalty.

Data Analysis On Excel 3d Chart Shows Interrelated Sets Of PowerPoint Templates
Put Them On The Same Page With Our data analysis on excel 3d chart shows interrelated sets of Powerpoint Templates . Your Team Will Sing From The Same Sheet.

Earned Value Management Analysis Of Different Activities Ppt Infographic Template Slides PDF
This slide represents earned value management analysis of different activities illustrating activities, budget at completion, planned value, actual cost etc use for valuing each activity performance in a project. Presenting Earned Value Management Analysis Of Different Activities Ppt Infographic Template Slides PDF to dispense important information. This template comprises one stages. It also presents valuable insights into the topics including Develop Scope, Develop Task Schedule, Create Risk Plan. This is a completely customizable PowerPoint theme that can be put to use immediately. So, download it and address the topic impactfully.
Investor Deck For Capital Generation From Substitute Funding Options Magnifying Glass Slides PDF
Presenting this set of slides with name investor deck for capital generation from substitute funding options magnifying glass slides pdf. This is a five stage process. The stages in this process are magnifying glass. This is a completely editable PowerPoint presentation and is available for immediate download. Download now and impress your audience.

Convertible Bonds Pitch Deck For Increasing Capitals Magnifying Glass Clipart PDF
Presenting convertible bonds pitch deck for increasing capitals magnifying glass clipart pdf to provide visual cues and insights. Share and navigate important information on seven stages that need your due attention. This template can be used to pitch topics like magnifying glass. In addition, this PPT design contains high-resolution images, graphics, etc, that are easily editable and available for immediate download.
Fintech Startup Shareholder Capital Raising Magnifying Glass Ppt Model Ideas PDF
Presenting fintech startup shareholder capital raising magnifying glass ppt model ideas pdf to provide visual cues and insights. Share and navigate important information on seven stages that need your due attention. This template can be used to pitch topics like magnifying glass. In addtion, this PPT design contains high resolution images, graphics, etc, that are easily editable and available for immediate download.

Startup Pitch To Raise Capital From Crowdfunding Magnifying Glass Professional PDF
This is a startup pitch to raise capital from crowdfunding magnifying glass professional pdf template with various stages. Focus and dispense information on three stages using this creative set, that comes with editable features. It contains large content boxes to add your information on topics like magnifying glass. You can also showcase facts, figures, and other relevant content using this PPT layout. Grab it now.

Predictive Analytics In The Age Of Big Data Uses Of Predictive Analytics Credit Ideas PDF
This slide describes the usage of predictive analytics in banking and other financial institutions for credit purposes. It is used to calculate the credit score of a person or organization and to ensure that borrower doesnot fail to return the loan. Present like a pro with Predictive Analytics In The Age Of Big Data Uses Of Predictive Analytics Credit Ideas PDF Create beautiful presentations together with your team, using our easy to use presentation slides. Share your ideas in real time and make changes on the fly by downloading our templates. So whether you are in the office, on the go, or in a remote location, you can stay in sync with your team and present your ideas with confidence. With Slidegeeks presentation got a whole lot easier. Grab these presentations today.

Data Lineage Implementation Typical Use Cases Of Data Lineage Pictures PDF
This slide outlines the typical use cases of data lineage that include performing root-cause analysis, generating reports, deprecating columns, and setting data retention policies. Data lineage enables a broad range of information use applications for IT departments and various stakeholder groups. Make sure to capture your audiences attention in your business displays with our gratis customizable Data Lineage Implementation Typical Use Cases Of Data Lineage Pictures PDF. These are great for business strategies, office conferences, capital raising or task suggestions. If you desire to acquire more customers for your tech business and ensure they stay satisfied, create your own sales presentation with these plain slides.

Financials Base Plan Template 2 Ppt PowerPoint Presentation Outline Backgrounds
This is a financials base plan template 2 ppt powerpoint presentation outline backgrounds. This is a three stage process. The stages in this process are cost of sales, gross profit, customer acquisition cost, other operating cost expense, operating profit.
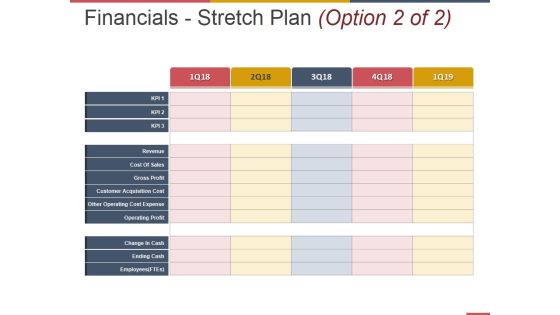
Financials Stretch Plan Template 1 Ppt PowerPoint Presentation Pictures Professional
This is a financials stretch plan template 1 ppt powerpoint presentation pictures professional. This is a three stage process. The stages in this process are cost of sales, gross profit, customer acquisition cost, other operating cost expense, operating profit.
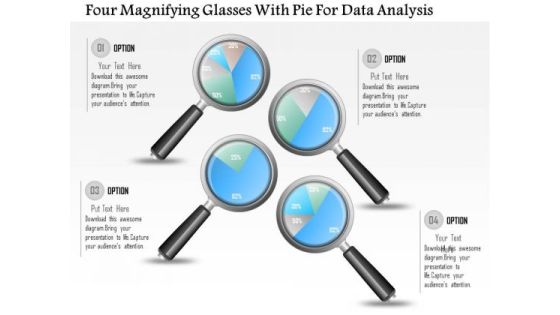
Business Diagram Four Magnifying Glasses With Pie For Data Analysis PowerPoint Slide
This business diagram displays graphic of pie charts in shape of magnifying glasses This business slide is suitable to present and compare business data. Use this diagram to build professional presentations for your viewers.
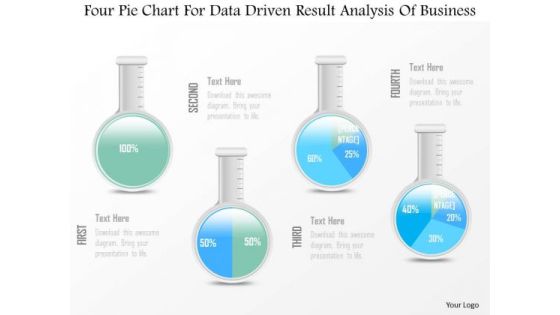
Business Diagram Four Pie Chart For Data Driven Result Analysis Of Business PowerPoint Slide
This business diagram displays graphic of pie charts in shape of flasks. This business slide is suitable to present and compare business data. Use this diagram to build professional presentations for your viewers.

Roto Hog Stock Exchange Sales Call Management Money Management Ppt PowerPoint Presentation Gallery Graphics Design
This is a roto hog stock exchange sales call management money management ppt powerpoint presentation gallery graphics design. This is a three stage process. The stages in this process are roto hog stock exchange, sales call management, money management.

Corporate Execution And Financial Liability Report Project Budget Portrait PDF
Presenting this set of slides with name corporate execution and financial liability report project budget portrait pdf. The topics discussed in these slides are develop, cost, perform, acceptance. This is a completely editable PowerPoint presentation and is available for immediate download. Download now and impress your audience.
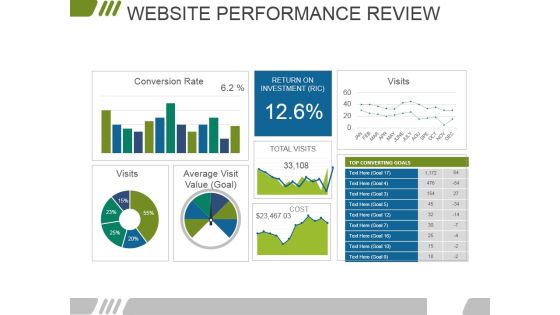
Website Performance Review Template 2 Ppt PowerPoint Presentation Infographics Background Designs
This is a website performance review template 2 ppt powerpoint presentation infographics background designs. This is a three stage process. The stages in this process are conversion rate, visits, return on investment, average visit value.

Industry Analysis Report Powerpoint Slide Deck Template
This is a industry analysis report powerpoint slide deck template. This is a four stage process. The stages in this process are industry snapshot, brand safety, ad fraud, viewability, tra score.

Budget Capital Expenditure Strategy Report Icon Ppt PowerPoint Presentation Gallery Show PDF
Presenting budget capital expenditure strategy report icon ppt powerpoint presentation gallery show pdf to dispense important information. This template comprises three stages. It also presents valuable insights into the topics including budget capital expenditure strategy report icon. This is a completely customizable PowerPoint theme that can be put to use immediately. So, download it and address the topic impactfully.

Data Requirements For Analytics For Employees Recruitment Professional PDF
This slide provides information about the data requirement analysis for employees recruitment which include steps such as sourcing talent, onboarding and employees long term goals. Persuade your audience using this data requirements for analytics for employees recruitment professional pdf. This PPT design covers three stages, thus making it a great tool to use. It also caters to a variety of topics including recruitment, goals, employees. Download this PPT design now to present a convincing pitch that not only emphasizes the topic but also showcases your presentation skills.

data collection and analysis flow chart ppt powerpoint presentation microsoft
This is a data collection and analysis flow chart ppt powerpoint presentation microsoft. This is a nine stage process. The stages in this process are business, planning, marketing, strategy, management.
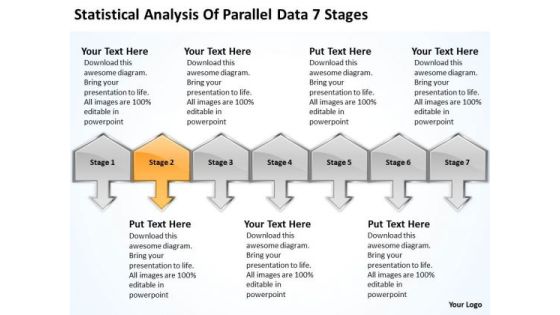
Analysis Of Parallel Data 7 Stages Ppt What Business Planning PowerPoint Templates
We present our analysis of parallel data 7 stages ppt what business planning PowerPoint templates.Use our Arrows PowerPoint Templates because you have the process in your head, our template design showing will illuminate your thoughts. Present our Shapes PowerPoint Templates because this template contains the material to highlight the key issues of your presentation. Download our Metaphors-Visual Concepts PowerPoint Templates because you have good reasons to back up the strength of your belief. Present our Signs PowerPoint Templates because you have made significant headway in this field. Download our Business PowerPoint Templates because the fruits of your labour are beginning to show.Enlighten them on the great plans you have for their enjoyment.Use these PowerPoint slides for presentations relating to achieve, achievement, action, business, chinese, company, concept, conceptual, corporate, definition, idea, macro, market, nature, organization, paintbrush, plan, profit, research, results, sand, shape, single, success, successful, symbol, text, translation, treasure, vision, word. The prominent colors used in the PowerPoint template are Orange, Gray, Black. People tell us our analysis of parallel data 7 stages ppt what business planning PowerPoint templates are visually appealing. Use our concept PowerPoint templates and PPT Slides are Festive. Use our analysis of parallel data 7 stages ppt what business planning PowerPoint templates are Awesome. PowerPoint presentation experts tell us our conceptual PowerPoint templates and PPT Slides are No-nonsense. People tell us our analysis of parallel data 7 stages ppt what business planning PowerPoint templates are Fun. Customers tell us our conceptual PowerPoint templates and PPT Slides will impress their bosses and teams.
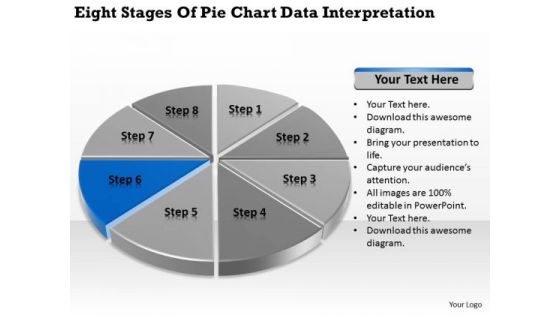
Stages Of Pie Chart Data Interpretation Example Business Plan PowerPoint Slides
We present our stages of pie chart data interpretation example business plan PowerPoint Slides.Download and present our Circle Charts PowerPoint Templates because It will let you Set new benchmarks with our PowerPoint Templates and Slides. They will keep your prospects well above par. Download our Marketing PowerPoint Templates because Our PowerPoint Templates and Slides will weave a web of your great ideas. They are gauranteed to attract even the most critical of your colleagues. Use our Business PowerPoint Templates because It will Strengthen your hand with your thoughts. They have all the aces you need to win the day. Present our Shapes PowerPoint Templates because It will get your audience in sync. Present our Process and Flows PowerPoint Templates because Our PowerPoint Templates and Slides will generate and maintain the level of interest you desire. They will create the impression you want to imprint on your audience.Use these PowerPoint slides for presentations relating to achievement, analysis, background, bank, banking, business, calculation, chart, circle, commerce, commercial, commission, concept, credit, crisis, debt, deposit, design, detail, diagram, earnings, economics, economy, element, finance, goal, gold, golden, graph, graphic, growth, icon, idea, illustration, income, increase, invest, isolated, level, loss, market, marketing, metal, modern, money, new, object, part, percent, percentage, pie, plot, politics, profit, progress, ratio, reflection, reflective. The prominent colors used in the PowerPoint template are Blue navy, Gray, Black.
