Revenue Dashboard
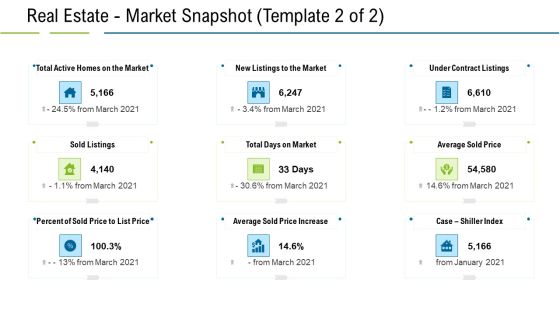
United States Real Estate Industry Real Estate Market Snapshot Price Ppt Layouts Graphics Tutorials PDF
This is a united states real estate industry real estate market snapshot price ppt layouts graphics tutorials pdf template with various stages. Focus and dispense information on nine stages using this creative set, that comes with editable features. It contains large content boxes to add your information on topics like price, market, sold listings, average sold price increase. You can also showcase facts, figures, and other relevant content using this PPT layout. Grab it now.

Commercial Property Administration And Advancement Real Estate Market Snapshot Price Diagrams PDF
This is a commercial property administration and advancement real estate market snapshot price diagrams pdf template with various stages. Focus and dispense information on nine stages using this creative set, that comes with editable features. It contains large content boxes to add your information on topics like price, market, sold listings, average sold price increase. You can also showcase facts, figures, and other relevant content using this PPT layout. Grab it now.
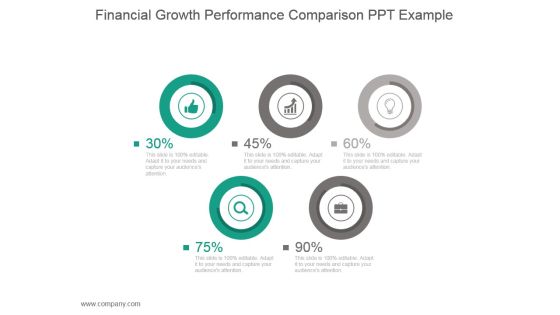
Financial Growth Performance Comparison Ppt Example
This is a financial growth performance comparison ppt example. This is a five stage process. The stages in this process are business, strategy, marketing, finance, icons.

Big Data Architect Paying Loads Of Money To Manage Big Data Rules PDF
This slide explains another challenge that is paying loads of money on hardware, new hires, software development, and its solution.Deliver and pitch your topic in the best possible manner with this Big Data Architect Paying Loads Of Money To Manage Big Data Rules PDF. Use them to share invaluable insights on Required Frameworks, Maintenance Software, Extreme Flexibility and impress your audience. This template can be altered and modified as per your expectations. So, grab it now.

Statistical Data Analysis Chart Of Collected Data Formats PDF
Presenting statistical data analysis chart of collected data formats pdf to dispense important information. This template comprises four stages. It also presents valuable insights into the topics including statistical data analysis chart of collected data. This is a completely customizable PowerPoint theme that can be put to use immediately. So, download it and address the topic impactfully.

Freehold Property Business Plan Real Estate Market Snapshot Price Ppt PowerPoint Presentation Infographic Template Topics PDF
Presenting this set of slides with name freehold property business plan real estate market snapshot price ppt powerpoint presentation infographic template topics pdf. This is a nine stage process. The stages in this process are total active homes market, new listings market, under contract listings, sold listings, total days market, average sold price, percent sold price to list price, average sold price increase, case shiller index. This is a completely editable PowerPoint presentation and is available for immediate download. Download now and impress your audience.

Data Collection And Analysis Control Chart Ppt PowerPoint Presentation Example File
This is a data collection and analysis control chart ppt powerpoint presentation example file. This is a four stage process. The stages in this process are business, strategy, marketing, bar graph, growth strategy.

Financial Development Analysis Ppt Ideas
This is a financial development analysis ppt ideas. This is a twelve stage process. The stages in this process are business infographic.

Business Report With Financial Data Vector Icon Ppt PowerPoint Presentation File Outline PDF
Presenting business report with financial data vector icon ppt powerpoint presentation file outline pdf to dispense important information. This template comprises three stages. It also presents valuable insights into the topics including business report with financial data vector icon. This is a completely customizable PowerPoint theme that can be put to use immediately. So, download it and address the topic impactfully.

Key Company Financial Operation Performance Metrics Ppt Infographic Template Example Introduction PDF
This slide showcases key performance indicators for every business. Key metrics covered are return on assets and equity, working capital ratio, debt and equity ratio. Showcasing this set of slides titled Key Company Financial Operation Performance Metrics Ppt Infographic Template Example Introduction PDF. The topics addressed in these templates are Return on Assets, Working Capital Ratio, Return on Equity. All the content presented in this PPT design is completely editable. Download it and make adjustments in color, background, font etc. as per your unique business setting.

Financial Projections Income Statement Ppt PowerPoint Presentation Inspiration Vector
This is a financial projections income statement ppt powerpoint presentation inspiration vector. This is a four stage process. The stages in this process are net sales, expenses, cost of goods sold, employee benefit expense, financing cost.
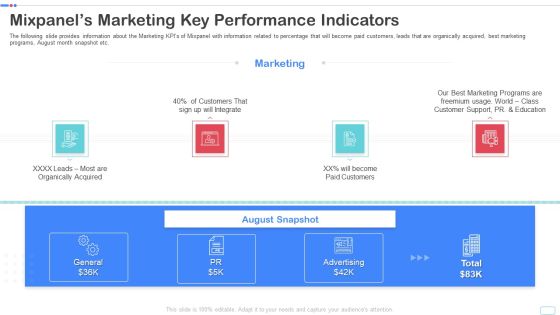
Mixpanel Capital Raising Pitch Deck Mixpanels Marketing Key Performance Indicators Portrait PDF
The following slide provides information about the Marketing KPIs of Mixpanel with information related to percentage that will become paid customers, leads that are organically acquired, best marketing programs, August month snapshot etc. Presenting mixpanel capital raising pitch deck mixpanels marketing key performance indicators portrait pdf to provide visual cues and insights. Share and navigate important information on four stages that need your due attention. This template can be used to pitch topics like mixpanels marketing key performance indicators. In addtion, this PPT design contains high resolution images, graphics, etc, that are easily editable and available for immediate download.

Pandl Kpis Ppt PowerPoint Presentation Infographic Template Layout
This is a pandl kpis ppt powerpoint presentation infographic template layout. This is a four stage process. The stages in this process are net sales, other income, total income, expenses, total material consumed.

Product Data Insights Analysis Sheet Infographics PDF
The following slide depicts the annual performance of multiple products in terms of profit or loss to track whether they are doing well or not. The analysis sheet includes element such as cost, units, selling price, sales etc. Pitch your topic with ease and precision using this Product Data Insights Analysis Sheet Infographics PDF. This layout presents information on Unit Sold, Selling Price, Total Sales. It is also available for immediate download and adjustment. So, changes can be made in the color, design, graphics or any other component to create a unique layout.
Financial Summary Ppt PowerPoint Presentation Icon Pictures
This is a financial summary ppt powerpoint presentation icon pictures. This is a seven stage process. The stages in this process are net sales, expenses, ebitda, profit after tax.

Toolkit For Data Science And Analytics Transition Business Requirements For Data Analytics Project Designs PDF
The slide specifies the key requirements for data analytics project covering the business, data, application and technology aspects. Do you have to make sure that everyone on your team knows about any specific topic I yes, then you should give Toolkit For Data Science And Analytics Transition Business Requirements For Data Analytics Project Designs PDF a try. Our experts have put a lot of knowledge and effort into creating this impeccable Toolkit For Data Science And Analytics Transition Business Requirements For Data Analytics Project Designs PDF. You can use this template for your upcoming presentations, as the slides are perfect to represent even the tiniest detail. You can download these templates from the Slidegeeks website and these are easy to edit. So grab these today.

Financial Reporting Manager With Data Powerpoint Slides
This PowerPoint template has been designed with graphics of finance manager and percentage data. This diagram is useful to exhibit financial management. This diagram slide can be used to make impressive presentations.

Organization Financial Team Summary With Key Performance Indicators Clipart PDF
This slide represents a report prepared by the finance team showing the financial position of the organization with the help of key performance indicators. It demonstrates data related to current working capital, cash conversion cycle and vendor payment error rate of the company. Pitch your topic with ease and precision using this Organization Financial Team Summary With Key Performance Indicators Clipart PDF. This layout presents information on Current Working Capital, Cash Conversion Cycle. It is also available for immediate download and adjustment. So, changes can be made in the color, design, graphics or any other component to create a unique layout.

Marketing Budgetary Trends Comparison Pre And Post COVID 19 Background PDF
This slide shows investment by marketers in different areas. Some are hoping increase in the areas others are not willing to invest more due to uncertainty.Pitch your topic with ease and precision using this Marketing Budgetary Trends Comparison Pre And Post COVID 19 Background PDF. This layout presents information on Content Marketing, Influencer Marketing, Content Marketing. It is also available for immediate download and adjustment. So, changes can be made in the color, design, graphics or any other component to create a unique layout.

Paying Loads Of Money To Manage Big Data Ppt PowerPoint Presentation File Files PDF
Presenting Paying Loads Of Money To Manage Big Data Ppt PowerPoint Presentation File Files PDF to provide visual cues and insights. Share and navigate important information on four stages that need your due attention. This template can be used to pitch topics like Services, Extreme Security, Required Frameworks. In addtion, this PPT design contains high resolution images, graphics, etc, that are easily editable and available for immediate download.
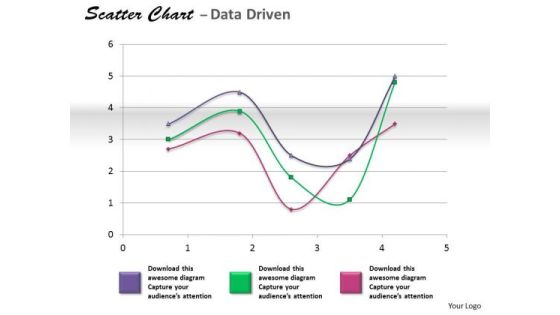
Financial Data Analysis Coordinate With Scatter Chart PowerPoint Templates
Get The Doers Into Action. Activate Them With Our financial data analysis coordinate with scatter chart Powerpoint Templates .
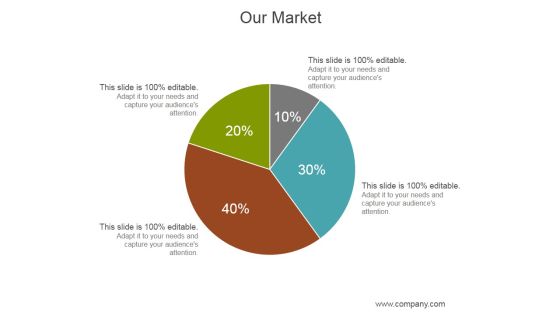
Our Market Ppt PowerPoint Presentation Deck
This is a our market ppt powerpoint presentation deck. This is a four stage process. The stages in this process are business, marketing, management, finance, analysis.

Finland Map With Economic Data Analysis Powerpoint Slides
This PowerPoint template has been designed with Finland Map and areas highlighted. You may use this slide to display financial strategy analysis. This diagram provides an effective way of displaying information you can edit text, color, shade and style as per you need.

Financial Data Analysis Area Chart For Showing Trends PowerPoint Templates
Document Your Views On Our financial data analysis area chart for showing trends Powerpoint Templates . They Will Create A Strong Impression.
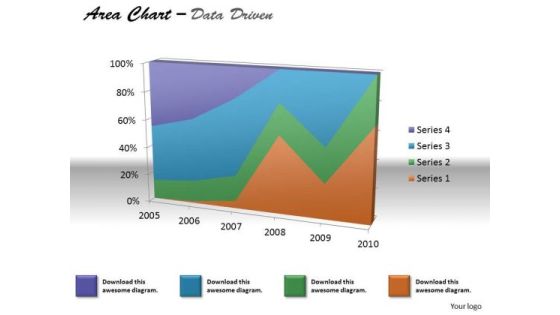
Financial Data Analysis Area Chart For Various Values PowerPoint Templates
Document The Process On Our financial data analysis area chart for various values Powerpoint Templates . Make A Record Of Every Detail.
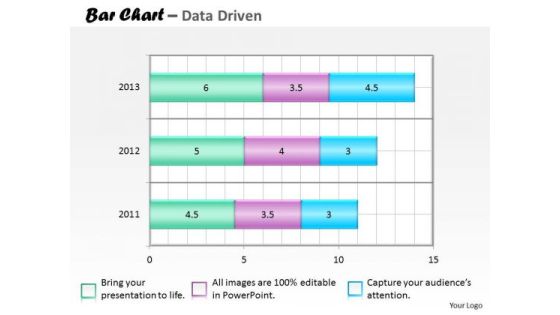
Financial Data Analysis Bar Chart For Collection Of PowerPoint Templates
Our financial data analysis bar chart for collection of Powerpoint Templates Team Are A Dogged Lot. They Keep At It Till They Get It Right.

Financial Data Analysis Currency Trading Bar Chart PowerPoint Templates
Put In A Dollop Of Our financial data analysis currency trading bar chart Powerpoint Templates . Give Your Thoughts A Distinctive Flavor.
Data Research And Analysis For Mobile Users Ppt PowerPoint Presentation Icon Inspiration
This is a data research and analysis for mobile users ppt powerpoint presentation icon inspiration. This is a four stage process. The stages in this process are mobile analytics, mobile tracking, mobile web analytics.
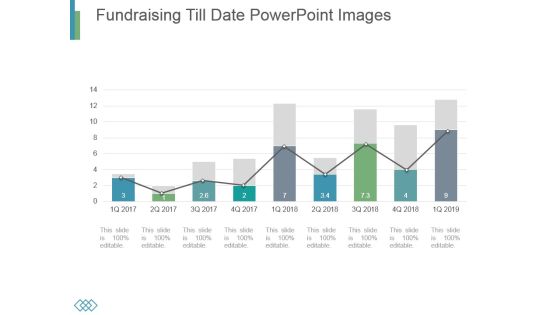
Fundraising Till Date Powerpoint Images
This is a fundraising till date powerpoint images. This is a nine stage process. The stages in this process are business, marketing, growth, timeline, management.

Forecasted Financial Data Analytics Expansion Trends Slides PDF
This slide shows financial data analytics growth trends till 2029 that highlights geographical distribution of growth among different countries. It include key market players and geographical growth etc. Showcasing this set of slides titled Forecasted Financial Data Analytics Expansion Trends Slides PDF. The topics addressed in these templates are Machine Learning, Projected Growth, Industry. All the content presented in this PPT design is completely editable. Download it and make adjustments in color, background, font etc. as per your unique business setting.

Bar Graph Displaying Profit Growth Powerpoint Slides
This PowerPoint template has been designed with six point?s bar graph with icons. This PPT slide can be used to prepare presentations for marketing reports and also for financial data analysis. You can download finance PowerPoint template to prepare awesome presentations.
Concentric Circles Data Flow Diagram 3 Stages Business Plan For Non Profit PowerPoint Slides
We present our concentric circles data flow diagram 3 stages business plan for non profit PowerPoint Slides.Present our Circle Charts PowerPoint Templates because Our PowerPoint Templates and Slides team portray an attitude of elegance. Personify this quality by using them regularly. Download our Shapes PowerPoint Templates because You will get more than you ever bargained for. Download our Signs PowerPoint Templates because Timeline crunches are a fact of life. Meet all deadlines using our PowerPoint Templates and Slides. Use our Maketing PowerPoint Templates because you can Add colour to your speech with our PowerPoint Templates and Slides. Your presentation will leave your audience speechless. Use our Metaphors-Visual Concepts PowerPoint Templates because Our PowerPoint Templates and Slides are like the strings of a tennis racquet. Well strung to help you serve aces.Use these PowerPoint slides for presentations relating to diagram, circular, market, bar, advertise, interface, business, concept, vector, sign, success, presentation, symbol, template, circle, brochure, finance, data, description, report, marketing, title, label, abstract, management, graph, four, illustration, icon, pie, chart, strategy, catalog, research, web, design, growth, text, professional, banner, account, profit, information, background, info-graphic, analyze, financial, button, goals. The prominent colors used in the PowerPoint template are Blue, Blue light, White.

Mezzanine Venture Capital Funding Pitch Deck Competitive Analysis By Operational And Financial Data Ideas PDF
The slide provides the Competitive landscape of the company on the basis of financial data sales and profit and operational data employee count, locations, year of existence etc. Deliver and pitch your topic in the best possible manner with this mezzanine venture capital funding pitch deck competitive analysis by operational and financial data ideas pdf. Use them to share invaluable insights on financial, company, service, interest, interest and impress your audience. This template can be altered and modified as per your expectations. So, grab it now.

Framework For Forensic Crime Accounting Of Mobile Money Transactions Template PDF
This slide covers framework for detection of M money financial crimes. It aids in monitoring activities such as fraud, social network analysis and money laundering for prevention and mitigation of financial crimes. Showcasing this set of slides titled Framework For Forensic Crime Accounting Of Mobile Money Transactions Template PDF. The topics addressed in these templates are Big Data Analytics, Transaction Data Sources, Customer Profiling. All the content presented in this PPT design is completely editable. Download it and make adjustments in color, background, font etc. as per your unique business setting.
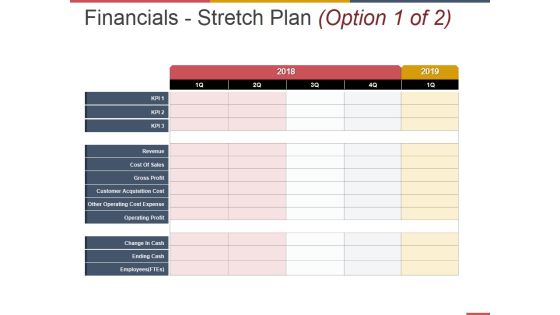
Financials Stretch Plan Template 2 Ppt PowerPoint Presentation Inspiration Background Image
This is a financials stretch plan template 2 ppt powerpoint presentation inspiration background image. This is a three stage process. The stages in this process are cost of sales, gross profit, customer acquisition cost, other operating cost expense, operating profit.

Business Intelligence And Big Key Essential Features Of Data Analytics Tools Topics PDF
The slide elaborates the key features of Data Analytics software which are required to improve business results. The features includes easy raw data processing, scalability, and technical support etc. This is a business intelligence and big key essential features of data analytics tools topics pdf template with various stages. Focus and dispense information on six stages using this creative set, that comes with editable features. It contains large content boxes to add your information on topics like raw data processing, reporting feature, security features, technologies support, scalability quick integrations. You can also showcase facts, figures, and other relevant content using this PPT layout. Grab it now.

Graphical Exploratory Data Analysis Powerpoint Slides Clipart
This is a graphical exploratory data analysis powerpoint slides clipart. This is a five stage process. The stages in this process are techniques, information, predictive, focuses, business.

Business Diagram Diagram For Visual Data Display Presentation Template
Four colored cylindrical bars with percentage values are used to design this power point template. This diagram slide helps to display financial data analysis. Use this diagram for your business and finance related presentations.

Data Quality Kpis Issues Prioritization Scorecard With Assessment Metrics Ideas PDF
This slide covers key data quality issues for e-commerce customers. It includes different metrics to check for impact of data issues in context to sales contribution analysis, marketing testimonials, customer financial risk, marketing campaigns, customer renewal analysis, etc. Showcasing this set of slides titled Data Quality Kpis Issues Prioritization Scorecard With Assessment Metrics Ideas PDF. The topics addressed in these templates are Context Of Analysis, Data Quality Attributes. All the content presented in this PPT design is completely editable. Download it and make adjustments in color, background, font etc. as per your unique business setting.

Business Profits Growth PowerPoint Templates And PowerPoint Themes 1012
Business Profits Growth PowerPoint Templates And PowerPoint Themes 1012-The above template displays a diagram of profit and growth bar graph with dollar in center. This image represents the business concept. Use this template for presentations on growth of indicators, growth of indices, rise up, business development, evaluative reports, ratings, graphs, economy, rate of exchange, market review etc. Adjust the above image in your PPT presentations to visually support your content in your Business and Marketing PPT slideshows. Deliver amazing presentations to mesmerize your audience.-Business Profits Growth PowerPoint Templates And PowerPoint Themes 1012-This PowerPoint template can be used for presentations relating to-Business profits growth, business, finance, success, money, marketing
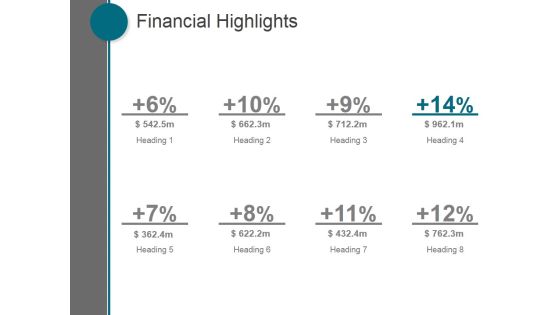
Financial Highlights Ppt PowerPoint Presentation Visual Aids
This is a financial highlights ppt powerpoint presentation visual aids. This is a eight stage process. The stages in this process are business, marketing, management, finance, strategy.

Marketing Plan Word Cloud With Magnifying Glass Ppt Powerpoint Presentation File Slides
This is a marketing plan word cloud with magnifying glass ppt powerpoint presentation file slides. This is a three stage process. The stages in this process are success, business, motivation, management, always, objectives, item, organizational, money, taking.
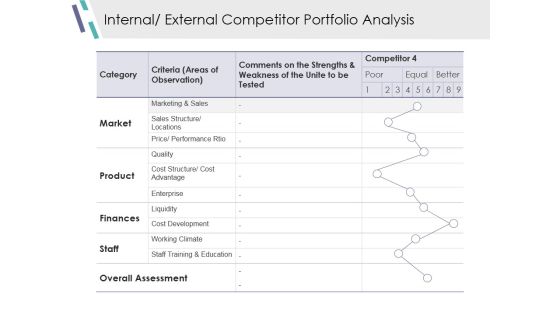
Internal External Competitor Portfolio Analysis Ppt PowerPoint Presentation Model Infographic Template
This is a internal external competitor portfolio analysis ppt powerpoint presentation model infographic template. This is a five stage process. The stages in this process are market, product, finances, staff, overall assessment.

Financial Ppt PowerPoint Presentation Infographic Template Graphics
This is a financial ppt powerpoint presentation infographic template graphics. This is a four stage process. The stages in this process are tables, marketing, planning, strategy, finance.
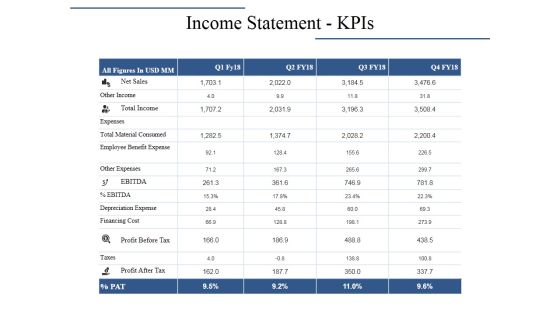
Income Statement Kpis Ppt PowerPoint Presentation Layouts Graphics Pictures
This is a income statement kpis ppt powerpoint presentation layouts graphics pictures. This is a four stage process. The stages in this process are net sales, total income, other income, profit before tax, expenses.
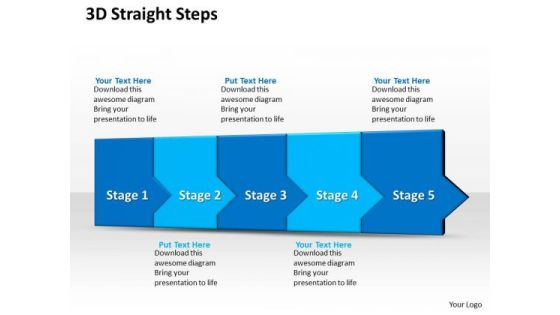
Ppt 3d Straight Description To Prevent Monetary Losses Five Steps PowerPoint Templates
PPT 3d straight description to prevent monetary losses five steps PowerPoint Templates-This diagram usually denotes Timeline process depicted as Linear arrows will be perfect for presentations on schedules, deadlines, milestones, annual reports, year planning, benchmarking, etc.-PPT 3d straight description to prevent monetary losses five steps PowerPoint Templates-Asset, Bank, Banking, Business, Care, Careful, Cash, Commerce, Concept, Crime, Criminal, Currency, Defend, Deposit, Economic, Economy, , Finance, , Financial, Frugal, Future, Goal, Hold, Hope, Identity, Invest, Investment, Keep, Lock, Lockdown, Loss, Market, Money, Optimism, Opulence, Opulent, Planning, Possibility, Precious, Prevention, Profit, Prosperity, Protect, Protection, Reserve, Robbery, Safe, Safety, Save, Saving, Secure, Security, Shelter, Speculate, Tax
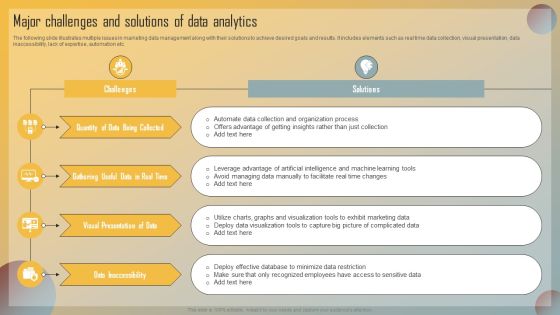
Guide For Marketing Analytics To Improve Decisions Major Challenges And Solutions Of Data Analytics Formats PDF
The following slide illustrates multiple issues in marketing data management along with their solutions to achieve desired goals and results. It includes elements such as real time data collection, visual presentation, data inaccessibility, lack of expertise, automation etc. Make sure to capture your audiences attention in your business displays with our gratis customizable Guide For Marketing Analytics To Improve Decisions Major Challenges And Solutions Of Data Analytics Formats PDF. These are great for business strategies, office conferences, capital raising or task suggestions. If you desire to acquire more customers for your tech business and ensure they stay satisfied, create your own sales presentation with these plain slides.
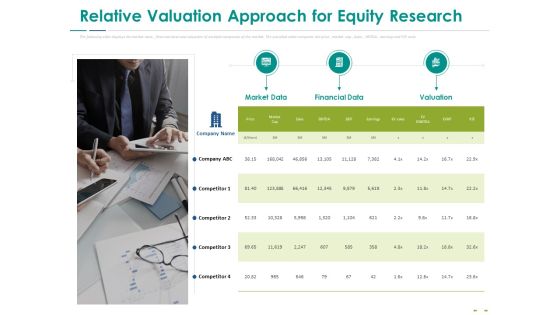
Stock Market Research Report Relative Valuation Approach For Equity Research Inspiration PDF
The following slide displays the market data, financial data and valuation of multiple companies of the market. The provided table compares the price, market cap, Sales, EBITDA, earning and P or E ratio. Presenting stock market research report relative valuation approach for equity research inspiration pdf to provide visual cues and insights. Share and navigate important information on one stages that need your due attention. This template can be used to pitch topics like market data, financial data, valuation. In addition, this PPT design contains high-resolution images, graphics, etc, that are easily editable and available for immediate download.
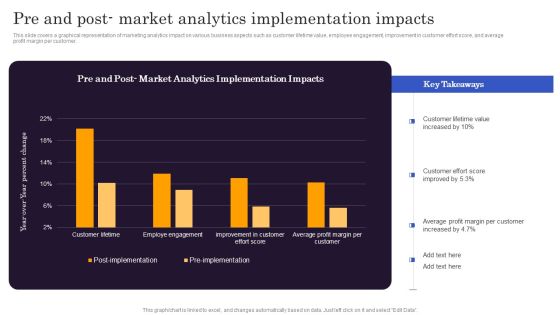
Marketers Guide To Data Analysis Optimization Pre And Post Market Analytics Implementation Impacts Formats PDF
This slide covers a graphical representation of marketing analytics impact on various business aspects such as customer lifetime value, employee engagement, improvement in customer effort score, and average profit margin per customer. Do you know about Slidesgeeks Marketers Guide To Data Analysis Optimization Pre And Post Market Analytics Implementation Impacts Formats PDF. These are perfect for delivering any kind od presentation. Using it, create PowerPoint presentations that communicate your ideas and engage audiences. Save time and effort by using our pre designed presentation templates that are perfect for a wide range of topic. Our vast selection of designs covers a range of styles, from creative to business, and are all highly customizable and easy to edit. Download as a PowerPoint template or use them as Google Slides themes.
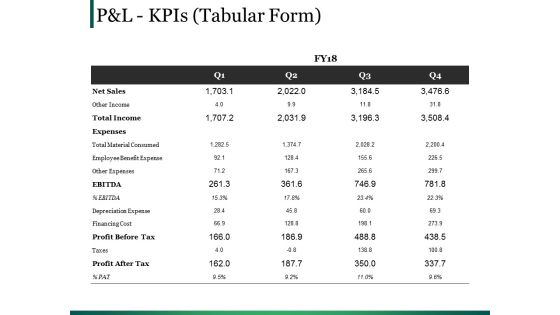
Pandl Kpis Template 1 Ppt PowerPoint Presentation Infographics Tips
This is a pandl kpis template 1 ppt powerpoint presentation infographics tips. This is a four stage process. The stages in this process are ebitda, total income, table, cost, management.

Market Dynamics Ppt PowerPoint Presentation Show
This is a market dynamics ppt powerpoint presentation show. This is a four stage process. The stages in this process are competitive landscape, market opportunity description, economic outlook, market dynamics.
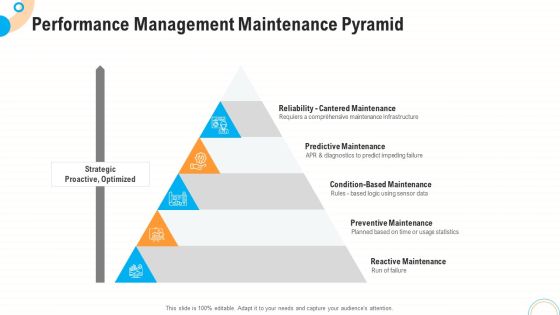
Fiscal And Operational Assessment Performance Management Maintenance Pyramid Infographics PDF
Presenting fiscal and operational assessment performance management maintenance pyramid infographics pdf to provide visual cues and insights. Share and navigate important information on five stages that need your due attention. This template can be used to pitch topics like predictive maintenance, condition based maintenance, preventive maintenance. In addtion, this PPT design contains high resolution images, graphics, etc, that are easily editable and available for immediate download.
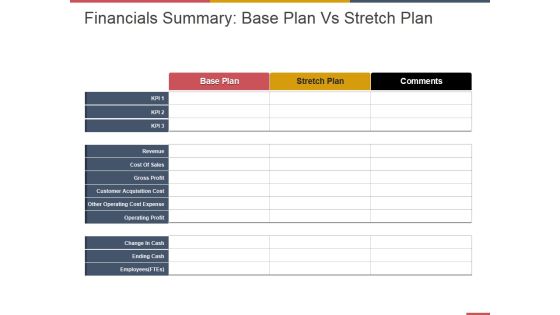
Financials Summary Base Plan Vs Stretch Plan Ppt PowerPoint Presentation Layouts Graphic Tips
This is a financials summary base plan vs stretch plan ppt powerpoint presentation layouts graphic tips. This is a three stage process. The stages in this process are cost of sales, gross profit, customer acquisition cost, other operating cost expense, operating profit.
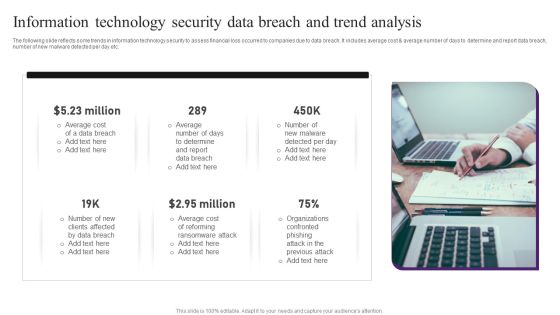
Information Technology Security Data Breach And Trend Analysis Professional PDF
The following slide reflects some trends in information technology security to assess financial loss occurred to companies due to data breach. It includes average cost and average number of days to determine and report data breach, number of new malware detected per day etc. Presenting Information Technology Security Data Breach And Trend Analysis Professional PDF to dispense important information. This template comprises six stages. It also presents valuable insights into the topics including Data Breach, Average Cost, Determine. This is a completely customizable PowerPoint theme that can be put to use immediately. So, download it and address the topic impactfully.

Bar Graph For Marketing Research Process Powerpoint Slides
This PowerPoint template has been designed with diagram of bar graph. This PPT slide can be used to prepare presentations for profit growth report and also for financial data analysis. You can download finance PowerPoint template to prepare awesome presentations.

Circle Diagram For Business Marketing Mix Powerpoint Slides
This PowerPoint template has been designed with nine steps circle chart. This PPT slide can be used to prepare presentations for profit growth report and also for financial data analysis. You can download finance PowerPoint template to prepare awesome presentations.

Financial Ppt PowerPoint Presentation Outline Grid
This is a financial ppt powerpoint presentation outline grid. This is a three stage process. The stages in this process are business, strategy, marketing, analysis, finance, purchase, monthly.

Data Chart For Individual Income Analysis Ppt PowerPoint Presentation Layouts Visual Aids
This is a data chart for individual income analysis ppt powerpoint presentation layouts visual aids. This is a five stage process. The stages in this process are financial analysis, quantitative, statistical modelling.

Donut Ppt PowerPoint Presentation Portfolio Examples
This is a donut ppt powerpoint presentation portfolio examples. This is a four stage process. The stages in this process are business, strategy, analysis, planning, donut, product.

Financial Modelling Growth Reporting Workflow Formats PDF
This slide shows financial modelling report development workflow for forecasting the future ups and downs for business. It include steps such as considering historical data, analyzing historical performance and gathering future assumptions etc. Pitch your topic with ease and precision using this Financial Modelling Growth Reporting Workflow Formats PDF. This layout presents information on Forecast Financial Statements, Risk Assessment, Forecasting Assumptions. It is also available for immediate download and adjustment. So, changes can be made in the color, design, graphics or any other component to create a unique layout.
 Home
Home