Revenue Dashboard
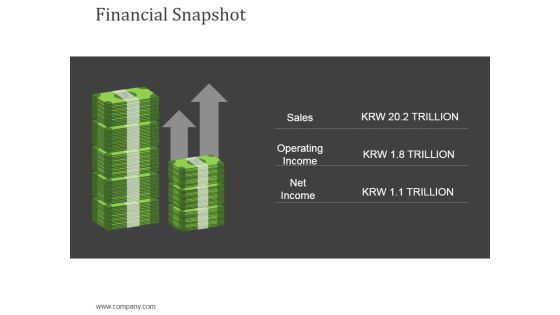
Financial Snapshot Ppt Powerpoint Presentation Layouts Slides
This is a financial snapshot ppt powerpoint presentation layouts slides. This is a two stage process. The stages in this process are sales, operating income, net income, currency, finance.

4 Key Market Drivers Of Economic Growth Ppt PowerPoint Presentation Templates
This is a 4 key market drivers of economic growth ppt powerpoint presentation templates. This is a four stage process. The stages in this process are key market driver.

Data Processing And Analysis Powerpoint Slides
This is a data processing and analysis powerpoint slides. This is a five stage process. The stages in this process are financial reporting and business excellence, competitive intelligence and strategy support, analysis and tool creation, planning and performance management support, data processing and analysis.
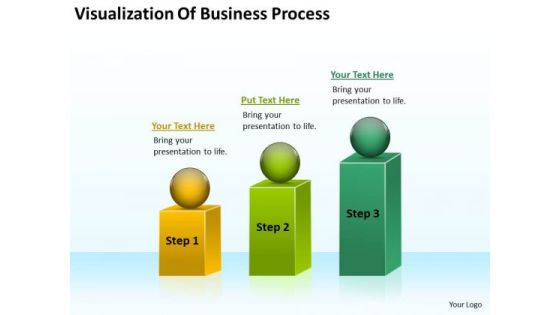
Visualization Of Business Process Ppt Plan PowerPoint Templates
We present our visualization of business process ppt plan PowerPoint templates.Present our Process and Flows PowerPoint Templates because Our PowerPoint Templates and Slides will Embellish your thoughts. They will help you illustrate the brilliance of your ideas. Download and present our Spheres PowerPoint Templates because It will Raise the bar of your Thoughts. They are programmed to take you to the next level. Use our Flow Charts PowerPoint Templates because Our PowerPoint Templates and Slides are conceived by a dedicated team. Use them and give form to your wondrous ideas. Use our Shapes PowerPoint Templates because Our PowerPoint Templates and Slides has conjured up a web of all you need with the help of our great team. Use them to string together your glistening ideas. Download and present our Marketing PowerPoint Templates because Our PowerPoint Templates and Slides will let you Leave a lasting impression to your audiences. They possess an inherent longstanding recall factor.Use these PowerPoint slides for presentations relating to Diagram, chart, market, statistics, square, grow, infograph, bar, corporate, business, vector, success, presentation, growing, circle, finance,analyst, goal, report, marketing, different, accounting, management, graph, illustration, geometric, sphere, design, growth, infographic, progress, profit,information, increase, aim, analyze, financial, rising, measure, block. The prominent colors used in the PowerPoint template are Green, Green lime, Yellow.

Annual Financial Budget Analysis Example Of Ppt
This is a annual financial budget analysis example of ppt. This is a five stage process. The stages in this process are business, strategy, finance, planning, compare.

Best Performing Tools For Real Time Data Processing Ppt Inspiration Information PDF
This slide covers the technologies used for real time data management which reduces workloads, protects data from being damaged that allows organization to control data and use it for driving revenues. Persuade your audience using this Best Performing Tools For Real Time Data Processing Ppt Inspiration Information PDF. This PPT design covers four stages, thus making it a great tool to use. It also caters to a variety of topics including Reduces Data, Flexible And Developer Friendly, Programming Tools, Data Streaming. Download this PPT design now to present a convincing pitch that not only emphasizes the topic but also showcases your presentation skills.

Business Consultant Vector Analyzing Financial Reports Icon Ppt PowerPoint Presentation Gallery Example Introduction PDF
Presenting this set of slides with name business consultant vector analyzing financial reports icon ppt powerpoint presentation gallery example introduction pdf. This is a three stage process. The stages in this process are business consultant vector analyzing financial reports icon. This is a completely editable PowerPoint presentation and is available for immediate download. Download now and impress your audience.

Financial Report With Main Findings And Recommendations Ppt PowerPoint Presentation File Demonstration PDF
Presenting financial report with main findings and recommendations ppt powerpoint presentation file demonstration pdf to dispense important information. This template comprises three stages. It also presents valuable insights into the topics including financial report with main findings and recommendations. This is a completely customizable PowerPoint theme that can be put to use immediately. So, download it and address the topic impactfully.

Financial Banking PPT Valuation Summary Along With Stock Price Performance Ideas PDF
The slide provides the target companys valuation summary along with stock price performance 9in comparison with index, key valuation metrics and share price estimates by the brokers for Dec 2021. Deliver and pitch your topic in the best possible manner with this financial banking ppt valuation summary along with stock price performance ideas pdf. Use them to share invaluable insights on target, revenues, valuation metrics and impress your audience. This template can be altered and modified as per your expectations. So, grab it now.
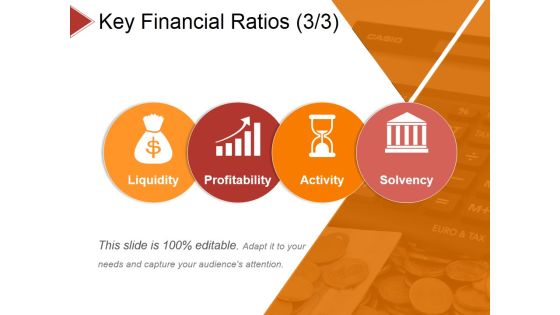
Key Financial Ratios Template 3 Ppt PowerPoint Presentation Summary Sample
This is a key financial ratios template 3 ppt powerpoint presentation summary sample. This is a four stage process. The stages in this process are liquidity, profitability, activity, solvency.

Business Framework Key Metrics Required For Different Company Situations PowerPoint Presentation
This diagram has been designed with framework of key metrics required for different company situations. This diagram contains rectangle of operating value drivers with four sections inside it representing terms like growth of net Income, multiyear DCF of economic profit, net income, return on sales, ROIC-WACC, and economic profit. Use this as a major element in streamlining any business process.

Key Financial Ratios Template Ppt PowerPoint Presentation Show Graphics Design
This is a key financial ratios template ppt powerpoint presentation show graphics design. This is a four stage process. The stages in this process are liquidity, profitability, activity, solvency.
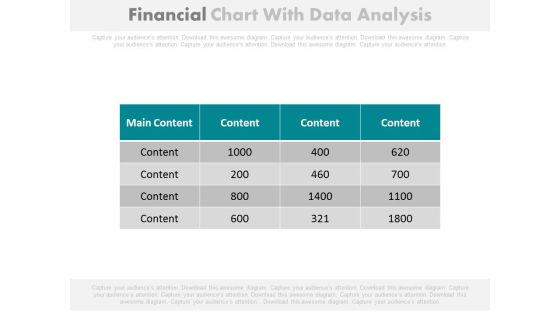
Financial Figures Data Analysis Report Powerpoint Slides
Our above PowerPoint template contains table chart with financial figures. This professional slide may be used to display data analysis report. Enlighten your audience with your breathtaking ideas.

3 Years Business Planning For Market Analysis Ppt PowerPoint Presentation Outline Icons PDF
Persuade your audience using this 3 years business planning for market analysis ppt powerpoint presentation outline icons pdf. This PPT design covers three stages, thus making it a great tool to use. It also caters to a variety of topics including analyzing market for knowing current trends, questionnaire prepared for getting, customers information, implementing strategies for improving business revenues, developing plans for achieving business objectives, identifying growth opportunities. Download this PPT design now to present a convincing pitch that not only emphasizes the topic but also showcases your presentation skills.

Medical Care Organization Management And Statistical Analysis Summary PDF
This slide covers the details related to the healthcare company. The purpose of this template is to define the fact sheet used in the healthcare industry. It covers information about mission, vision, key metrics, revenues, etc. Showcasing this set of slides titled Medical Care Organization Management And Statistical Analysis Summary PDF. The topics addressed in these templates are Executive, Chief Medical Officer, Management. All the content presented in this PPT design is completely editable. Download it and make adjustments in color, background, font etc. as per your unique business setting.
Marketing Strategies Budgetary Trends Infographics PDF
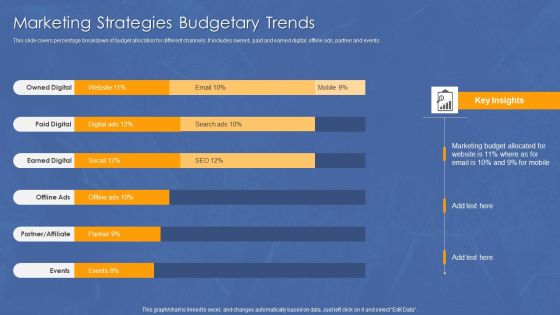
This slide covers percentage breakdown of budget allocation for different channels. It includes owned , paid and earned digital, offline ads, partner and events.Showcasing this set of slides titled Marketing Strategies Budgetary Trends Infographics PDF. The topics addressed in these templates are Owned Digital, Partner Affiliate, Earned Digital. All the content presented in this PPT design is completely editable. Download it and make adjustments in color, background, font etc. as per your unique business setting.

Financial Efficiency Snapshot For 2022 One Pager Documents
This slide shows the financial efficiency snapshot regarding the sources of income and expenditure in fiscal year 2022. Presenting you an exemplary Financial Efficiency Snapshot For 2022 One Pager Documents. Our one-pager comprises all the must-have essentials of an inclusive document. You can edit it with ease, as its layout is completely editable. With such freedom, you can tweak its design and other elements to your requirements. Download this Financial Efficiency Snapshot For 2022 One Pager Documents brilliant piece now.

Key Financial Ratios Ppt PowerPoint Presentation Guidelines
This is a key financial ratios ppt powerpoint presentation guidelines. This is a four stage process. The stages in this process are current ratio, debt to equity ratio, ratio, return, return on assets.

Challenges Of Intrinsic Valuation For Startup Ppt Portfolio Styles PDF
This slide shows the challenges of intrinsic valuation for startup company which includes existing asset valuation, emerging asset valuation, identifying discounted rates, etc. This is a challenges of intrinsic valuation for startup ppt portfolio styles pdf template with various stages. Focus and dispense information on three stages using this creative set, that comes with editable features. It contains large content boxes to add your information on topics like financial statements, growth in revenues, market data. You can also showcase facts, figures, and other relevant content using this PPT layout. Grab it now.
Omnichannel Services Solution In Financial Sector Attributes Of Digital Wallets Application Summary PDF
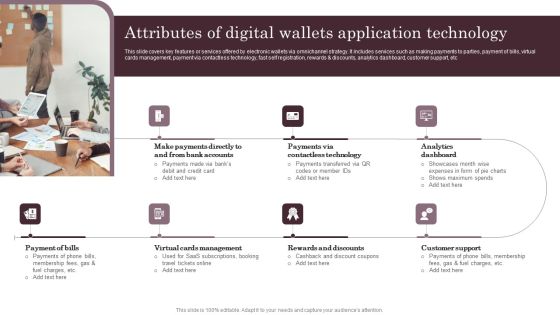
This slide covers key features or services offered by electronic wallets via omnichannel strategy. It includes services such as making payments to parties, payment of bills, virtual cards management, payment via contactless technology, fast self registration, rewards and discounts, analytics dashboard, customer support, etc. Present like a pro with Omnichannel Services Solution In Financial Sector Attributes Of Digital Wallets Application Summary PDF Create beautiful presentations together with your team, using our easy to use presentation slides. Share your ideas in real time and make changes on the fly by downloading our templates. So whether you are in the office, on the go, or in a remote location, you can stay in sync with your team and present your ideas with confidence. With Slidegeeks presentation got a whole lot easier. Grab these presentations today.
Key Financial Ratios Ppt PowerPoint Presentation Model Elements
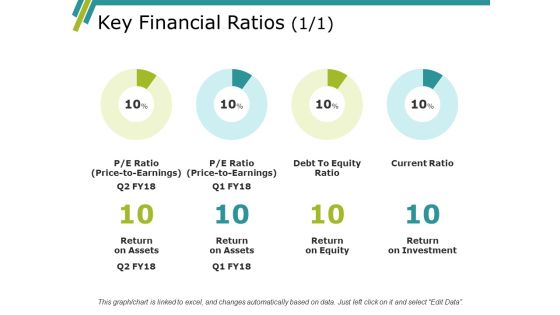
This is a key financial ratios ppt powerpoint presentation model elements. This is a four stage process. The stages in this process are return on assets, return on equity, return on investment.

Key Financial Ratios Ppt PowerPoint Presentation Portfolio Summary
This is a key financial ratios ppt powerpoint presentation portfolio summary. This is a eight stage process. The stages in this process are return on assets, return on equity, return on investment, debt equity ratio, current ratio.

Financial Snapshot Ppt PowerPoint Presentation Backgrounds
This is a financial snapshot ppt powerpoint presentation backgrounds. This is a six stage process. The stages in this process are icons, strategy, percentage, finance, business.

Money Investment Strategy Ppt PowerPoint Presentation Summary Example Topics Cpb
This is a money investment strategy ppt powerpoint presentation summary example topics cpb. This is a five stage process. The stages in this process are money investment strategy.
Projected Key Financials Template Ppt PowerPoint Presentation Styles Graphics Design
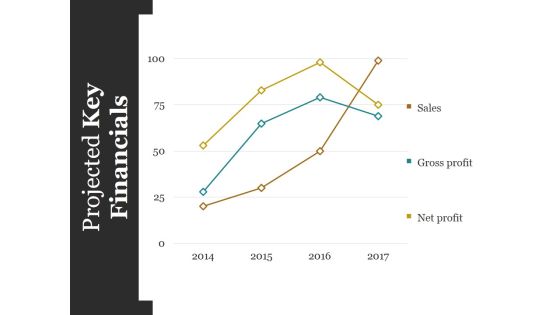
This is a projected key financials template ppt powerpoint presentation styles graphics design. This is a four stage process. The stages in this process are sales, gross profit, net profit.

Deploying And Managing Recurring Our Financial Performance Over The Year Infographics PDF
The purpose of the following slide is to analyze the financial performance of the organization. The provided graph highlight the revenues, Gross profit and net profit margin of the organization for the year 2016,17,18 and 19. If you are looking for a format to display your unique thoughts, then the professionally designed Deploying And Managing Recurring Our Financial Performance Over The Year Infographics PDF is the one for you. You can use it as a Google Slides template or a PowerPoint template. Incorporate impressive visuals, symbols, images, and other charts. Modify or reorganize the text boxes as you desire. Experiment with shade schemes and font pairings. Alter, share or cooperate with other people on your work. Download Deploying And Managing Recurring Our Financial Performance Over The Year Infographics PDF and find out how to give a successful presentation. Present a perfect display to your team and make your presentation unforgettable.
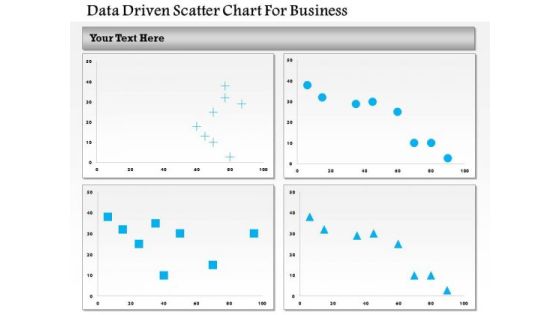
Business Diagram Data Driven Scatter Chart For Business PowerPoint Slide
This business diagram has been designed with four comparative charts. This slide suitable for data representation. You can also use this slide to present business analysis and reports. Use this diagram to present your views in a wonderful manner.
Key Financial Ratios Template 2 Ppt PowerPoint Presentation Icon Slide Download
This is a key financial ratios template 2 ppt powerpoint presentation icon slide download. This is a six stage process. The stages in this process are price to earnings, debt to equity ratio, current ratio, return on, equity, return on , assets, return on investment.
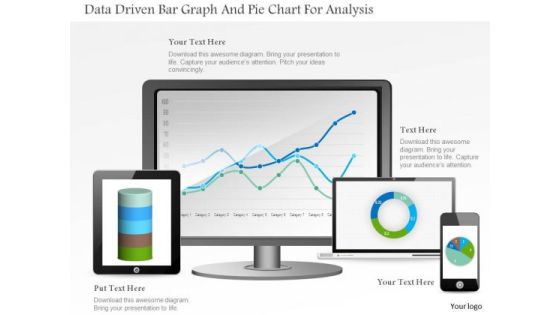
Business Diagram Data Driven Bar Graph And Pie Chart For Analysis PowerPoint Slide
This PowerPoint template displays technology gadgets with various business charts. Use this diagram slide, in your presentations to make business reports for statistical analysis. You may use this diagram to impart professional appearance to your presentations.

Business Diagram Colored Column Chart For Result Analysis PowerPoint Slide
This Power Point diagram has been designed with graphic of column chart. It contains diagram of bar char depicting annual business progress report. Use this diagram to build professional presentations for your viewers.

Organization Financial Performance Report Icon Mockup PDF
Persuade your audience using this Organization Financial Performance Report Icon Mockup PDF. This PPT design covers three stages, thus making it a great tool to use. It also caters to a variety of topics including Organization Financial, Performance Report Icon. Download this PPT design now to present a convincing pitch that not only emphasizes the topic but also showcases your presentation skills.

Business Diagram Two Tablets With Growth Bar Graph Data Driven PowerPoint Slide
This business diagram has been designed with comparative charts on tablets. This slide suitable for data representation. You can also use this slide to present business reports and information. Use this diagram to present your views in a wonderful manner.
Financial Analysis Vector Icon Ppt PowerPoint Presentation Summary Structure PDF
Presenting this set of slides with name financial analysis vector icon ppt powerpoint presentation summary structure pdf. This is a three stage process. The stages in this process are financial analysis vector icon. This is a completely editable PowerPoint presentation and is available for immediate download. Download now and impress your audience.

Businessman Preparing Statistical Data Report Of Financial Data Brochure PDF
Presenting businessman preparing statistical data report of financial data brochure pdf to dispense important information. This template comprises four stages. It also presents valuable insights into the topics including businessman preparing statistical data report of financial data. This is a completely customizable PowerPoint theme that can be put to use immediately. So, download it and address the topic impactfully.
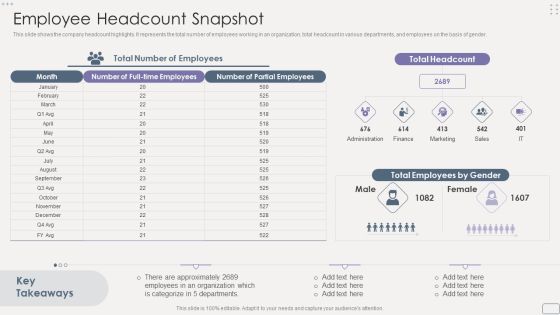
Income Assessment Report Employee Headcount Snapshot Slides PDF
This slide shows the company headcount highlights. It represents the total number of employees working in an organization, total headcount in various departments, and employees on the basis of gender.Deliver an awe inspiring pitch with this creative Income Assessment Report Employee Headcount Snapshot Slides PDF bundle. Topics like Employees Organization, Categorize Departments, Total Employees can be discussed with this completely editable template. It is available for immediate download depending on the needs and requirements of the user.

Income Assessment Document Employee Headcount Snapshot Mockup PDF
This slide shows the company headcount highlights. It represents the total number of employees working in an organization, total headcount in various departments, and employees on the basis of gender. Deliver and pitch your topic in the best possible manner with this Income Assessment Document Employee Headcount Snapshot Mockup PDF. Use them to share invaluable insights on Total Headcount, Total Employees Gender, Marketing and impress your audience. This template can be altered and modified as per your expectations. So, grab it now.

Identifying Key Business And It Drivers Ppt PowerPoint Presentation Ideas Files
This is a identifying key business and it drivers ppt powerpoint presentation ideas files. This is a three stage process. The stages in this process are increase sales and shares, improve profit, manage risks, business, management.
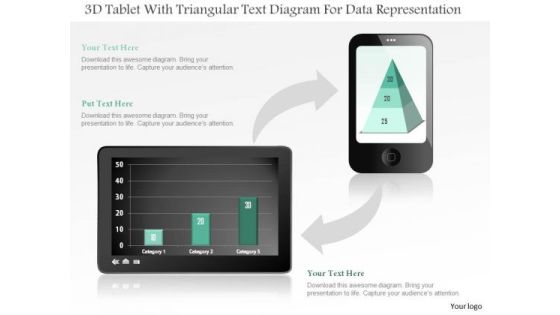
Business Diagram 3d Tablet With Triangular Text Diagram For Data Representation PowerPoint Slide
This business diagram displays bar graph on tablet and pyramid chart on mobile phone. Use this diagram, to make reports for interactive business presentations. Create professional presentations using this diagram.

Key Evaluation Metrics Ppt Slides
This is a key evaluation metrics ppt slides. This is a five stage process. The stages in this process are business, finance, marketing, symbol.

Business Diagram Tablet With Pie And Business Bar Graph For Result Analysis PowerPoint Slide
This PowerPoint template displays technology gadgets with various business charts. Use this diagram slide, in your presentations to make business reports for statistical analysis. You may use this diagram to impart professional appearance to your presentations.

Business Overview PPT Slides Financial Snapshot Ppt Background PDF
Presenting business overview ppt slides financial snapshot ppt background pdf to provide visual cues and insights. Share and navigate important information on three stages that need your due attention. This template can be used to pitch topics like sales, operating income, net income. In addtion, this PPT design contains high resolution images, graphics, etc, that are easily editable and available for immediate download.

Milestones For The Next Reporting Period Template Ppt PowerPoint Presentation Background Images
This is a milestones for the next reporting period template ppt powerpoint presentation background images. This is a six stage process. The stages in this process are jan, feb, mar, apr, may, jun.

Data Analysis Template Driven Stock Chart For Market Trends PowerPoint Slides Templates
Drive Your Team Along The Road To Success. Take The Wheel With Our data analysis template driven stock chart for market trends powerpoint slides Templates .

Examples Of Data Analysis Market 3d Business Trend Series Chart PowerPoint Templates
Duct It Through With Our examples of data analysis market 3d business trend series chart Powerpoint Templates . Your Ideas Will Reach Into Their Minds Intact.

Business Data Insights Report Icon Download PDF
Showcasing this set of slides titled Business Data Insights Report Icon Download PDF. The topics addressed in these templates are Business, Data Insights, Report. All the content presented in this PPT design is completely editable. Download it and make adjustments in color, background, font etc. as per your unique business setting.
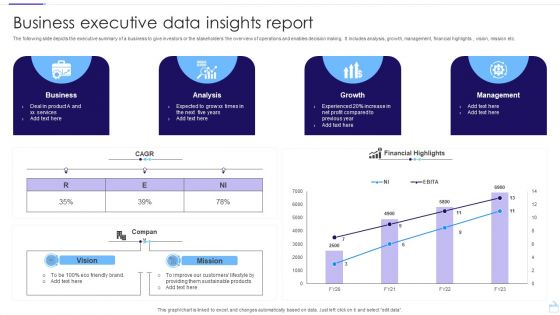
Business Executive Data Insights Report Pictures PDF
The following slide depicts the executive summary of a business to give investors or the stakeholders the overview of operations and enables decision making. It includes analysis, growth, management, financial highlights , vision, mission etc. Pitch your topic with ease and precision using this Business Executive Data Insights Report Pictures PDF. This layout presents information on Business, Analysis, Growth. It is also available for immediate download and adjustment. So, changes can be made in the color, design, graphics or any other component to create a unique layout.

Company Outline Financial Snapshot Ppt Styles Grid PDF
This is a company outline financial snapshot ppt styles grid pdf template with various stages. Focus and dispense information on three stages using this creative set, that comes with editable features. It contains large content boxes to add your information on topics like sales, operating income, net income. You can also showcase facts, figures, and other relevant content using this PPT layout. Grab it now.

Bar Graph For Marketing Research Data Powerpoint Slides
This PowerPoint template has been designed with diagram of bar graph. This PPT slide can be used to prepare presentations for profit growth report and also for financial data analysis. You can download finance PowerPoint template to prepare awesome presentations.

Data Analytics Ppt PowerPoint Presentation Graphics
This is a data analytics ppt powerpoint presentation graphics. This is a five stage process. The stages in this process are data analysis, business, marketing, success, graph.

Company Departments Expense Budgetary Trends Diagrams PDF
This slide showcase monthly comparison analysis of budget allocated to different departments in organization. It includes research, sales, HR, digital Marketing and finance. Pitch your topic with ease and precision using this Company Departments Expense Budgetary Trends Diagrams PDF. This layout presents information on Expense, Finance, Department. It is also available for immediate download and adjustment. So, changes can be made in the color, design, graphics or any other component to create a unique layout.
Financial Analysis Calculator With Dollar Symbol Vector Icon Ppt PowerPoint Presentation File Example Topics PDF
Presenting this set of slides with name financial analysis calculator with dollar symbol vector icon ppt powerpoint presentation file example topics pdf. This is a three stage process. The stages in this process are financial analysis calculator with dollar symbol vector icon. This is a completely editable PowerPoint presentation and is available for immediate download. Download now and impress your audience.

Data Analytics Ppt PowerPoint Presentation Themes
This is a data analytics ppt powerpoint presentation themes. This is a five stage process. The stages in this process are business, marketing, presentation, data analyst, management.

Key Financial Ratios Ppt PowerPoint Presentation Outline Slide
This is a key financial ratios ppt powerpoint presentation outline slide. This is a eight stage process. The stages in this process are return on assets, return on equity, return on investment, current ratio, debt equity ratio.

Cash Flow Management Order Control Ppt PowerPoint Presentation Design Ideas
This is a cash flow management order control ppt powerpoint presentation design ideas. This is a five stage process. The stages in this process are management, cash flow management, budget, financial analysis.
Icon Depicting Problem Administration In Financial Services Sample PDF
Presenting icon depicting problem administration in financial services sample pdf to dispense important information. This template comprises three stages. It also presents valuable insights into the topics including icon depicting problem administration in financial services. This is a completely customizable PowerPoint theme that can be put to use immediately. So, download it and address the topic impactfully.

Bar Chart With Magnifying Glass And Dollar Symbol For Financial Analysis Ppt PowerPoint Presentation File Structure PDF
Presenting this set of slides with name bar chart with magnifying glass and dollar symbol for financial analysis ppt powerpoint presentation file structure pdf. This is a one stage process. The stages in this process is bar chart with magnifying glass and dollar symbol for financial analysis. This is a completely editable PowerPoint presentation and is available for immediate download. Download now and impress your audience.

Data Analytics Management Paying Loads Of Money To Manage Big Data Guidelines PDF
This slide explains another challenge that is paying loads of money on hardware, new hires, software development, and its solution. Deliver and pitch your topic in the best possible manner with this Data Analytics Management Paying Loads Of Money To Manage Big Data Guidelines PDF. Use them to share invaluable insights on Software Development, Software Configuration, Software Maintenance and impress your audience. This template can be altered and modified as per your expectations. So, grab it now.

Financial Solutions Company Profile Snapshot Of Subsidiary Companies Graphics PDF
The slide highlights the snapshot of subsidiaries companies showcasing company name, incorporation year, company shareholding, market capitalization, total assets and CSR spending Deliver and pitch your topic in the best possible manner with this Financial Solutions Company Profile Snapshot Of Subsidiary Companies Graphics PDF Use them to share invaluable insights on Financial Banking, Financial Securities, Asset Management and impress your audience. This template can be altered and modified as per your expectations. So, grab it now.

Business Research And Analysis Ppt PowerPoint Presentation Ideas Graphics Design
This is a business research and analysis ppt powerpoint presentation ideas graphics design. This is a three stage process. The stages in this process are support, assistance, hand holding.

Web Marketing Analysis Diagram Ppt Slides Design
This is a web marketing analysis diagram ppt slides design. This is a five stage process. The stages in this process are communication, global reach, growth, business plan, financial.
 Home
Home