Revenue Dashboard
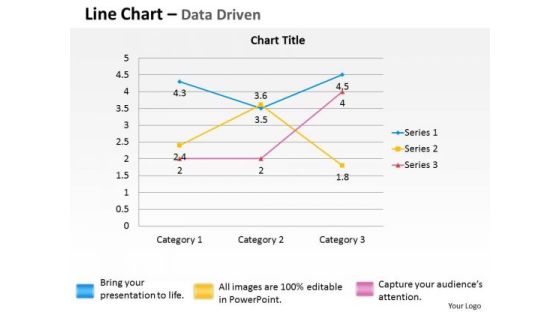
Quantitative Data Analysis Driven Economic Line Chart PowerPoint Slides Templates
Break The Deadlock With Our quantitative data analysis driven economic line chart powerpoint slides Templates . Let The Words Start To Flow.

Marketers Guide To Data Analysis Optimization Case Study Improving Teams Performance Using Marketing Professional PDF
This slide covers a case study of a company that improved various business teams performance by utilizing marketing analytics. The issues solved are developing proprietary insights engines, reporting weekly advertising spends, timely reporting, and stopping marketing APIs. Make sure to capture your audiences attention in your business displays with our gratis customizable Marketers Guide To Data Analysis Optimization Case Study Improving Teams Performance Using Marketing Professional PDF. These are great for business strategies, office conferences, capital raising or task suggestions. If you desire to acquire more customers for your tech business and ensure they stay satisfied, create your own sales presentation with these plain slides.

Data Analytics Ppt PowerPoint Presentation Guide
This is a data analytics ppt powerpoint presentation guide. This is a five stage process. The stages in this process are data analysis, business, marketing, success, graph.

Quantitative Data Analysis Bar Chart For Financial Markets PowerPoint Templates
Draft It Out On Our quantitative data analysis bar chart for financial markets Powerpoint Templates . Give The Final Touches With Your Ideas.
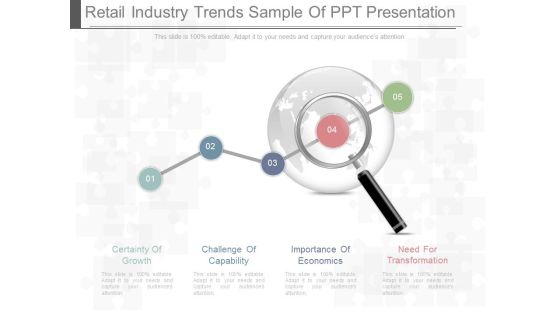
Retail Industry Trends Sample Of Ppt Presentation
This is a retail industry trends sample of ppt presentation. This is a five stage process. The stages in this process are certainty of growth, challenge of capability, importance of economics, need for transformation.
Magnifying Glass Ppt PowerPoint Presentation Designs Download
This is a magnifying glass ppt powerpoint presentation designs download. This is a two stage process. The stages in this process are magnifying glass, business, marketing, finance, management.

Magnifier Glass Ppt PowerPoint Presentation Inspiration Example
This is a magnifier glass ppt powerpoint presentation inspiration example. This is a four stage process. The stages in this process are magnifying glass, business, marketing, management, planning.

Data Analysis In Excel Column Chart For Business Analytics PowerPoint Templates
Our data analysis in excel column chart for business analytics Powerpoint Templates Heighten Concentration. Your Audience Will Be On The Edge.
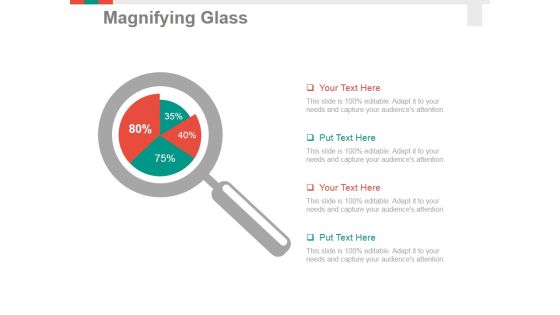
Magnifying Glass Ppt PowerPoint Presentation Pictures Graphics Design
This is a magnifying glass ppt powerpoint presentation pictures graphics design. This is a four stage process. The stages in this process are magnifier, search, marketing, analysis, business.

Fiscal Planning Template Powerpoint Slides Templates
This is a fiscal planning template powerpoint slides templates. This is a six stage process. The stages in this process are evaluation, implementation, develop a plan, receive regular data report, responsibility accounting, steps in fiscal planning.
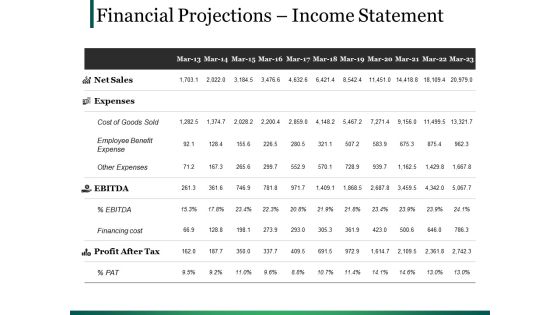
Financial Projections Income Statement Ppt PowerPoint Presentation Model Format
This is a financial projections income statement ppt powerpoint presentation model format. This is a two stage process. The stages in this process are tables, marketing, planning, strategy, finance.
Upward Profit Growth Arrow Graph Vector Icon Ppt PowerPoint Presentation Styles Templates
Presenting this set of slides with name upward profit growth arrow graph vector icon ppt powerpoint presentation styles templates. This is a one stage process. The stages in this process are data visualization icon, research analysis, business focus. This is a completely editable PowerPoint presentation and is available for immediate download. Download now and impress your audience.

Arrow Infographics For Financial Data Analysis Powerpoint Template
This PowerPoint slide contains diagram of arrows infographic. This professional slide helps to exhibit financial data analysis for business growth. Use this PowerPoint template to make impressive presentations.
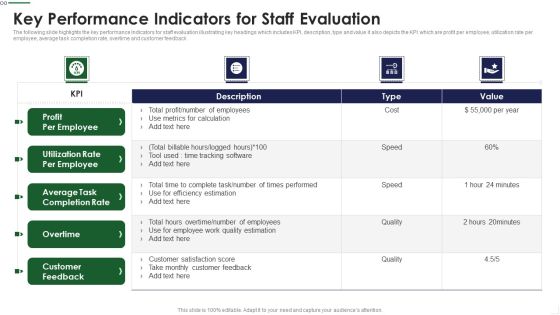
Key Performance Indicators For Staff Evaluation Infographics PDF
The following slide highlights the key performance Indicators for staff evaluation illustrating key headings which includes KPI, description, type and value it also depicts the KPI which are profit per employee, utilization rate per employee, average task completion rate, overtime and customer feedback Showcasing this set of slides titled Key Performance Indicators For Staff Evaluation Infographics PDF The topics addressed in these templates are Metrics Calculation, Times Performed, Customer Satisfaction All the content presented in this PPT design is completely editable. Download it and make adjustments in color, background, font etc. as per your unique business setting.

Big Data Analytics Procedure For Management Accounting Formats PDF
This slide illustrate big data analysis process for management accounting to generate financial reports for decision making. It includes elements such as cost accounting balance scorecards, performance measurement etc. Showcasing this set of slides titled Big Data Analytics Procedure For Management Accounting Formats PDF. The topics addressed in these templates are Accounting, Internal Data, Social Media. All the content presented in this PPT design is completely editable. Download it and make adjustments in color, background, font etc. as per your unique business setting.

Pandl Kpis Ppt PowerPoint Presentation Gallery Display
This is a pandl kpis ppt powerpoint presentation gallery display. This is a four stage process. The stages in this process are net sales, total income, expenses, ebitda, profit after tax.

10 Designs To An Amazing Pitch Example Of Ppt
This is a 10 designs to an amazing pitch example of ppt. This is a ten stage process. The stages in this process are business model, money, market size, the solution, team, marketing plan, competition, elevator pitch, proprietary tech, the problem.

Business Tactical And Strategic Analysis For Profitability Growth Icon Pictures PDF
Presenting Business Tactical And Strategic Analysis For Profitability Growth Icon Pictures PDF to dispense important information. This template comprises three stages. It also presents valuable insights into the topics including Business Tactical, Analysis, Profitability Growth, Icon. This is a completely customizable PowerPoint theme that can be put to use immediately. So, download it and address the topic impactfully.

Vendor Selection And Evaluation Techniques Magnifying Glass Ppt Summary Example Topics PDF
Make sure to capture your audiences attention in your business displays with our gratis customizable Vendor Selection And Evaluation Techniques Magnifying Glass Ppt Summary Example Topics PDF. These are great for business strategies, office conferences, capital raising or task suggestions. If you desire to acquire more customers for your tech business and ensure they stay satisfied, create your own sales presentation with these plain slides.

Conducting Monetary Inclusion With Mobile Financial Services Why We Need Rules PDF
Presenting Conducting Monetary Inclusion With Mobile Financial Services Why We Need Rules PDF to provide visual cues and insights. Share and navigate important information on one stage that need your due attention. This template can be used to pitch topics like Highly Adaptable, Increase Retention, Reduce Churn. In addtion, this PPT design contains high resolution images, graphics, etc, that are easily editable and available for immediate download.

Comprehensive Analysis Of Different Data Lineage Classification Typical Use Cases Of Data Lineage Themes PDF
This slide outlines the typical use cases of data lineage that include performing root cause analysis, generating reports, deprecating columns, and setting data retention policies. Data lineage enables a broad range of information use applications for IT departments and various stakeholder groups. Make sure to capture your audiences attention in your business displays with our gratis customizable Comprehensive Analysis Of Different Data Lineage Classification Typical Use Cases Of Data Lineage Themes PDF. These are great for business strategies, office conferences, capital raising or task suggestions. If you desire to acquire more customers for your tech business and ensure they stay satisfied, create your own sales presentation with these plain slides.

Financial Tactical And Strategic Analysis Planning Icon Ideas PDF
Persuade your audience using this Financial Tactical And Strategic Analysis Planning Icon Ideas PDF. This PPT design covers three stages, thus making it a great tool to use. It also caters to a variety of topics including Financial Analysis, Tactical Planning, Icon. Download this PPT design now to present a convincing pitch that not only emphasizes the topic but also showcases your presentation skills.
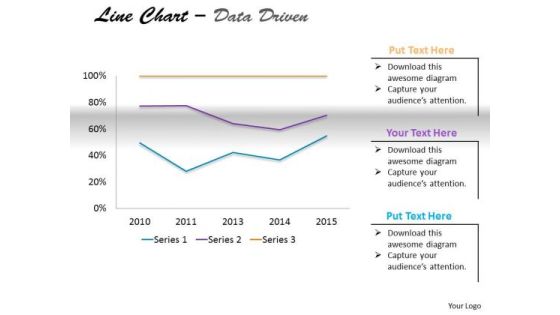
Multivariate Data Analysis Driven Market Line Chart PowerPoint Slides Templates
Delight Them With Our multivariate data analysis driven market line chart powerpoint slides Templates .

Traditional Financial Budgeting And Assessment Kpis For Businesses Infographics PDF
This slide represents the key performance indicators set by the financial planning and analysis team for their business. The indicators includes working capital, operating cash flow, return on equity, current ratio, accounts receivable and payable turnover. Presenting Traditional Financial Budgeting And Assessment Kpis For Businesses Infographics PDF to dispense important information. This template comprises six stages. It also presents valuable insights into the topics including Working Capital, Operating Cash Flow, Current Ratio. This is a completely customizable PowerPoint theme that can be put to use immediately. So, download it and address the topic impactfully.
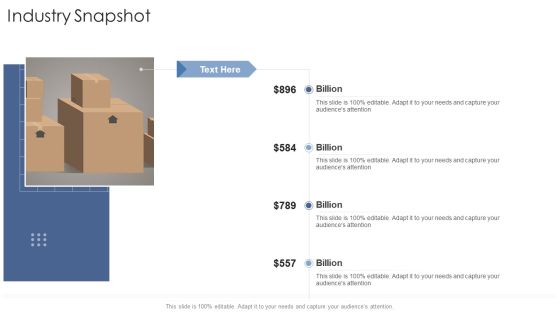
Industry Snapshot Billion Startup Business Strategy Ppt Pictures Images PDF
Presenting industry snapshot billion startup business strategy ppt pictures images pdf to provide visual cues and insights. Share and navigate important information on four stages that need your due attention. This template can be used to pitch topics like industry snapshot. In addtion, this PPT design contains high resolution images, graphics, etc, that are easily editable and available for immediate download.
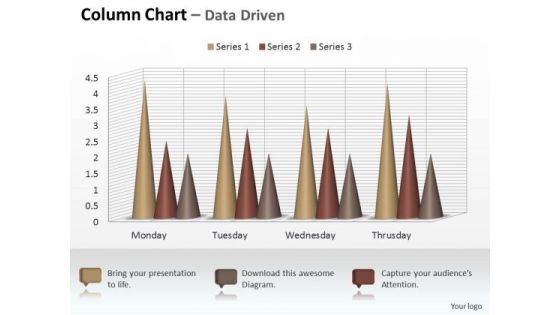
Marketing Data Analysis 3d Sets Of Column Chart PowerPoint Templates
Your Listeners Will Never Doodle. Our marketing data analysis 3d sets of column chart Powerpoint Templates Will Hold Their Concentration.
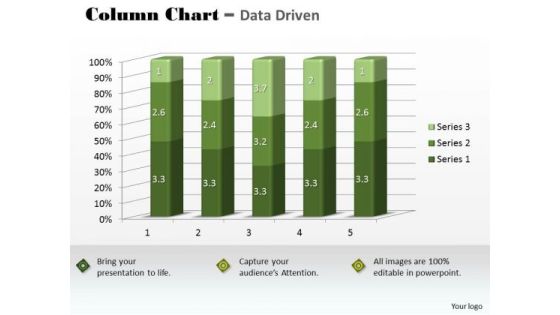
Marketing Data Analysis 3d Statistical Quality Control Chart PowerPoint Templates
Our marketing data analysis 3d statistical quality control chart Powerpoint Templates Abhor Doodling. They Never Let The Interest Flag.

Real Estate Market Snapshot Ppt PowerPoint Presentation Outline Visuals
This is a real estate market snapshot ppt powerpoint presentation outline visuals. This is a two stage process. The stages in this process are homes sold, average home price, january.

Data Analysis Template Forex Market Bar Chart PowerPoint Templates
Attract A Crowd With Our data analysis template forex market bar chart Powerpoint Templates . They Will Drop It All And Come To Hear You.

Examples Of Data Analysis Market 3d Categories Sets PowerPoint Templates
Our examples of data analysis market 3d categories sets Powerpoint Templates Give Your Thoughts Their Due. They Project Them With Full Intensity.
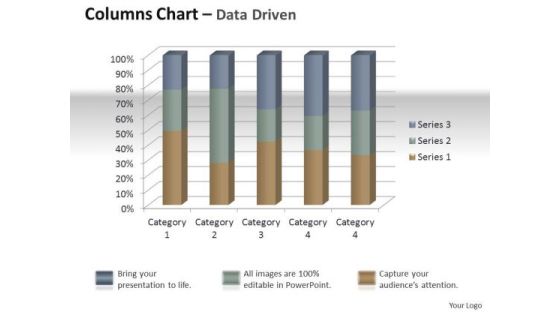
Marketing Data Analysis 3d Quality Control Of Units PowerPoint Templates
Establish Your Dominion With Our marketing data analysis 3d quality control of units Powerpoint Templates . Rule The Stage With Your Thoughts.
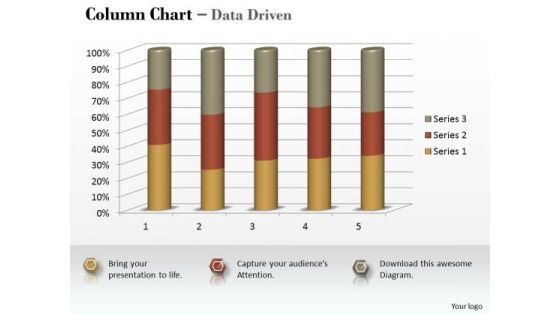
Marketing Data Analysis 3d Statistical Process Column Chart PowerPoint Templates
Be A Donor Of Great Ideas. Display Your Charity On Our marketing data analysis 3d statistical process column chart Powerpoint Templates .

Marketing Data Analysis 3d Statistical Process Control Chart PowerPoint Templates
Open Up Doors That Lead To Success. Our marketing data analysis 3d statistical process control chart Powerpoint Templates Provide The Handles.
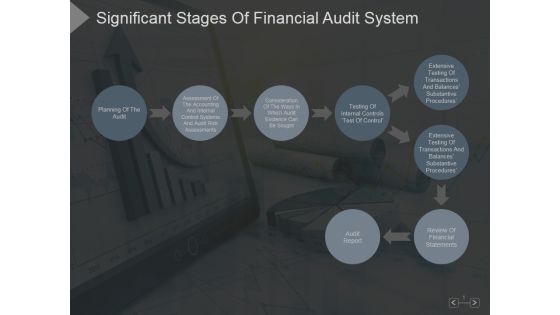
Significant Stages Of Financial Audit System Ppt PowerPoint Presentation Backgrounds
This is a significant stages of financial audit system ppt powerpoint presentation backgrounds. This is a eight stage process. The stages in this process are planning of the audit, audit report, review of financial statements, testing of internal controls.
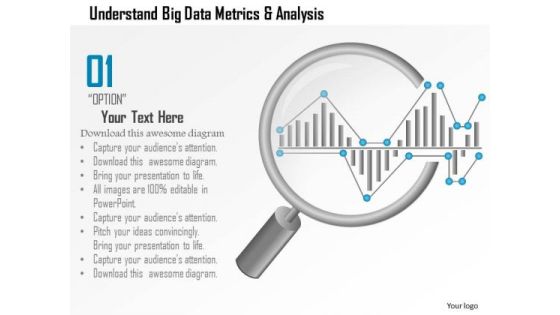
Business Diagram Understand Big Data Metrics And Analysis Showing By Magnifying Glass Ppt Slide
This PPT slide has been designed with big data metrics and magnifying glass. This diagram helps to portray concept of data analysis and data search. Download this diagram to make professional presentations.
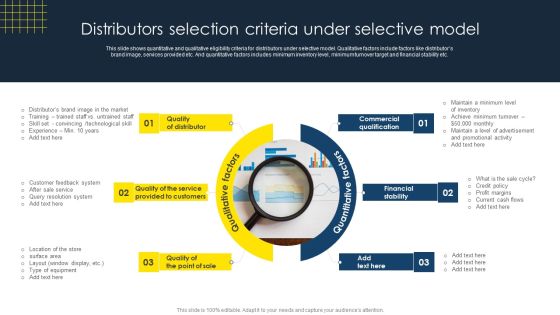
Optimize Business Sales Distributors Selection Criteria Under Selective Model Structure PDF
This slide shows quantitative and qualitative eligibility criteria for distributors under selective model. Qualitative factors include factors like distributors brand image, services provided etc. And quantitative factors includes minimum inventory level, minimum turnover target and financial stability etc. This Optimize Business Sales Distributors Selection Criteria Under Selective Model Structure PDF from Slidegeeks makes it easy to present information on your topic with precision. It provides customization options, so you can make changes to the colors, design, graphics, or any other component to create a unique layout. It is also available for immediate download, so you can begin using it right away. Slidegeeks has done good research to ensure that you have everything you need to make your presentation stand out. Make a name out there for a brilliant performance.

Monthly Financial Planning And Budgeting Process Ppt PowerPoint Presentation Visuals
This is a monthly financial planning and budgeting process ppt powerpoint presentation visuals. This is a six stage process. The stages in this process are growth, finance, development, financial development, economic growth, data analysis.

Banking Solutions Company Overview Snapshot Of Subsidiary Companies Portrait PDF
The slide highlights the snapshot of subsidiaries companies showcasing company name, incorporation year, company shareholding, market capitalization, total assets and CSR spending. Deliver and pitch your topic in the best possible manner with this Banking Solutions Company Overview Snapshot Of Subsidiary Companies Portrait PDF. Use them to share invaluable insights on Abc Financial Securities, Abc International Banking, Abc Life Insurance and impress your audience. This template can be altered and modified as per your expectations. So, grab it now.
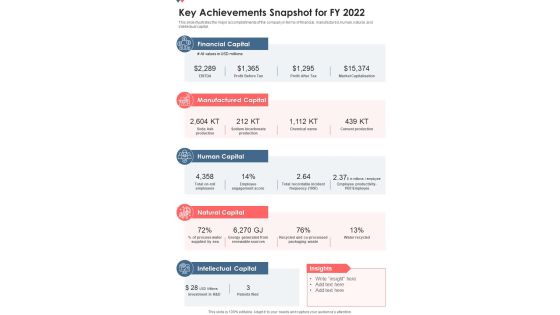
Key Achievements Snapshot For FY 2022 One Pager Documents
This slide illustrates the major accomplishments of the company in terms of financial, manufactured, human, natural, and intellectual capital. Presenting you a fantastic Key Achievements Snapshot For FY 2022 One Pager Documents. This piece is crafted on hours of research and professional design efforts to ensure you have the best resource. It is completely editable and its design allow you to rehash its elements to suit your needs. Get this Key Achievements Snapshot For FY 2022 One Pager Documents A4 One-pager now.
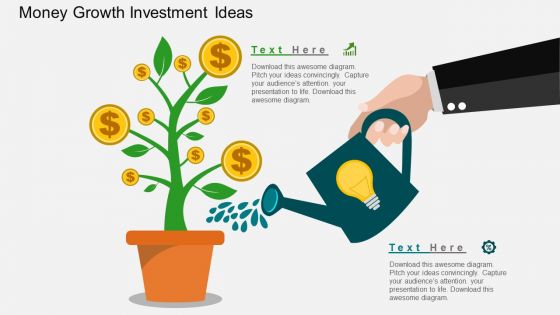
Money Growth Investment Ideas PowerPoint Template
Above is the creatively designed PPT slide which you can use to explain that how the idea of investment can lead to the money growth. This template also help you explain to your colleagues that how different ideas if put together can lead to the betterment of the company or the growth of the company. There are icons present in the template as well which are easily editable. You can choose the color, text and icon of your choice as per your requirement. Use this slide in your presentation and leave great impression on your audience.

Illustration Of Save Money Concept Powerpoint Templates
This business slide has been designed with infographic square. These text boxes can be used for data representation. Use this diagram for your business presentations. Build a quality presentation for your viewers with this unique diagram.

Key Steps In Financial Planning Process Ppt Slide Show
This is a key steps in financial planning process ppt slide show. This is a six stage process. The stages in this process are review and report, implement the plan, create and present solution in a plan, define the relationship, gather data and agree goals, analysis and evaluation, the financial planning process.

Financial Data Analysis Driven Compare Market Share Of Brand PowerPoint Templates
Doll Up Your Thoughts With Our financial data analysis driven compare market share of brand Powerpoint Templates . They Will Make A Pretty Picture.

Financial Data Analysis For Risk Management Ppt PowerPoint Presentation Slides Picture
Presenting this set of slides with name financial data analysis for risk management ppt powerpoint presentation slides picture. This is a one stage process. The stages in this process are risk framework, risk management, planning process. This is a completely editable PowerPoint presentation and is available for immediate download. Download now and impress your audience.
Key Financial Ratios Template 2 Ppt PowerPoint Presentation Icon Professional
This is a key financial ratios template 2 ppt powerpoint presentation icon professional. This is a four stage process. The stages in this process are business, marketing, analysis, finance, search.

Quantitative Data Analysis Driven Economic Status Line Chart PowerPoint Slides Templates
Be The Dramatist With Our quantitative data analysis driven economic status line chart powerpoint slides Templates . Script Out The Play Of Words.

Quantitative Data Analysis Driven Economic With Column Chart PowerPoint Slides Templates
Add Some Dramatization To Your Thoughts. Our quantitative data analysis driven economic with column chart powerpoint slides Templates Make Useful Props.

Income Statement Kpis Ppt PowerPoint Presentation Styles Clipart Images
This is a income statement kpis ppt powerpoint presentation styles clipart images. This is a four stage process. The stages in this process are net sales, other income, total income, expenses, total material consumed.
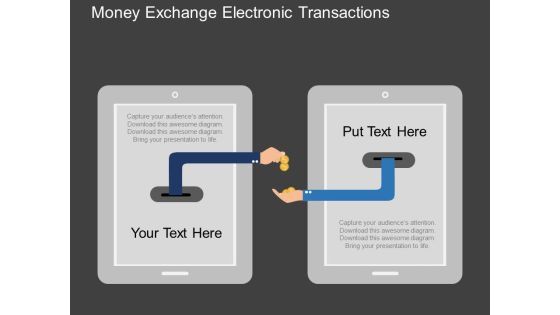
Money Exchange Electronic Transactions Powerpoint Templates
Our above slide contains illustration of money exchange. It helps to display electronic transactions. Use this diagram to impart more clarity to data and to create more sound impact on viewers.

Budgetary Trends Of Social Media Mobile And Analytics Infographics PDF
This slide shows companys share of marketing budget allocated. The areas covered in this are social media, mobile and analytics.Showcasing this set of slides titled Budgetary Trends Of Social Media Mobile And Analytics Infographics PDF. The topics addressed in these templates are Growth Budget, Changes Can, Analytics Budget. All the content presented in this PPT design is completely editable. Download it and make adjustments in color, background, font etc. as per your unique business setting.
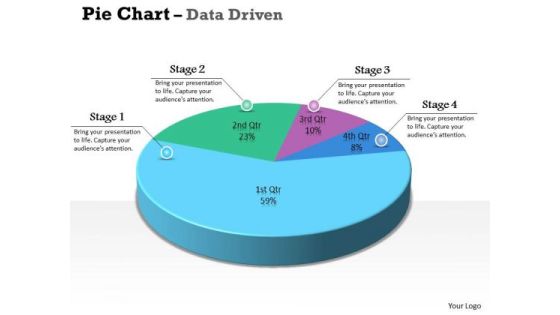
Data Analysis Excel 3d Pie Chart For Marketing Process PowerPoint Templates
Our data analysis excel 3d pie chart for marketing process Powerpoint Templates Team Are A Dogged Lot. They Keep At It Till They Get It Right.
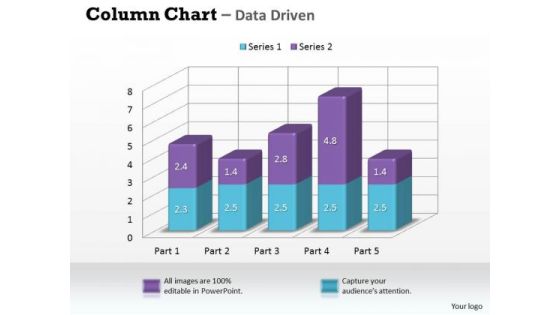
Data Analysis In Excel 3d Column Chart For Market Surveys PowerPoint Templates
Our data analysis in excel 3d column chart for market surveys Powerpoint Templates Leave No One In Doubt. Provide A Certainty To Your Views.

Data Analysis Programs 3d Bar Chart For Market Surveys PowerPoint Templates
Draw On The Experience Of Our data analysis programs 3d bar chart for market surveys Powerpoint Templates . They Imbibe From Past Masters.
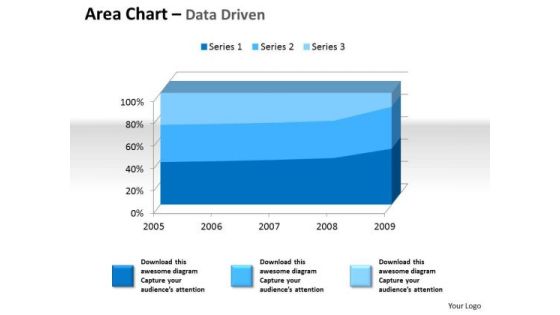
Examples Of Data Analysis Market 3d Area Chart For Quantiative PowerPoint Templates
Drum It Up With Our examples of data analysis market 3d area chart for quantiative Powerpoint Templates . Your Thoughts Will Raise The Tempo.
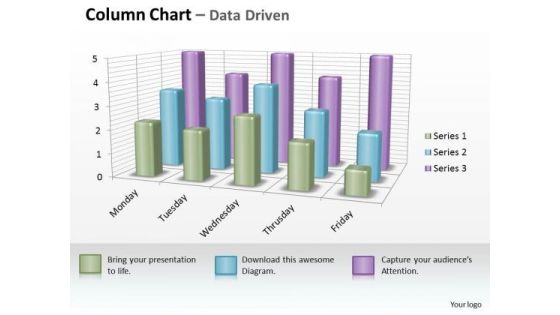
Examples Of Data Analysis Market 3d Business Inspection Procedure Chart PowerPoint Templates
However Dry Your Topic Maybe. Make It Catchy With Our examples of data analysis market 3d business inspection procedure chart Powerpoint Templates .

Examples Of Data Analysis Market 3d Business Intelligence And PowerPoint Templates
Our examples of data analysis market 3d business intelligence and Powerpoint Templates Are Dual Purpose. They Help Instruct And Inform At The Same Time.
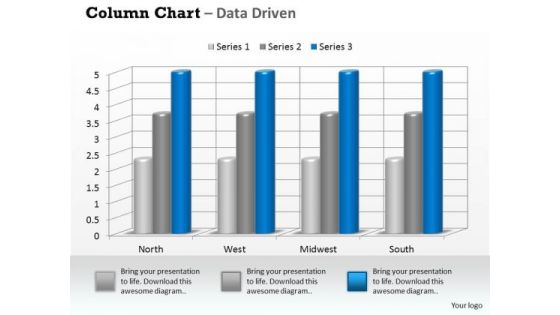
Examples Of Data Analysis Market 3d Business On Regular Intervals PowerPoint Templates
Drum It Out Loud And Clear On Our examples of data analysis market 3d business on regular intervals Powerpoint Templates . Your Words Will Ring In Their Ears.

Examples Of Data Analysis Market Driven Plotting The Business Values PowerPoint Slides Templates
Ring The Duck With Our examples of data analysis market driven plotting the business values powerpoint slides Templates . Acquire The Points With Your Ideas.

Examples Of Data Analysis Market Driven Radar Chart To Compare PowerPoint Slides Templates
Rely On Our examples of data analysis market driven radar chart to compare powerpoint slides Templates In Any Duel. They Will Drive Home Your Point.
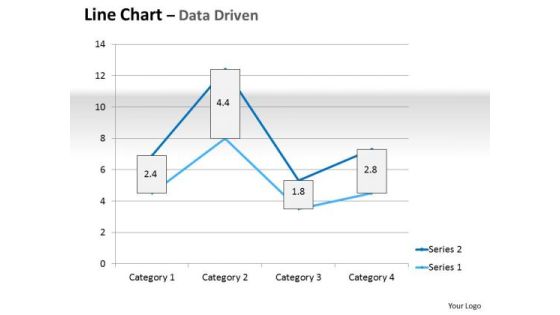
Multivariate Data Analysis Driven Line Chart Market Graph PowerPoint Slides Templates
Plan For All Contingencies With Our multivariate data analysis driven line chart market graph powerpoint slides Templates . Douse The Fire Before It Catches.
 Home
Home