Project Snapshot

Playbook For Managing Information Overall IT Cost Management Dashboard Inspiration PDF
This slide provides information regarding IT cost management dashboard to track IT costs breakdown, return on investment, budget monitoring, etc. Deliver an awe inspiring pitch with this creative Playbook For Managing Information Overall IT Cost Management Dashboard Inspiration PDF bundle. Topics like Return Investment, IT Department, Spend Vs Budget can be discussed with this completely editable template. It is available for immediate download depending on the needs and requirements of the user.

Data Analytics Management Big Data Management In Automobile Industry Template PDF
This slide explains the big data use cases in the automobile industry and how it would help automobile firms in supply chain management, connected cars, automobile financing, predictive analysis, and design and production.This is a Data Analytics Management Big Data Management In Automobile Industry Template PDF template with various stages. Focus and dispense information on five stages using this creative set, that comes with editable features. It contains large content boxes to add your information on topics like Chain Management, Connected Cars, Automobile Financing. You can also showcase facts, figures, and other relevant content using this PPT layout. Grab it now.
Stock Photo Business Marketing Strategy Speaker Makes Loud Voice Icons
Your Capabilities Will Come To The Fore. Our stock photo business marketing strategy speaker makes loud voice icons Give Them Extensive Coverage. Our communication Assist Accurate Forecasts. They Compel Fate To Go Your Way.

Stock Photo Business Model Strategy Keep Balance Your Life Best
Disregard Any Foreboding With Our stock photo business model strategy keep balance your life best. They Ensure A Bright Forecast. Our money Can Be Very Arousing. Develop On The Drive In Them To Excel.
Stock Photo Business Strategy Wrench For Loosening Nuts Clipart
Control the fall of the dice with our stock photo business strategy wrench for loosening nuts clipart. Your forecasts will come out correct. Our construction can control fate. The dice will fall as per your call.

Dashboard Illustrating Attrition Risk And Expenses Of Employee Attrition Clipart PDF
This slide represents a dashboard that help predict attrition risks and turnover costs incurred by companies. It includes various aspects such as current high risk employees, key prospects at high risk for leaving, cost of turnover, risk by country, etc. Pitch your topic with ease and precision using this Dashboard Illustrating Attrition Risk And Expenses Of Employee Attrition Clipart PDF. This layout presents information on Dashboard Illustrating Attrition Risk, Expenses Of Employee Attrition . It is also available for immediate download and adjustment. So, changes can be made in the color, design, graphics or any other component to create a unique layout.

Classification Of Big Data In Health Industry Microsoft PDF
The slide represents types of big data analytics in healthcare. The purpose of the slide is to explore different methods and approaches used in analyzing large volumes of healthcare data to improve patient care. It provide information about descriptive, predictive, prescriptive and discovery analytics. Presenting Classification Of Big Data In Health Industry Microsoft PDF to dispense important information. This template comprises four stages. It also presents valuable insights into the topics including Descriptive Analytics, Prescriptive Analytics, Predictive Analytics. This is a completely customizable PowerPoint theme that can be put to use immediately. So, download it and address the topic impactfully.
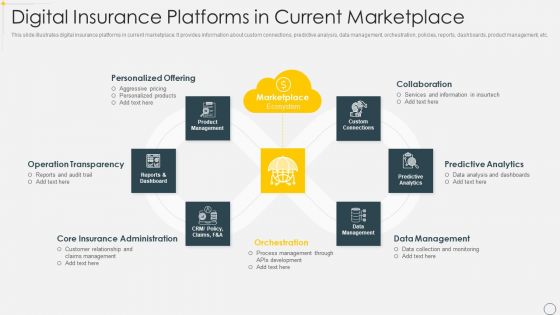
Digital Insurance Platforms In Current Marketplace Slides PDF
This slide illustrates digital insurance platforms in current marketplace. It provides information about custom connections, predictive analysis, data management, orchestration, policies, reports, dashboards, product management, etc. Persuade your audience using this Digital Insurance Platforms In Current Marketplace Slides PDF. This PPT design covers seven stages, thus making it a great tool to use. It also caters to a variety of topics including Operation Transparency, Personalized Offering, Data Management. Download this PPT design now to present a convincing pitch that not only emphasizes the topic but also showcases your presentation skills.

Cios Value Optimization Determine IT Department Cost Management Dashboard Microsoft PDF
This slide provides information regarding IT department cost management dashboard including KPIs such as return on investment of IT department, spend vs. budget, IT cost breakdown and IT costs vs. revenues. Deliver and pitch your topic in the best possible manner with this Cios Value Optimization Determine IT Department Cost Management Dashboard Microsoft PDF. Use them to share invaluable insights on IT Costs, Return Investment, IT Department and impress your audience. This template can be altered and modified as per your expectations. So, grab it now.

Automating Supply Chain Dashboard For Tracking Impact Of Procurement Process Automation Themes PDF
This slide covers the dashboard for analysing procurement performance after automation. It include KPIs such as on-time delivery, percentage of returns, compliance index percentage, procurement ROI, cost-saving, budget spent on training, etc. Deliver an awe inspiring pitch with this creative Automating Supply Chain Dashboard For Tracking Impact Of Procurement Process Automation Themes PDF bundle. Topics like Procurement ROI, Cost Saving, Perform Procurement can be discussed with this completely editable template. It is available for immediate download depending on the needs and requirements of the user.

Cios Methodologies To Improve IT Spending Determine It Department Cost Management Dashboard Diagrams PDF
This slide provides information regarding IT department cost management dashboard including KPIs such as return on investment of IT department, spend vs. budget, IT cost breakdown and IT costs vs. revenues. Deliver and pitch your topic in the best possible manner with this Cios Methodologies To Improve IT Spending Determine It Department Cost Management Dashboard Diagrams PDF Use them to share invaluable insights on Extent Organizational, Reprioritization Cancellation, Investment Required and impress your audience. This template can be altered and modified as per your expectations. So, grab it now.
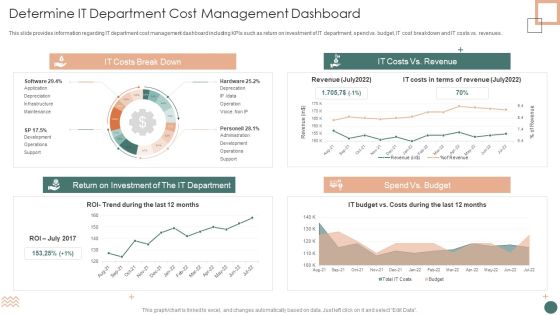
Improved Digital Expenditure Determine IT Department Cost Management Dashboard Introduction PDF
This slide provides information regarding IT department cost management dashboard including KPIs such as return on investment of IT department, spend vs. budget, IT cost breakdown and IT costs vs. revenues. Deliver and pitch your topic in the best possible manner with this Improved Digital Expenditure Determine IT Department Cost Management Dashboard Introduction PDF. Use them to share invaluable insights on Return Investment, Depreciation, Costs Break and impress your audience. This template can be altered and modified as per your expectations. So, grab it now.
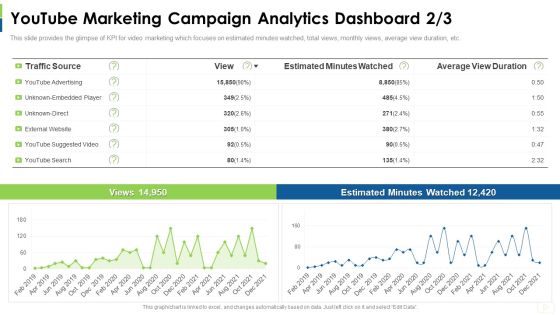
Social Platform As Profession Youtube Marketing Campaign Analytics Dashboard Direct Rules PDF
This slide provides the glimpse of KPI for video marketing which focuses on estimated minutes watched, total views, monthly views, average view duration, etc. Deliver and pitch your topic in the best possible manner with this social platform as profession youtube marketing campaign analytics dashboard direct rules pdf. Use them to share invaluable insights on youtube marketing campaign analytics dashboard and impress your audience. This template can be altered and modified as per your expectations. So, grab it now.
Sales Funnel Management For Revenue Generation Tracking Sales Pipeline And Lead Activity Dashboard Background PDF
This slide covers information regarding dashboard associated to tracking lead activity across sales pipeline. Deliver and pitch your topic in the best possible manner with this sales funnel management for revenue generation tracking sales pipeline and lead activity dashboard background pdf. Use them to share invaluable insights on team matterhorn, expansion opportunity, estimated value and impress your audience. This template can be altered and modified as per your expectations. So, grab it now.

Advances In Healthcare Management System Dashboard For Managing Patient Capacity And Beds Mockup PDF
This slide shows the dashboard for managing patient capacity and beds which includes occupancy, alerts, etc, with total number of available beds, discharges, admissions and estimated ones. Deliver an awe inspiring pitch with this creative Advances In Healthcare Management System Dashboard For Managing Patient Capacity And Beds Mockup PDF bundle. Topics like Cluster Occupancy, Best Out Of Service, Cluster Capacity can be discussed with this completely editable template. It is available for immediate download depending on the needs and requirements of the user.

Implementing Integrated Software Dashboard For Managing Patient Capacity And Beds Download PDF
This slide shows the dashboard for managing patient capacity and beds which includes occupancy, alerts, etc, with total number of available beds, discharges, admissions and estimated ones.Deliver and pitch your topic in the best possible manner with this Implementing Integrated Software Dashboard For Managing Patient Capacity And Beds Download PDF. Use them to share invaluable insights on Alternate Location, Cluster Occupancy, Cluster Capacity and impress your audience. This template can be altered and modified as per your expectations. So, grab it now.
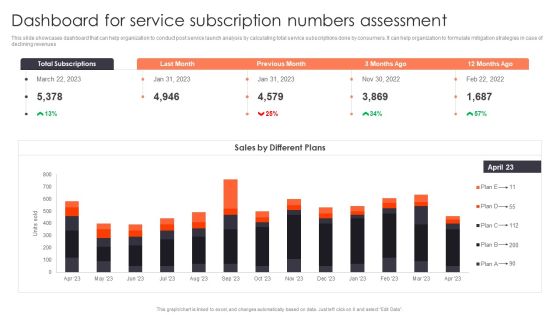
Promotion Strategies For New Service Launch Dashboard For Service Subscription Numbers Assessment Slides PDF
This slide showcases dashboard that can help organization to conduct post service launch analysis by calculating total service subscriptions done by consumers. It can help organization to formulate mitigation strategies in case of declining revenues. Presenting this PowerPoint presentation, titled Promotion Strategies For New Service Launch Dashboard For Service Subscription Numbers Assessment Slides PDF, with topics curated by our researchers after extensive research. This editable presentation is available for immediate download and provides attractive features when used. Download now and captivate your audience. Presenting this Promotion Strategies For New Service Launch Dashboard For Service Subscription Numbers Assessment Slides PDF. Our researchers have carefully researched and created these slides with all aspects taken into consideration. This is a completely customizable Promotion Strategies For New Service Launch Dashboard For Service Subscription Numbers Assessment Slides PDF that is available for immediate downloading. Download now and make an impact on your audience. Highlight the attractive features available with our PPTs.

Timeline Guide To Asset Cost Estimation Topics PDF
The Timeline Guide To Asset Cost Estimation Topics PDF is a compilation of the most recent design trends as a series of slides. It is suitable for any subject or industry presentation, containing attractive visuals and photo spots for businesses to clearly express their messages. This template contains a variety of slides for the user to input data, such as structures to contrast two elements, bullet points, and slides for written information. Slidegeeks is prepared to create an impression.

Timeline Guide To Develop And Estimate Brand Value Brochure PDF
The Timeline Guide To Develop And Estimate Brand Value Brochure PDF is a compilation of the most recent design trends as a series of slides. It is suitable for any subject or industry presentation, containing attractive visuals and photo spots for businesses to clearly express their messages. This template contains a variety of slides for the user to input data, such as structures to contrast two elements, bullet points, and slides for written information. Slidegeeks is prepared to create an impression.

Business Intelligence And Big Transformation Toolkit Data Analytics Value Stream Chain Guidelines PDF
This slide illustrates the series of activities required for analyzing the data. It contains information such as data preparation, exploratory analysis, and predictive analytics etc. This is a business intelligence and big transformation toolkit data analytics value stream chain guidelines pdf template with various stages. Focus and dispense information on six stages using this creative set, that comes with editable features. It contains large content boxes to add your information on topics like data preparation, exploratory data analysis, data visualization, classification and clustering, predictive analytics. You can also showcase facts, figures, and other relevant content using this PPT layout. Grab it now.
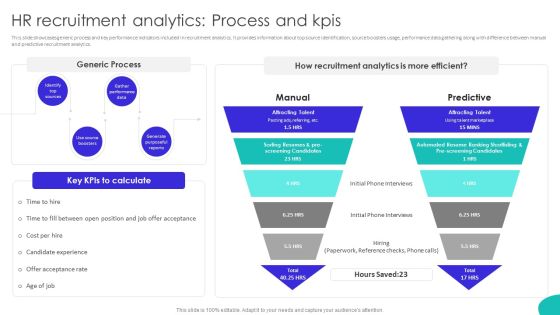
Improving Technology Based HR Recruitment Analytics Process And Kpis Designs PDF
This slide showcases generic process and key performance indicators included in recruitment analytics. It provides information about top source identification, source boosters usage, performance data gathering along with difference between manual and predictive recruitment analytics. Are you in need of a template that can accommodate all of your creative concepts This one is crafted professionally and can be altered to fit any style. Use it with Google Slides or PowerPoint. Include striking photographs, symbols, depictions, and other visuals. Fill, move around, or remove text boxes as desired. Test out color palettes and font mixtures. Edit and save your work, or work with colleagues. Download Improving Technology Based HR Recruitment Analytics Process And Kpis Designs PDF and observe how to make your presentation outstanding. Give an impeccable presentation to your group and make your presentation unforgettable.

Banking Operation Strategy Dashboard Highlighting Accounts And Product Referrals Demonstration PDF
This slide highlights the banking operation strategy which includes accounts opened and closed, total deposit vs branch goal, accounts by type, expense to budget and referrals by product. Deliver an awe inspiring pitch with this creative Banking Operation Strategy Dashboard Highlighting Accounts And Product Referrals Demonstration PDF bundle. Topics like Income To Budget, Referrals By Product, Branch Goal can be discussed with this completely editable template. It is available for immediate download depending on the needs and requirements of the user.

6 Elements Slide For Predictive Pricing Model Ppt PowerPoint Presentation Gallery Picture PDF
Presenting 6 elements slide for predictive pricing model ppt powerpoint presentation gallery picture pdf to dispense important information. This template comprises six stages. It also presents valuable insights into the topics including 6 elements slide for predictive pricing model. This is a completely customizable PowerPoint theme that can be put to use immediately. So, download it and address the topic impactfully.

Information Transformation Process Toolkit Data Analytics Value Stream Chain Microsoft PDF
This slide illustrates the series of activities required for analyzing the data. It contains information such as data preparation, exploratory analysis, and predictive analytics etc. Presenting Information Transformation Process Toolkit Data Analytics Value Stream Chain Microsoft PDF to provide visual cues and insights. Share and navigate important information on six stages that need your due attention. This template can be used to pitch topics like Exploratory Data Analysis, Data Visualization, Predictive Analytics. In addtion, this PPT design contains high resolution images, graphics, etc, that are easily editable and available for immediate download.

Monthly Financial Planning And Budgeting Process Ppt PowerPoint Presentation Visuals
This is a monthly financial planning and budgeting process ppt powerpoint presentation visuals. This is a six stage process. The stages in this process are growth, finance, development, financial development, economic growth, data analysis.
Influencers Marketing Campaign Performance Tracking Dashboard Ppt PowerPoint Presentation Diagram Lists PDF
This slide covers performance monitoring dashboard of influencer based referral marketing program. It includes elements such as impressions on Instagram, likes, comments, clicks, sales generated along with value calculators and campaign breakdown based on gender and age. Formulating a presentation can take up a lot of effort and time, so the content and message should always be the primary focus. The visuals of the PowerPoint can enhance the presenters message, so our Influencers Marketing Campaign Performance Tracking Dashboard Ppt PowerPoint Presentation Diagram Lists PDF was created to help save time. Instead of worrying about the design, the presenter can concentrate on the message while our designers work on creating the ideal templates for whatever situation is needed. Slidegeeks has experts for everything from amazing designs to valuable content, we have put everything into Influencers Marketing Campaign Performance Tracking Dashboard Ppt PowerPoint Presentation Diagram Lists PDF

Data Service Analytics Diagram Ppt Inspiration
This is a data service analytics diagram ppt inspiration. This is a eight stage process. The stages in this process are traffic demand estimation, policy control analytics, data processing, device analytics, service quality analytics, charging verification, productivity, statistical research.
Employee Turnover Dashboard With Gender Wise Attrition Rate Ppt PowerPoint Presentation Model Icons PDF
Presenting this set of slides with name employee turnover dashboard with gender wise attrition rate ppt powerpoint presentation model icons pdf. The topics discussed in these slides are estimated attrition, gender wise attrition rate, department wise attrition rate, attrition rate due salary hike, attrition rate due to distance from home, work travel causing attrition. This is a completely editable PowerPoint presentation and is available for immediate download. Download now and impress your audience.
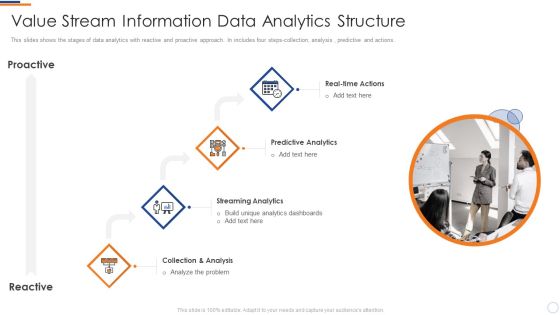
Business Intelligence And Big Value Stream Information Data Analytics Structure Formats PDF
This slides shows the stages of data analytics with reactive and proactive approach. In includes four steps-collection, analysis , predictive and actions. This is a business intelligence and big value stream information data analytics structure formats pdf template with various stages. Focus and dispense information on four stages using this creative set, that comes with editable features. It contains large content boxes to add your information on topics like real time actions, predictive analytics, streaming analytics, collection and analysis. You can also showcase facts, figures, and other relevant content using this PPT layout. Grab it now.

Information Transformation Process Toolkit Value Stream Information Data Analytics Structure Structure PDF
The slides shows the stages of data analytics with reactive and proactive approach. In includes four steps collection, analysis, predictive and actions. This is a Information Transformation Process Toolkit Value Stream Information Data Analytics Structure Structure PDF template with various stages. Focus and dispense information on four stages using this creative set, that comes with editable features. It contains large content boxes to add your information on topics like Predictive Analytics, Streaming Analytics, Collection And Analysis. You can also showcase facts, figures, and other relevant content using this PPT layout. Grab it now.
Predictive Marketing Case Study Ppt PowerPoint Presentation Infographics Graphics Pictures Cpb Pdf
Presenting this set of slides with name predictive marketing case study ppt powerpoint presentation infographics graphics pictures cpb pdf. This is an editable Powerpoint three stages graphic that deals with topics like predictive marketing case study to help convey your message better graphically. This product is a premium product available for immediate download and is 100 percent editable in Powerpoint. Download this now and use it in your presentations to impress your audience.

Use Of Predictive Analytics To Capture Corporate Client Value Ppt Pictures Deck PDF
Persuade your audience using this use of predictive analytics to capture corporate client value ppt pictures deck pdf. This PPT design covers three stages, thus making it a great tool to use. It also caters to a variety of topics including use of predictive analytics to capture corporate client value. Download this PPT design now to present a convincing pitch that not only emphasizes the topic but also showcases your presentation skills.
Integration Of Digital Technology In Organization Business Transformation Dashboard Icons PDF
This slide covers transformation dashboard covering various stages of a business along with the budget and risks involved at every stage.Deliver and pitch your topic in the best possible manner with this Integration Of Digital Technology In Organization Business Transformation Dashboard Icons PDF Use them to share invaluable insights on Discovery Or Visioning, Resources Availability, Mobilization Of Resources and impress your audience. This template can be altered and modified as per your expectations. So, grab it now.
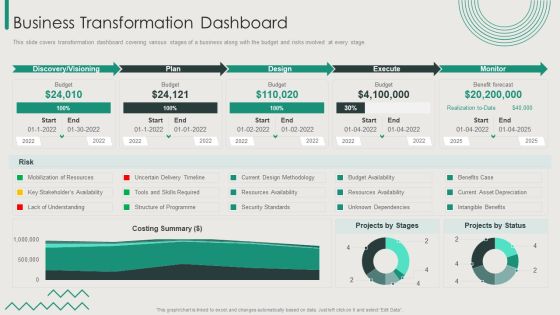
Organization Transition Business Transformation Dashboard Ppt PowerPoint Presentation Gallery Slide PDF
This slide covers transformation dashboard covering various stages of a business along with the budget and risks involved at every stage. Deliver an awe inspiring pitch with this creative Organization Transition Business Transformation Dashboard Ppt PowerPoint Presentation Gallery Slide PDF bundle. Topics like Plan, Design, Execute, Monitor can be discussed with this completely editable template. It is available for immediate download depending on the needs and requirements of the user.
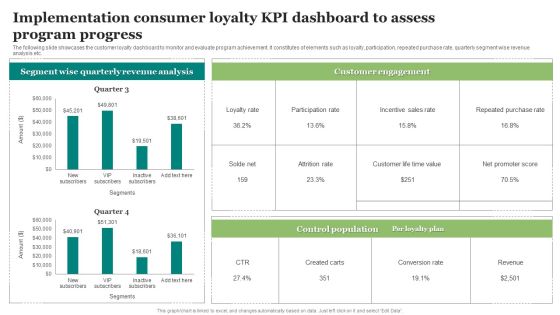
Implementation Consumer Loyalty KPI Dashboard To Assess Program Progress Guidelines PDF
The following slide illustrates the impact of executing artificial technology and machine learning in customer loyalty program. It includes elements such as predictive insights, prescriptive analytics, fraud prevention, intelligent interference etc. Showcasing this set of slides titled Implementation Consumer Loyalty KPI Dashboard To Assess Program Progress Guidelines PDF. The topics addressed in these templates are Implementation Consumer, Assess Program. All the content presented in this PPT design is completely editable. Download it and make adjustments in color, background, font etc. as per your unique business setting.

Market Survey Process And Budget Evaluation Inspiration PDF
This slide showcases various steps for conducting a market research to gain insights for better decision making. It also includes timeline, task categories, budget, number of questions, distribution channel, responses received, average time taken to fill questionnaire, etc. Showcasing this set of slides titled Market Survey Process And Budget Evaluation Inspiration PDF. The topics addressed in these templates are Database, Report Publishing, Data Collection, Data Analysis. All the content presented in this PPT design is completely editable. Download it and make adjustments in color, background, font etc. as per your unique business setting.
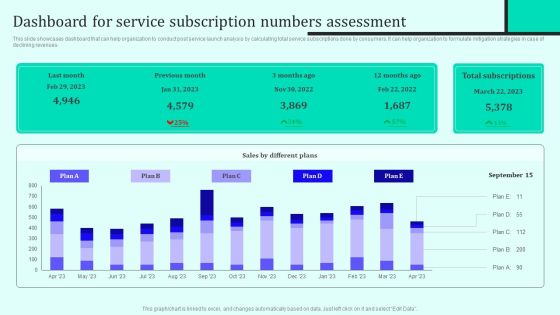
Implementing New Sales And Marketing Process For Services Dashboard For Service Subscription Diagrams PDF
This slide showcases dashboard that can help organization to conduct post service launch analysis by calculating total service subscriptions done by consumers. It can help organization to formulate mitigation strategies in case of declining revenues. Boost your pitch with our creative Implementing New Sales And Marketing Process For Services Dashboard For Service Subscription Diagrams PDF. Deliver an awe inspiring pitch that will mesmerize everyone. Using these presentation templates you will surely catch everyones attention. You can browse the ppts collection on our website. We have researchers who are experts at creating the right content for the templates. So you do not have to invest time in any additional work. Just grab the template now and use them.

Covid19 Government Aid Budget Restructure Pictures PDF
This slide covers the budget of the organisation that is allocated to the members for collection of COVID -19 samples. It includes current budget, proposed budget amount and the total revised budget. Showcasing this set of slides titled Covid19 Government Aid Budget Restructure Pictures PDF. The topics addressed in these templates are Current Budget, Proposed, Re Budgeted Amount. All the content presented in this PPT design is completely editable. Download it and make adjustments in color, background, font etc. as per your unique business setting.
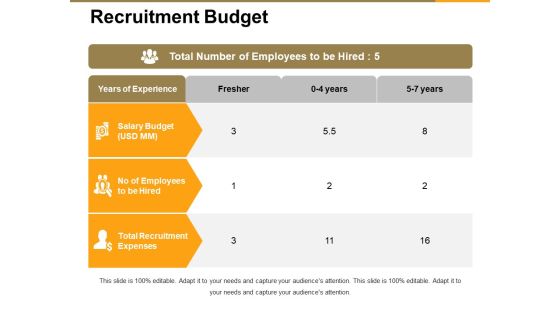
Recruitment Budget Ppt PowerPoint Presentation Pictures Model
This is a recruitment budget ppt powerpoint presentation pictures model. This is a three stage process. The stages in this process are salary budget, no of employees to be hired, total recruitment expenses, fresher, business.
Recruitment Budget Ppt PowerPoint Presentation Icon Pictures
This is a recruitment budget ppt powerpoint presentation icon pictures. This is a three stage process. The stages in this process are fresher, years of experience, salary budget, total recruitment expenses, years.

Data Maturity Framework With Predictive Operational Excellence Ppt PowerPoint Presentation Gallery Pictures PDF
Presenting data maturity framework with predictive operational excellence ppt powerpoint presentation gallery pictures pdf to dispense important information. This template comprises five stages. It also presents valuable insights into the topics including producing, improving, learning. This is a completely customizable PowerPoint theme that can be put to use immediately. So, download it and address the topic impactfully.

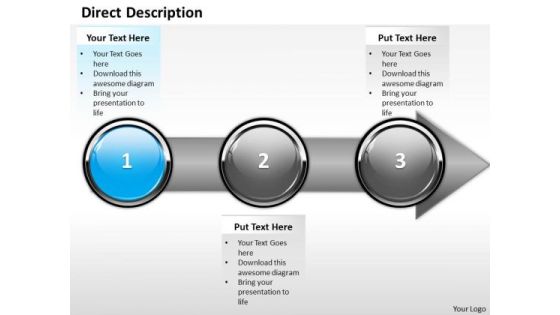
Ppt Direct Description Of Banking Process Using 3 Stages PowerPoint Templates
PPT direct description of banking process using 3 stages PowerPoint Templates-This PowerPoint Diagram shows three circular boxes on the arrow pointing towards east direction signifying he completion of the process and leading towards success.-PPT direct description of banking process using 3 stages PowerPoint Templates-Arrow, Bank, Benefit, Business, Calculate, Calculation, Capitalist, Communication, Company, Concern, Connection, Data, Diagram, Digital, Drawing, Earnings, Economic, Finance, Financial, Flow, Forecast, Gain, Goal, Graph, Growth, Illustration, Increase, Information, Interest, Investing, Management, Market, Money, Move, Network, Objective, Plan, Process, Profit, Progress, Report, Rise, Risk, Shares, Statistics, Stock, System, Technology

Ppt Homogenous Way To Prevent Banking Losses Four PowerPoint Slide Numbers Templates
PPT homogenous way to prevent banking losses four powerpoint slide numbers Templates-This PowerPoint Diagram shows you the Homogenous way to prevent Banking losses or losses in Business related Activities. It is shown by different shades of Brown color. It consists of four Stages.-PPT homogenous way to prevent banking losses four powerpoint slide numbers Templates-Arrow, Bank, Benefit, Business, Calculate, Calculation, Capitalist, Communication, Company, Concern, Connection, Data, Diagram, Digital, Drawing, Earnings, Economic, Finance, Financial, Flow, Forecast, Gain, Goal, Graph, Growth, Illustration, Increase, Information, Interest, Investing, Management, Market, Money, Move, Network, Objective, Plan, Process, Profit, Progress, Report, Rise, Risk, Shares, Statistics, Stock, System, Technology
Ppt Consecutive Demonstration Of Arrow Process Using Stage 1 PowerPoint Templates
PPT consecutive demonstration of arrow process using stage 1 PowerPoint Templates-With this pre-designed process arrows diagram you can visualize almost any type of concept, chronological process or steps of your strategies.-PPT consecutive demonstration of arrow process using stage 1 PowerPoint Templates-Arrow, Bank, Benefit, Business, Calculate, Calculation, Capitalist, Communication, Company, Concern, Connection, Data, Diagram, Digital, Drawing, Earnings, Economic, Finance, Financial, Flow, Forecast, Gain, Goal, Graph, Growth, Illustration, Increase, Information, Interest, Investing, Management, Market, Money, Move, Network, Objective, Plan, Process, Profit, Progress, Report, Rise, Risk, Shares, Statistics, Stock, System, Technology
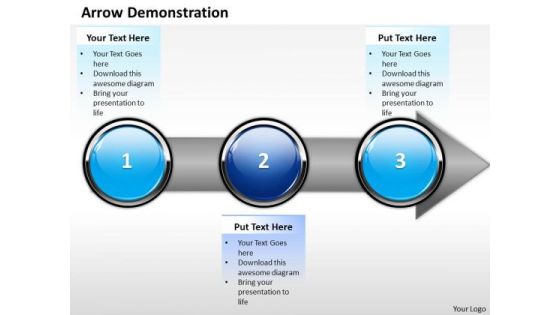
Ppt Consecutive Description Of Banking Process Using 3 State Diagram PowerPoint Templates
PPT consecutive description of banking process using 3 state diagram PowerPoint Templates-With this pre-designed process arrows diagram you can visualize almost any type of concept, chronological process or steps of your strategies.-PPT consecutive description of banking process using 3 state diagram PowerPoint Templates-Arrow, Bank, Benefit, Business, Calculate, Calculation, Capitalist, Communication, Company, Concern, Connection, Data, Diagram, Digital, Drawing, Earnings, Economic, Finance, Financial, Flow, Forecast, Gain, Goal, Graph, Growth, Illustration, Increase, Information, Interest, Investing, Management, Market, Money, Move, Network, Objective, Plan, Process, Profit, Progress, Report, Rise, Risk, Shares, Statistics, Stock, System, Technology

Ppt Direct Description Of Arrow Process Using Stage 3 PowerPoint Templates
PPT direct description of arrow process using stage 3 PowerPoint Templates-With this pre-designed process arrows diagram you can visualize almost any type of concept, chronological process or steps of your strategies.-PPT direct description of arrow process using stage 3 PowerPoint Templates-Arrow, Bank, Benefit, Business, Calculate, Calculation, Capitalist, Communication, Company, Concern, Connection, Data, Diagram, Digital, Drawing, Earnings, Economic, Finance, Financial, Flow, Forecast, Gain, Goal, Graph, Growth, Illustration, Increase, Information, Interest, Investing, Management, Market, Money, Move, Network, Objective, Plan, Process, Profit, Progress, Report, Rise, Risk, Shares, Statistics, Stock, System, Technology

Ppt Direct Illustration Of Banking Process Using Stage 2 PowerPoint Templates
PPT direct illustration of banking process using stage 2 PowerPoint Templates-With this pre-designed process arrows diagram you can visualize almost any type of concept, chronological process or steps of your strategies.-PPT direct illustration of banking process using stage 2 PowerPoint Templates-Arrow, Bank, Benefit, Business, Calculate, Calculation, Capitalist, Communication, Company, Concern, Connection, Data, Diagram, Digital, Drawing, Earnings, Economic, Finance, Financial, Flow, Forecast, Gain, Goal, Graph, Growth, Illustration, Increase, Information, Interest, Investing, Management, Market, Money, Move, Network, Objective, Plan, Process, Profit, Progress, Report, Rise, Risk, Shares, Statistics, Stock, System, Technology

Ppt Homogenous Way To Avoid Development Losses Four Steps PowerPoint Templates
PPT homogenous way to avoid development losses four steps PowerPoint Templates-The theme of this PowerPoint template is linear arrows. Use them to illustrate a stepwise process or a phase structure. You can easily change its colors-PPT homogenous way to avoid development losses four steps PowerPoint Templates-Arrow, Bank, Benefit, Business, Calculate, Calculation, Capitalist, Communication, Company, Concern, Connection, Data, Diagram, Digital, Drawing, Earnings, Economic, Finance, Financial, Flow, Forecast, Gain, Goal, Graph, Growth, Illustration, Increase, Information, Interest, Investing, Management, Market, Money, Move, Network, Objective, Plan, Process, Profit, Progress, Report, Rise, Risk, Shares, Statistics, Stock, System, Technology
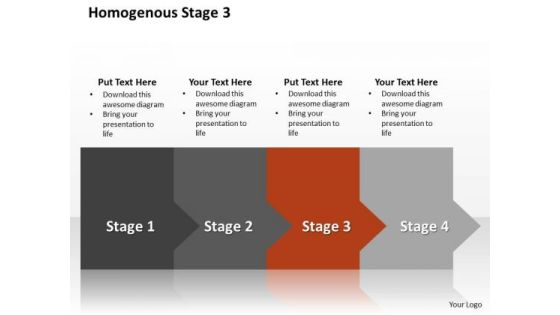
Ppt Homogenous Way To Prevent Banking Losses Stage 3 PowerPoint Templates
PPT homogenous way to prevent banking losses stage 3 PowerPoint Templates-The theme of this PowerPoint template is linear arrows. Use them to illustrate a stepwise process or a phase structure. You can easily change its colors-PPT homogenous way to prevent banking losses stage 3 PowerPoint Templates-Arrow, Bank, Benefit, Business, Calculate, Calculation, Capitalist, Communication, Company, Concern, Connection, Data, Diagram, Digital, Drawing, Earnings, Economic, Finance, Financial, Flow, Forecast, Gain, Goal, Graph, Growth, Illustration, Increase, Information, Interest, Investing, Management, Market, Money, Move, Network, Objective, Plan, Process, Profit, Progress, Report, Rise, Risk, Shares, Statistics, Stock, System, Technology
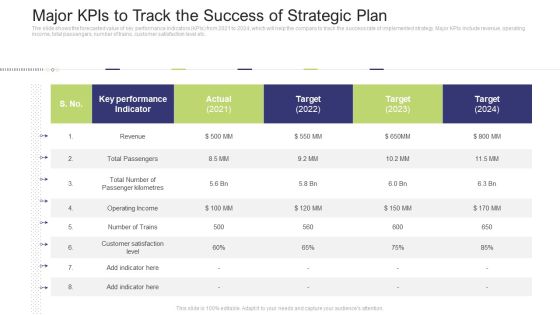
Major Kpis To Track The Success Of Strategic Plan Ideas PDF
The slide shows the forecasted value of key performance indicators KPIs from 2021 to 2024, which will help the company to track the success rate of implemented strategy. Major KPIs include revenue, operating income, total passengers, number of trains, customer satisfaction level etc.Deliver and pitch your topic in the best possible manner with this major kpis to track the success of strategic plan ideas pdf. Use them to share invaluable insights on key performance indicator, actual 2021 and impress your audience. This template can be altered and modified as per your expectations. So, grab it now.
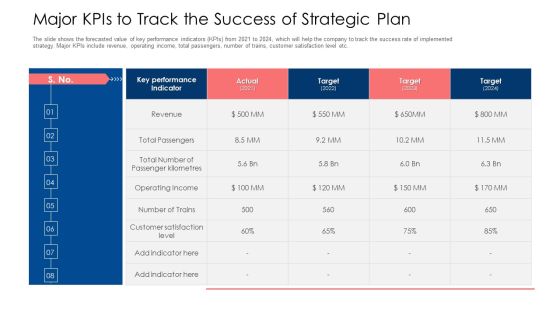
Major Kpis To Track The Success Of Strategic Plan Ppt Summary Influencers PDF
The slide shows the forecasted value of key performance indicators KPIs from 2021 to 2024, which will help the company to track the success rate of implemented strategy. Major KPIs include revenue, operating income, total passengers, number of trains, customer satisfaction level etc. Deliver an awe inspiring pitch with this creative major kpis to track the success of strategic plan ppt summary influencers pdf bundle. Topics like revenue, key performance indicator, target can be discussed with this completely editable template. It is available for immediate download depending on the needs and requirements of the user.
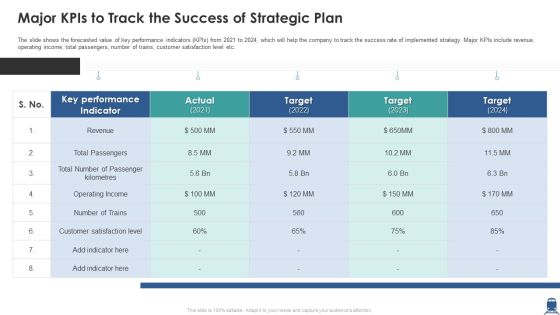
Major Kpis To Track The Success Of Strategic Plan Download PDF
The slide shows the forecasted value of key performance indicators KPIs from 2021 to 2024, which will help the company to track the success rate of implemented strategy. Major KPIs include revenue, operating income, total passengers, number of trains, customer satisfaction level etc. Deliver and pitch your topic in the best possible manner with this major kpis to track the success of strategic plan download pdf. Use them to share invaluable insights on revenue, key performance indicator, customer satisfaction level and impress your audience. This template can be altered and modified as per your expectations. So, grab it now.

Data Analytics Value Stream Chain Business Analysis Modification Toolkit Summary PDF
This slide illustrates the series of activities required for analyzing the data. It contains information such as data preparation, exploratory analysis, and predictive analytics etc.This is a Data Analytics Value Stream Chain Business Analysis Modification Toolkit Summary PDF template with various stages. Focus and dispense information on six stages using this creative set, that comes with editable features. It contains large content boxes to add your information on topics like Formulate Business, Data Visualization, Classification Clustering. You can also showcase facts, figures, and other relevant content using this PPT layout. Grab it now.

Key Technologies For Big Data Analytics In Organization Ppt Outline Gridlines PDF
The following slide highlights applications of key technologies for big data analytics in business industry to discover hardware and software solutions for processing data. It includes components such as predictive analysis, nosql database, knowledge discovery tools , data virtualization etc. Presenting Key Technologies For Big Data Analytics In Organization Ppt Outline Gridlines PDF to dispense important information. This template comprises five stages. It also presents valuable insights into the topics including Predictive Analytics, Knowledge Discovery Tools, Data Virtualization, Distributed Storage . This is a completely customizable PowerPoint theme that can be put to use immediately. So, download it and address the topic impactfully.
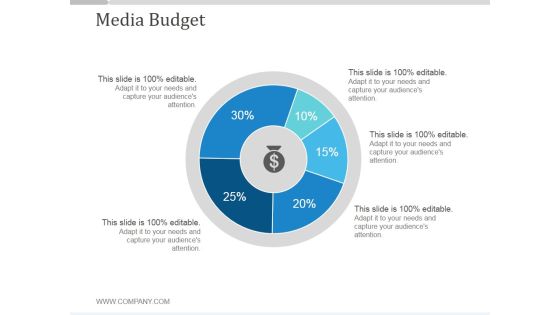
Media Budget Ppt PowerPoint Presentation Picture
This is a media budget ppt powerpoint presentation picture. This is a five stage process. The stages in this process are finance, management, marketing, business.
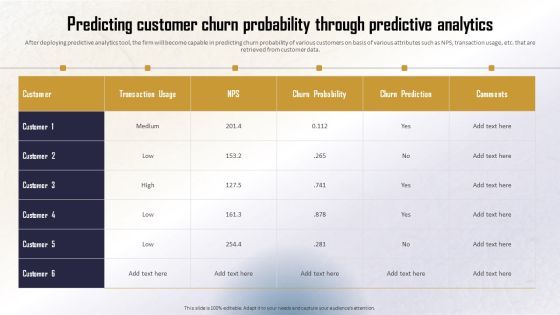
Identifying Direct And Indirect Predicting Customer Churn Probability Through Infographics PDF
After deploying predictive analytics tool, the firm will become capable in predicting churn probability of various customers on basis of various attributes such as NPS, transaction usage, etc. that are retrieved from customer data. The best PPT templates are a great way to save time, energy, and resources. Slidegeeks have 100 percent editable powerpoint slides making them incredibly versatile. With these quality presentation templates, you can create a captivating and memorable presentation by combining visually appealing slides and effectively communicating your message. Download Identifying Direct And Indirect Predicting Customer Churn Probability Through Infographics PDF from Slidegeeks and deliver a wonderful presentation.

Lead Scoring Model Predictive Analytics To Assess Lead Scoring Ppt Pictures Mockup PDF
This is a lead scoring model predictive analytics to assess lead scoring ppt pictures mockup pdf template with various stages. Focus and dispense information on five stages using this creative set, that comes with editable features. It contains large content boxes to add your information on topics like psychographic, firmographic, demographic, geographic, histographic. You can also showcase facts, figures, and other relevant content using this PPT layout. Grab it now.
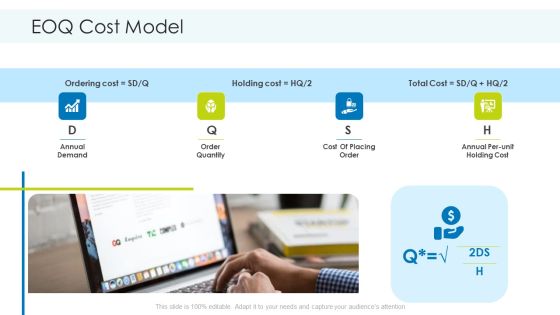
Planning And Predicting Of Logistics Management EOQ Cost Model Ppt Pictures Slides PDF
This is a planning and predicting of logistics management EOQ cost model ppt pictures slides pdf. template with various stages. Focus and dispense information on four stages using this creative set, that comes with editable features. It contains large content boxes to add your information on topics like annual demand, order quantity, cost of placing order. You can also showcase facts, figures, and other relevant content using this PPT layout. Grab it now.

Icons Slide For Leveraging Predictive Maintenance To Enhance Production Process Pictures PDF
Boost your pitch with our creative Icons Slide For Leveraging Predictive Maintenance To Enhance Production Process Pictures PDF. Deliver an awe-inspiring pitch that will mesmerize everyone. Using these presentation templates you will surely catch everyones attention. You can browse the ppts collection on our website. We have researchers who are experts at creating the right content for the templates. So you dont have to invest time in any additional work. Just grab the template now and use them.

Data Analytics Maturity Framework Stages Ppt PowerPoint Presentation File Demonstration PDF
This slide mentions the stages involved in data analytics maturity model with their specific applications, tools involved and specialists required at each stage. The stages include descriptive, diagnostic, predictive and prescriptive analysis. Showcasing this set of slides titled Data Analytics Maturity Framework Stages Ppt PowerPoint Presentation File Demonstration PDF. The topics addressed in these templates are Descriptive Analytics, Diagnostic Analytics, Predictive Analytics, Prescriptive Analytics. All the content presented in this PPT design is completely editable. Download it and make adjustments in color, background, font etc. as per your unique business setting.

 Home
Home