Project Snapshot

Calculating Customer Lifetime Value Clv Ppt PowerPoint Presentation Infographic Template Format
This is a calculating customer lifetime value clv ppt powerpoint presentation infographic template format. This is a five stage process. The stages in this process are average acquisition cost, average customer revenue, average customer costs, average customer profit, customer retention rate, cumulative retention rate.
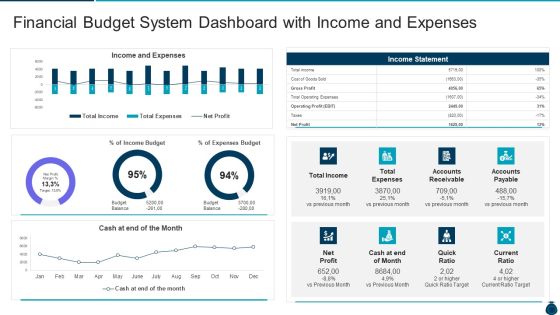
Key Elements And Techniques Of A Budgeting System Financial Budget System Dashboard With Income And Expenses Rules PDF
Deliver an awe inspiring pitch with this creative key elements and techniques of a budgeting system financial budget system dashboard with income and expenses rules pdf bundle. Topics like financial budget system dashboard with income and expenses can be discussed with this completely editable template. It is available for immediate download depending on the needs and requirements of the user.

CRM Software Deployment Journey CRM Dashboard For Tracking Sales Pipeline Demonstration PDF
This slide covers the CRM KPI dashboard for monitoring lead status in the sales funnel. It includes metrics such as open pipeline value, open pipeline by product package, pipeline value forecast, etc. Do you have to make sure that everyone on your team knows about any specific topic I yes, then you should give CRM Software Deployment Journey CRM Dashboard For Tracking Sales Pipeline Demonstration PDF a try. Our experts have put a lot of knowledge and effort into creating this impeccable CRM Software Deployment Journey CRM Dashboard For Tracking Sales Pipeline Demonstration PDF. You can use this template for your upcoming presentations, as the slides are perfect to represent even the tiniest detail. You can download these templates from the Slidegeeks website and these are easy to edit. So grab these today.

Table Of Contents Predictive Data Model Slides PDF
Coming up with a presentation necessitates that the majority of the effort goes into the content and the message you intend to convey. The visuals of a PowerPoint presentation can only be effective if it supplements and supports the story that is being told. Keeping this in mind our experts created Table Of Contents Predictive Data Model Slides PDF to reduce the time that goes into designing the presentation. This way, you can concentrate on the message while our designers take care of providing you with the right template for the situation.

Proregression Of Analytics Predictive And Prescriptive Ppt PowerPoint Presentation Styles Inspiration Cpb
This is a proregression of analytics predictive and prescriptive ppt powerpoint presentation styles inspiration cpb. This is a four stage process. The stages in this process are data analysis, analytics architecture, analytics framework.
Stock Photo Business Growth Strategy Coins Concept Of Financial Pictures Images
Compel Fate With Our stock photo business growth strategy coins concept of financial pictures images. The Dice Will Fall As Per Your Forecast. Acquire Fame As An Accurate Forecaster. Our marketing Ensure The Fall Of The Dice.
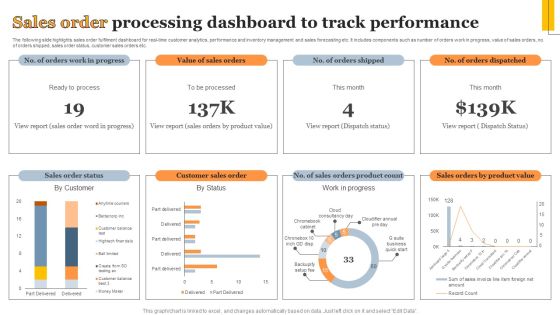
Sales Order Processing Dashboard To Track Performance Information PDF
The following slide highlights sales order fulfilment dashboard for real-time customer analytics, performance and inventory management and sales forecasting etc. It includes components such as number of orders work in progress, value of sales orders, no. of orders shipped, sales order status, customer sales orders etc. Showcasing this set of slides titled Sales Order Processing Dashboard To Track Performance Information PDF. The topics addressed in these templates are Sales Order Status, Customer Sales Order, Work Progress. All the content presented in this PPT design is completely editable. Download it and make adjustments in color, background, font etc. as per your unique business setting.
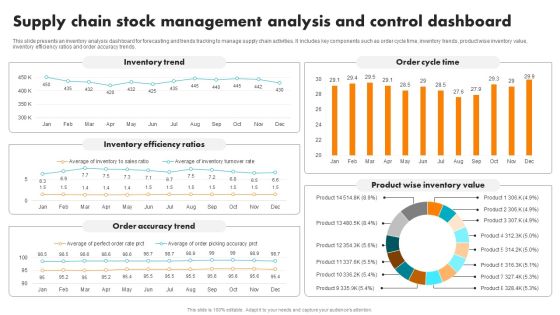
Supply Chain Stock Management Analysis And Control Dashboard Brochure PDF
This slide presents an inventory analysis dashboard for forecasting and trends tracking to manage supply chain activities. It includes key components such as order cycle time, inventory trends, product wise inventory value, inventory efficiency ratios and order accuracy trends. Pitch your topic with ease and precision using this Supply Chain Stock Management Analysis And Control Dashboard Brochure PDF. This layout presents information on Inventory Trend, Inventory Efficiency Ratios, Order Accuracy Trend, Order Cycle Time, Product Wise Inventory Value. It is also available for immediate download and adjustment. So, changes can be made in the color, design, graphics or any other component to create a unique layout.

Business Intelligence And Big Vendor Data Profile For Data Analytics Software Formats PDF
This slide represents the list of vendors along with accompanying information including the key features, pros and cons of each vendor software. Presenting business intelligence and big vendor data profile for data analytics software formats pdf to provide visual cues and insights. Share and navigate important information on four stages that need your due attention. This template can be used to pitch topics like data support, technology support, predictive applications, reporting features, security features. In addtion, this PPT design contains high resolution images, graphics, etc, that are easily editable and available for immediate download.

Roadmap For Predictive Analytics Model Development Forward Looking Analysis IT Guidelines PDF
This slide represents the roadmap for predictive analytics model development, including the steps to be performed in the process, such as highlighting formulating a problem, data preparation, information exploration, transforming choosing, making, validating, and so on.Here you can discover an assortment of the finest PowerPoint and Google Slides templates. With these templates, you can create presentations for a variety of purposes while simultaneously providing your audience with an eye-catching visual experience. Download Roadmap For Predictive Analytics Model Development Forward Looking Analysis IT Guidelines PDF to deliver an impeccable presentation. These templates will make your job of preparing presentations much quicker, yet still, maintain a high level of quality. Slidegeeks has experienced researchers who prepare these templates and write high-quality content for you. Later on, you can personalize the content by editing the Roadmap For Predictive Analytics Model Development Forward Looking Analysis IT Guidelines PDF.

Organization Reinvention Digital Finance Dashboard Clipart PDF
This slide covers the advanced technologies entering the market from past few decades. The combinatorial effects of base technologies, such as mobile, cloud, sensors, analytics and the Internet of Things IoT, are accelerating progress exponentially. This slide covers transformation dashboard covering various stages of a business along with the budget and risks involved at every stage. Deliver and pitch your topic in the best possible manner with this Organization Reinvention Digital Finance Dashboard Clipart PDF. Use them to share invaluable insights on Revenue By Channels, Operating Cost, Digital Budget and impress your audience. This template can be altered and modified as per your expectations. So, grab it now.
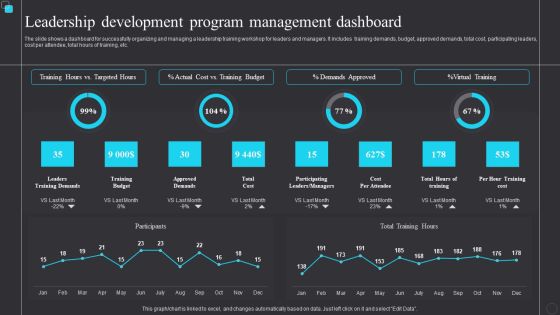
Leadership Development Program Management Dashboard Themes PDF
The slide shows a dashboard for successfully organizing and managing a leadership training workshop for leaders and managers. It includes training demands, budget, approved demands, total cost, participating leaders, cost per attendee, total hours of training, etc. Showcasing this set of slides titled Leadership Development Program Management Dashboard Themes PDF. The topics addressed in these templates are Leaders Training Demands, Approved Demands, Training Budget. All the content presented in this PPT design is completely editable. Download it and make adjustments in color, background, font etc. as per your unique business setting.

Tactical Asset Allocation Analysis Dashboard Designs PDF
This slide depicts the asset allocation portfolio summary and investment details. The purpose of this dashboard is to analyze the strategies used to allocate assets of an investor. It includes information related to the portfolios, budget, distribution, etc..Showcasing this set of slides titled Tactical Asset Allocation Analysis Dashboard Designs PDF. The topics addressed in these templates are Across Portfolios, Budget Percentage, Actual Cost. All the content presented in this PPT design is completely editable. Download it and make adjustments in color, background, font etc. as per your unique business setting.

Benefits Of Predictive Analytics Cost Reduction Ppt PowerPoint Presentation Styles Sample
Presenting this set of slides with name benefits of predictive analytics cost reduction ppt powerpoint presentation styles sample. This is a three stage process. The stages in this process are big data analysis, data management, technologies segmentation. This is a completely editable PowerPoint presentation and is available for immediate download. Download now and impress your audience.
Stock Photo Business Concepts Pair Of Flag Designed Flip Flop Stock Photo Image
Compel Fate With Our stock photo business concepts pair of flag designed flip flop stock photo image. The Dice Will Fall As Per Your Forecast. Acquire Fame As An Accurate Forecaster. Our Holidays Ensure The Fall Of The Dice.
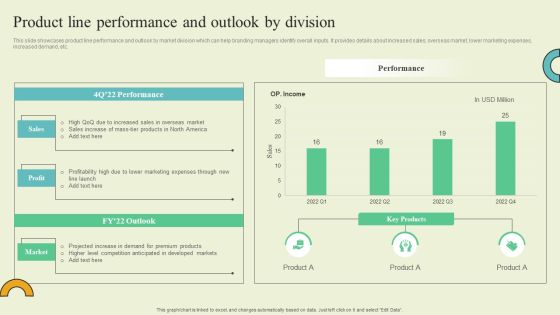
Extending Brand To Introduce New Commodities And Offerings Product Line Performance And Outlook Rules PDF
This slide showcases product line performance and outlook by market division which can help branding managers identify overall inputs. It provides details about increased sales, overseas market, lower marketing expenses, increased demand, etc. This modern and well arranged Extending Brand To Introduce New Commodities And Offerings Product Line Performance And Outlook Rules PDF provides lots of creative possibilities. It is very simple to customize and edit with the Powerpoint Software. Just drag and drop your pictures into the shapes. All facets of this template can be edited with Powerpoint no extra software is necessary. Add your own material, put your images in the places assigned for them, adjust the colors, and then you can show your slides to the world, with an animated slide included.

Corporate Digital Transformation Roadmap IT Transformation Dashboard With Iterate And Delivery Microsoft PDF
The following slide displays the key metrics for the IT transformation dashboard as it displays the key challenges faced along with the budget spent and the time period of challenges Deliver and pitch your topic in the best possible manner with this Corporate Digital Transformation Roadmap IT Transformation Dashboard With Iterate And Delivery Microsoft PDF Use them to share invaluable insights on IT Transformation Dashboard With Iterate And Delivery and impress your audience. This template can be altered and modified as per your expectations. So, grab it now.
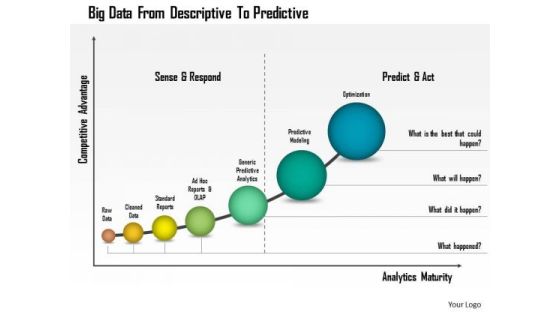
Business Diagram Big Data From Descriptive To Predictive Presentation Template
This business diagram has been designed with graphic of linear bar graph. This growing bar graph depicts the concept of big data analysis. Use this professional diagram for your financial and business analysis.

Sustainability Calculation With KPI Employee Engagement And Company Culture Sample PDF Topics PDF
Following slide shows employee engagement and company culture dashboard. It includes employee details, engagement score, total given recognition, previous seven days performance and radar chart to measure employee performance. Deliver and pitch your topic in the best possible manner with this sustainability calculation with kpi employee engagement and company culture sample pdf. Use them to share invaluable insights on employee engagement and company culture dashboard and impress your audience. This template can be altered and modified as per your expectations. So, grab it now.

Agriculture Budgeting Kpis For Effective Management Professional PDF
This slide consists of major key performing indicators that can be used for effective planning and farm budgeting. Major key performance indicators are gross revenue, cost of goods sold, operating expenses, etc. Pitch your topic with ease and precision using this Agriculture Budgeting Kpis For Effective Management Professional PDF. This layout presents information on Gross Revenue, Operating Expenses, Net Income. It is also available for immediate download and adjustment. So, changes can be made in the color, design, graphics or any other component to create a unique layout.

Customer Relationship Management Dashboard Digital Marketing Integration In CRM Diagrams PDF
Deliver and pitch your topic in the best possible manner with this customer relationship management dashboard digital marketing integration in crm diagrams pdf. Use them to share invaluable insights on personalized and predictive recommendations, guided selling, customer and product data and impress your audience. This template can be altered and modified as per your expectations. So, grab it now.

Lifecycle Of Predictive Analytics Model Forward Looking Analysis IT Designs PDF
This slide depicts the lifecycle of the predictive analytics model, and it includes highlighting formulating a problem, data preparation, information exploration, transforming and choosing, making, validating, and deploying a model, and then evaluating and monitoring results.Present like a pro with Lifecycle Of Predictive Analytics Model Forward Looking Analysis IT Designs PDF Create beautiful presentations together with your team, using our easy-to-use presentation slides. Share your ideas in real-time and make changes on the fly by downloading our templates. So whether you are in the office, on the go, or in a remote location, you can stay in sync with your team and present your ideas with confidence. With Slidegeeks presentation got a whole lot easier. Grab these presentations today.

Predictive Analytics In Banking And Finance Industry Forward Looking Analysis IT Diagrams PDF
This slide represents the application of predictive analytics in the finance and banking sector as they deal with vast amounts of data. It helps these industries identify fraudulent transactions, generate credit score, monitor credit risks, and optimize cross-sell or up-sell possibilities.Coming up with a presentation necessitates that the majority of the effort goes into the content and the message you intend to convey. The visuals of a PowerPoint presentation can only be effective if it supplements and supports the story that is being told. Keeping this in mind our experts created Predictive Analytics In Banking And Finance Industry Forward Looking Analysis IT Diagrams PDF to reduce the time that goes into designing the presentation. This way, you can concentrate on the message while our designers take care of providing you with the right template for the situation.

Data Analytics Software Features Business Analysis Modification Toolkit Formats PDF
This slide represents the key features of predictive data analytics including data mining, data visualization, and modelling etc.Presenting Data Analytics Software Features Business Analysis Modification Toolkit Formats PDF to provide visual cues and insights. Share and navigate important information on eight stages that need your due attention. This template can be used to pitch topics like Predictive Modeling, Data Unification, Data Visualization. In addtion, this PPT design contains high resolution images, graphics, etc, that are easily editable and available for immediate download.
Monthly Working Capital Calculation Table Ppt PowerPoint Presentation Icon Clipart
Presenting this set of slides with name monthly working capital calculation table ppt powerpoint presentation icon clipart. The topics discussed in these slides are month, accounts receivable, inventory, accounts payable, working capital, kpis. This is a completely editable PowerPoint presentation and is available for immediate download. Download now and impress your audience.

Information Transformation Process Toolkit Key Features Of Predictive Data Analytics Software Mockup PDF
This slide represents the characteristics of predictive data analytics software. It includes features like predictive modeling, predictive scoring and data mining functions that help companies to get better insights. This is a Information Transformation Process Toolkit Key Features Of Predictive Data Analytics Software Mockup PDF template with various stages. Focus and dispense information on five stages using this creative set, that comes with editable features. It contains large content boxes to add your information on topics like Predictive Scoring, Predictive Modeling, Data Mining Functions. You can also showcase facts, figures, and other relevant content using this PPT layout. Grab it now.

AIM Principles For Data Storage Application Cost Dashboard Ppt Icon Diagrams PDF
Deliver an awe inspiring pitch with this creative aim principles for data storage application cost dashboard ppt icon diagrams pdf bundle. Topics like investment, department, budget, cost, comparison can be discussed with this completely editable template. It is available for immediate download depending on the needs and requirements of the user.

Business Strategy Development Process Business Management Dashboards Balance Download PDF
Deliver an awe inspiring pitch with this creative business strategy development process business management dashboards balance download pdf bundle. Topics like actual income vs budget, actual expenses vs budget can be discussed with this completely editable template. It is available for immediate download depending on the needs and requirements of the user.

Budget Deficit Evaluation Kpis Icon Elements PDF
Presenting Budget Deficit Evaluation Kpis Icon Elements PDF to dispense important information. This template comprises Four stages. It also presents valuable insights into the topics including Budget Deficit, Evaluation Kpis Icon. This is a completely customizable PowerPoint theme that can be put to use immediately. So, download it and address the topic impactfully.

Functional Data Analysis To Predict Stock Market Trends Ppt PowerPoint Presentation Pictures Graphic Tips
Presenting this set of slides with name functional data analysis to predict stock market trends ppt powerpoint presentation pictures graphic tips. This is a one stage process. The stages in this process are functional data analysis to predict stock market trends. This is a completely editable PowerPoint presentation and is available for immediate download. Download now and impress your audience.

Dashboard For IT Governance Implementation Background PDF
This slide depicts the dashboard for IT governance implementation, including return on investment of the IT department, spend vs. budget, IT cost breakdown, and IT costs vs. income.Deliver and pitch your topic in the best possible manner with this Dashboard For IT Governance Implementation Background PDF. Use them to share invaluable insights on Costs Dashboard, Cost Breakdown, Depreciation and impress your audience. This template can be altered and modified as per your expectations. So, grab it now.

Icon For Big Data And Predictive Analytics In Health Industry Demonstration PDF
Presenting Icon For Big Data And Predictive Analytics In Health Industry Demonstration PDF to dispense important information. This template comprises three stages. It also presents valuable insights into the topics including Icon Big Data, Predictive Analytics, Health Industry. This is a completely customizable PowerPoint theme that can be put to use immediately. So, download it and address the topic impactfully.

Data Enablement Framework Elements With Value Pyramid Portrait PDF
This slide illustrates value pyramid framework for data enablement. It includes elements such as actions, predictions, reports, charts. Presenting Data Enablement Framework Elements With Value Pyramid Portrait PDF to dispense important information. This template comprises five stages. It also presents valuable insights into the topics including Actions, Predictions, Reports. This is a completely customizable PowerPoint theme that can be put to use immediately. So, download it and address the topic impactfully.

Strategic Planning And Budgeting Process Example Of Ppt
This is a strategic planning and budgeting process example of ppt. This is a five stage process. The stages in this process are budget development, strategic planning, evaluation, execution, control.

Dashboard To Monitor Department Wise Budget Allocation And Usage Icons PDF
This slide highlights the dashboard to monitor the department wise budget allocation and usage. It provides information regarding the total budget allocated and actual amount spent by multiple organization silos such as marketing, finance, HR. It also contains details of each departments average employee spending, Make sure to capture your audiences attention in your business displays with our gratis customizable Dashboard To Monitor Department Wise Budget Allocation And Usage Icons PDF. These are great for business strategies, office conferences, capital raising or task suggestions. If you desire to acquire more customers for your tech business and ensure they stay satisfied, create your own sales presentation with these plain slides.
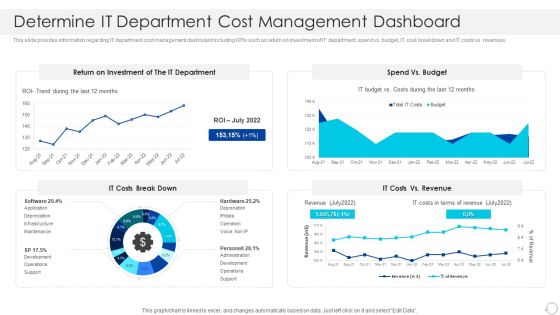
Determine IT Department Cost Management Dashboard Graphics PDF
This slide provides information regarding IT department cost management dashboard including KPIs such as return on investment of IT department, spend vs. budget, IT cost breakdown and IT costs vs. revenues. Deliver and pitch your topic in the best possible manner with this Determine IT Department Cost Management Dashboard Graphics PDF. Use them to share invaluable insights on Investment, Budget, Revenue and impress your audience. This template can be altered and modified as per your expectations. So, grab it now.
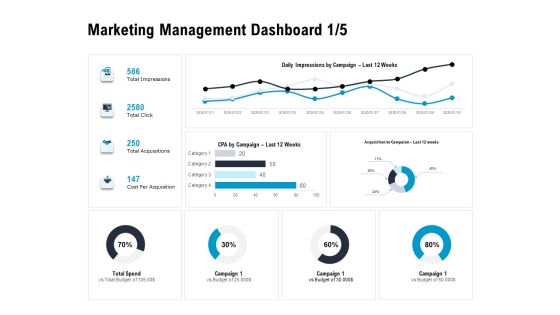
Optimizing The Marketing Operations To Drive Efficiencies Marketing Management Dashboard Budget Brochure PDF
Deliver an awe inspiring pitch with this creative optimizing the marketing operations to drive efficiencies marketing management dashboard budget brochure pdf bundle. Topics like marketing management dashboard can be discussed with this completely editable template. It is available for immediate download depending on the needs and requirements of the user.

Business Monthly Operational Budget Report Summary With Actual Data Structure PDF
The following slide highlights the monthly operational budget report with actual data. It provides information about particulars, item, budget, revenue, expenses, salaries, materials, overhead, total and balance.Showcasing this set of slides titled Business Monthly Operational Budget Report Summary With Actual Data Structure PDF The topics addressed in these templates are Particulars, Membership Receivables, Administrative All the content presented in this PPT design is completely editable. Download it and make adjustments in color, background, font etc. as per your unique business setting.
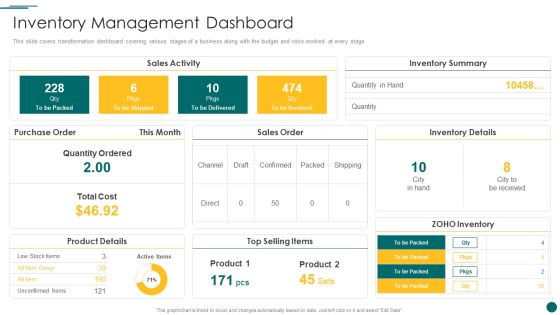
Organization Reinvention Inventory Management Dashboard Microsoft PDF
This slide covers transformation dashboard covering various stages of a business along with the budget and risks involved at every stage Deliver an awe inspiring pitch with this creative Organization Reinvention Inventory Management Dashboard Microsoft PDF bundle. Topics like Sales Activity, Inventory Summary, Inventory Details can be discussed with this completely editable template. It is available for immediate download depending on the needs and requirements of the user.
Monthly Budget Dashboard Showing HR Cost Ppt PowerPoint Presentation Icon Infographics PDF
Showcasing this set of slides titled monthly budget dashboard showing hr cost ppt powerpoint presentation icon infographics pdf. The topics addressed in these templates are budget, expenses, actual. All the content presented in this PPT design is completely editable. Download it and make adjustments in color, background, font etc. as per your unique business setting.

Ways To Improve Crm Strategy Predictive And Big Data Analytics Ppt PowerPoint Presentation Portfolio Information
This is a ways to improve crm strategy predictive and big data analytics ppt powerpoint presentation portfolio information. This is a six stage process. The stages in this process are employee performance review, job evaluation, customer 360.

Revenue And Expense Budget Deficit Analysis With KPI Dashboard Rules PDF
Showcasing this set of slides titled Revenue And Expense Budget Deficit Analysis With KPI Dashboard Rules PDF. The topics addressed in these templates are Revenue And Expense, Budget Deficit Analysis. All the content presented in this PPT design is completely editable. Download it and make adjustments in color, background, font etc. as per your unique business setting.

Predictive Analytics Big Data Ppt PowerPoint Presentation Infographics Design Templates Cpb
Presenting this set of slides with name predictive analytics big data ppt powerpoint presentation infographics design templates cpb. This is an editable Powerpoint five stages graphic that deals with topics like predictive analytics big data to help convey your message better graphically. This product is a premium product available for immediate download and is 100 percent editable in Powerpoint. Download this now and use it in your presentations to impress your audience.
Predictive Analytics Data Mining Ppt PowerPoint Presentation Infographic Template Inspiration Cpb
Presenting this set of slides with name predictive analytics data mining ppt powerpoint presentation infographic template inspiration cpb. This is an editable Powerpoint three stages graphic that deals with topics like predictive analytics data mining to help convey your message better graphically. This product is a premium product available for immediate download and is 100 percent editable in Powerpoint. Download this now and use it in your presentations to impress your audience.

Spend Analysis Budget Vs Actual Dashboard Ppt PowerPoint Presentation Gallery Clipart PDF
Presenting this set of slides with name spend analysis budget vs actual dashboard ppt powerpoint presentation gallery clipart pdf. The topics discussed in these slides are analysis, budget, actual. This is a completely editable PowerPoint presentation and is available for immediate download. Download now and impress your audience.

Target Market Strategy Marketing Management Dashboard Budget Ppt Portfolio Outfit PDF
Deliver an awe-inspiring pitch with this creative target market strategy marketing management dashboard budget ppt portfolio outfit pdf bundle. Topics like total impressions, total click, total acquisitions, cost per acquisition, budget can be discussed with this completely editable template. It is available for immediate download depending on the needs and requirements of the user.
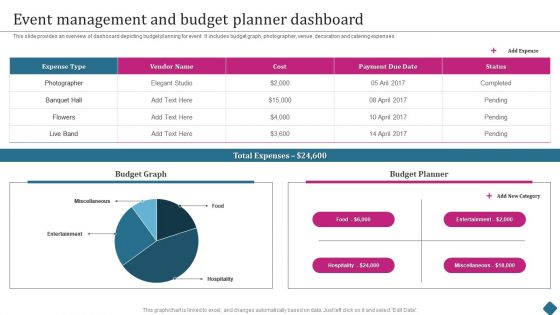
Smart Phone Launch Event Management Tasks Event Management And Budget Planner Dashboard Clipart PDF
This slide provides an overview of dashboard depicting budget planning for event. It includes budget graph, photographer, venue, decoration and catering expenses. Boost your pitch with our creative Smart Phone Launch Event Management Tasks Event Management And Budget Planner Dashboard Clipart PDF. Deliver an awe inspiring pitch that will mesmerize everyone. Using these presentation templates you will surely catch everyones attention. You can browse the ppts collection on our website. We have researchers who are experts at creating the right content for the templates. So you do not have to invest time in any additional work. Just grab the template now and use them.
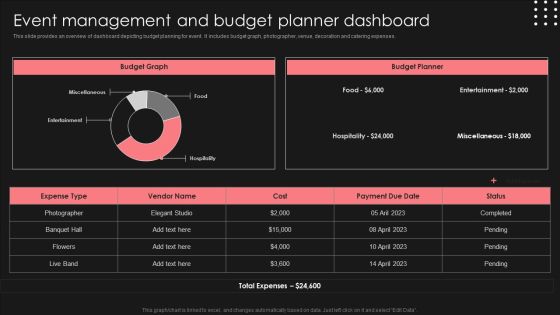
Positive Impact Of Effective Event Management And Budget Planner Dashboard Information PDF
This slide provides an overview of dashboard depicting budget planning for event. It includes budget graph, photographer, venue, decoration and catering expenses. Explore a selection of the finest Positive Impact Of Effective Event Management And Budget Planner Dashboard Information PDF here. With a plethora of professionally designed and pre-made slide templates, you can quickly and easily find the right one for your upcoming presentation. You can use our Positive Impact Of Effective Event Management And Budget Planner Dashboard Information PDF to effectively convey your message to a wider audience. Slidegeeks has done a lot of research before preparing these presentation templates. The content can be personalized and the slides are highly editable. Grab templates today from Slidegeeks.

Data Storage Process With Icons Ppt PowerPoint Presentation File Layouts PDF
Persuade your audience using this data storage process with icons ppt powerpoint presentation file layouts pdf. This PPT design covers three stages, thus making it a great tool to use. It also caters to a variety of topics including reporting, budgeting, dashboard. Download this PPT design now to present a convincing pitch that not only emphasizes the topic but also showcases your presentation skills.

Predictive Data Model Difference Between Four Types Of Advanced Analytics Guidelines PDF
This slide represents the difference between the main types of advanced analytics, and it includes diagnostic, descriptive, predictive, and prescriptive analytics. The four major categories of advanced analytics share certain commonalities but are distinguished mostly by their distinctions. Do you have an important presentation coming up Are you looking for something that will make your presentation stand out from the rest Look no further than Predictive Data Model Difference Between Four Types Of Advanced Analytics Guidelines PDF. With our professional designs, you can trust that your presentation will pop and make delivering it a smooth process. And with Slidegeeks, you can trust that your presentation will be unique and memorable. So why wait Grab Predictive Data Model Difference Between Four Types Of Advanced Analytics Guidelines PDF today and make your presentation stand out from the rest

Cost Management Dashboard In Cloud Management Platform Pictures PDF
This slide covers dashboard platform for the resource organization, resource security, auditing, and cost. It also includes reporting, dashboards, budgets, optimizations, etc. Deliver and pitch your topic in the best possible manner with this Cost Management Dashboard In Cloud Management Platform Pictures PDF. Use them to share invaluable insights on Cost By Service, Cost Entity Summary, Storage By Department and impress your audience. This template can be altered and modified as per your expectations. So, grab it now.

Change Management Training Calendar Dashboard With Actual And Budgeted Cost Demonstration PDF
This slide showcases KPI dashboard of training program to assess its efficiency and proper functioning. It includes details such as cost, total hours, occupancy rate, etc. Showcasing this set of slides titled Change Management Training Calendar Dashboard With Actual And Budgeted Cost Demonstration PDF. The topics addressed in these templates are Actual, Budget, Cost Per Participant, Cost Per Hour. All the content presented in this PPT design is completely editable. Download it and make adjustments in color, background, font etc. as per your unique business setting.

Key Performance Indicators Of The Internal Metrics Audit Function Infographics PDF
This slide defines the graphical representation of internal audit key performance indicators. It is a comparison of the means used to evaluate the performance of the internal audit function. Pitch your topic with ease and precision using this Key Performance Indicators Of The Internal Metrics Audit Function Infographics PDF. This layout presents information on High Variance, Budget To Actual, Audit Functions. It is also available for immediate download and adjustment. So, changes can be made in the color, design, graphics or any other component to create a unique layout.
Instructions Playbook For B2B Sales Executive Sales Management Activities Tracking Dashboard Pictures PDF
This slide provides information regarding sales management activities tracking dashboard to measure closed business, sales pipeline, sales activity by sales rep, month over month growth, forecast by month, etc. Deliver and pitch your topic in the best possible manner with this Instructions Playbook For B2B Sales Executive Sales Management Activities Tracking Dashboard Pictures PDF. Use them to share invaluable insights on Closed Business, Sales Pipeline, Sales Activity and impress your audience. This template can be altered and modified as per your expectations. So, grab it now.
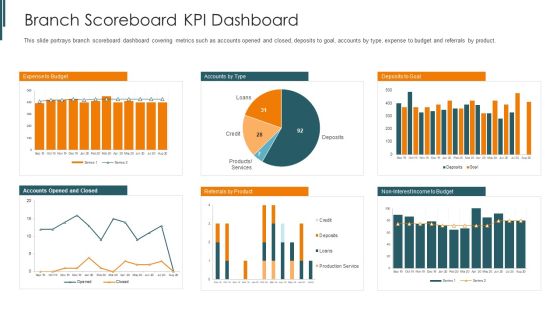
Introduction To Mobile Money In Developing Countries Branch Scoreboard KPI Dashboard Diagrams PDF
This slide portrays branch scoreboard dashboard covering metrics such as accounts opened and closed, deposits to goal, accounts by type, expense to budget and referrals by product. Deliver an awe inspiring pitch with this creative introduction to mobile money in developing countries branch scoreboard kpi dashboard diagrams pdf bundle. Topics like expense to budget, deposits to goal, referrals by product can be discussed with this completely editable template. It is available for immediate download depending on the needs and requirements of the user.

Providing Electronic Financial Services To Existing Consumers Branch Scoreboard Kpi Dashboard Brochure PDF
This slide portrays branch scoreboard dashboard covering metrics such as accounts opened and closed, deposits to goal, accounts by type, expense to budget and referrals by product. Deliver an awe inspiring pitch with this creative Providing Electronic Financial Services To Existing Consumers Branch Scoreboard Kpi Dashboard Brochure PDF bundle. Topics like Product, Budget, Goal, Expense can be discussed with this completely editable template. It is available for immediate download depending on the needs and requirements of the user.

Conducting Monetary Inclusion With Mobile Financial Services Branch Scoreboard Dashboard Sample PDF
This slide portrays branch scoreboard dashboard covering metrics such as accounts opened and closed, deposits to goal, accounts by type, expense to budget and referrals by product. Deliver an awe inspiring pitch with this creative Conducting Monetary Inclusion With Mobile Financial Services Branch Scoreboard Dashboard Sample PDF bundle. Topics like Expense Budget, Referrals Product, Deposits To Goal can be discussed with this completely editable template. It is available for immediate download depending on the needs and requirements of the user.
Method To Estimate Organization Workflow Efficiency Ppt Pictures Icons PDF
This slide illustrates the method to calculate organizational workflow efficiency and provide the current workflow efficiency of organization. It includes total cycle time, value added time, wasted activity time etc. Explore a selection of the finest Method To Estimate Organization Workflow Efficiency Ppt Pictures Icons PDF here. With a plethora of professionally designed and pre made slide templates, you can quickly and easily find the right one for your upcoming presentation. You can use our Method To Estimate Organization Workflow Efficiency Ppt Pictures Icons PDF to effectively convey your message to a wider audience. Slidegeeks has done a lot of research before preparing these presentation templates. The content can be personalized and the slides are highly editable. Grab templates today from Slidegeeks.

Data And Analytics Playbook How To Bridge Business Intelligence And Predictive Graphics PDF
This template depicts that with interactive BI visualization and predictive modeling in the same enterprise analytics platform, organizations can easily collaborate on initiatives that make recommended actions accessible to the business. Deliver and pitch your topic in the best possible manner with this Data And Analytics Playbook How To Bridge Business Intelligence And Predictive Graphics PDF. Use them to share invaluable insights on Probability By Package, Customer Information, Internet Data and impress your audience. This template can be altered and modified as per your expectations. So, grab it now.
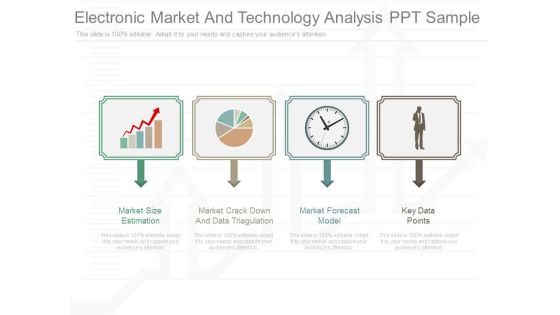
Electronic Market And Technology Analysis Ppt Sample
This is a electrnic market and technology analysis ppt sample. This is a four stage process. The stages in this process are market size estimation, market crack down and data triagulation, market forecast model, key data points.

 Home
Home