Project Snapshot

Guidebook For Executing Business Market Intelligence Statistics Report Showing Market Graphics PDF
This slide presents an statistics reports providing valuable insights of global market based on data collection and analysis. It covers key elements such as forecasted market CAGR, incremental growth, estimated YoY rate, revenue generating market region and key drivers. Do you have to make sure that everyone on your team knows about any specific topic I yes, then you should give Guidebook For Executing Business Market Intelligence Statistics Report Showing Market Graphics PDF a try. Our experts have put a lot of knowledge and effort into creating this impeccable Guidebook For Executing Business Market Intelligence Statistics Report Showing Market Graphics PDF. You can use this template for your upcoming presentations, as the slides are perfect to represent even the tiniest detail. You can download these templates from the Slidegeeks website and these are easy to edit. So grab these today.

Need Of Streamlining Procurement Data Through Analysis Introduction PDF
This template covers the need for procurement analytics in business, such as managing contracts, evaluating vendor delivery timelines, reviewing vendor scorecards, reducing risk, producing and examining multiple datasets, and forecasting the average of whole cycle demand volume. This is a Need Of Streamlining Procurement Data Through Analysis Introduction PDF template with various stages. Focus and dispense information on eight stages using this creative set, that comes with editable features. It contains large content boxes to add your information on topics like Multiple Datasets, Delivery Timelines, Manage Contracts. You can also showcase facts, figures, and other relevant content using this PPT layout. Grab it now.

Steps In Marketing Mix Process Powerpoint Slide Deck
This is a steps in marketing mix process powerpoint slide deck. This is a nine stage process. The stages in this process are market research, communication, implementation, data collection, data analysis, modelling, interpretation, budget allocation, forecasting.
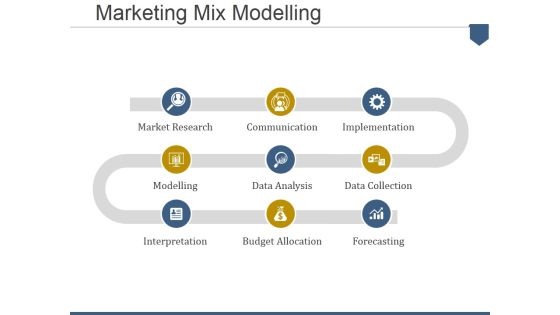
Marketing Mix Modelling Ppt PowerPoint Presentation Portfolio Graphics Template
This is a marketing mix modelling ppt powerpoint presentation portfolio graphics template. This is a three stage process. The stages in this process are market research, communication, implementation, data collection, forecasting, budget allocation, data analysis, modelling, interpretation.

Banking Operation Strategy Dashboard Highlighting Accounts And Product Referrals Inspiration PDF
This slide highlights the banking operation strategy which includes accounts opened and closed, total deposit vs branch goal, accounts by type, expense to budget and referrals by product. Deliver an awe inspiring pitch with this creative Banking Operation Strategy Dashboard Highlighting Accounts And Product Referrals Inspiration PDF bundle. Topics like Expenses To Budget, Income To Budget, Referrals By Product can be discussed with this completely editable template. It is available for immediate download depending on the needs and requirements of the user.

Service Strategy Cycle For Demand Management Ppt Example Of Ppt
This is a service strategy cycle for demand management ppt example of ppt. This is a three stage process. The stages in this process are service transition, service operation, service design, demand forecast, supply plan, marketing strategy, demand management.
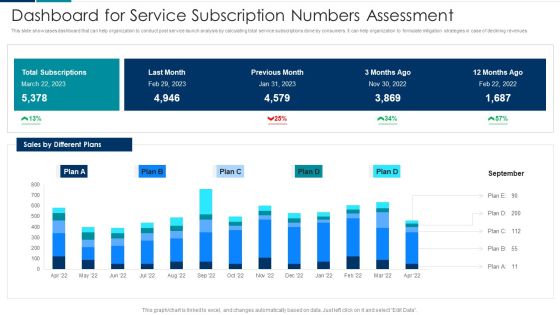
Managing New Service Roll Out And Marketing Procedure Dashboard For Service Subscription Numbers Assessment Clipart PDF
This slide showcases dashboard that can help organization to conduct post service launch analysis by calculating total service subscriptions done by consumers. It can help organization to formulate mitigation strategies in case of declining revenues. Deliver an awe inspiring pitch with this creative Managing New Service Roll Out And Marketing Procedure Dashboard For Service Subscription Numbers Assessment Clipart PDF bundle. Topics like Dashboard For Service, Subscription Numbers Assessment can be discussed with this completely editable template. It is available for immediate download depending on the needs and requirements of the user.

Talent Acquisition Marketing Our Marketing Milestones And Calculating The Return On Lead Generation Inspiration PDF
This slide covers methods of lead generation such as website, advertising, print, TV, local radio, monthly bulletins, referrals, online pay per click etc. along with KPIs such as leads generation per year, average close rate, average selling price, avg. commission etc.Deliver an awe inspiring pitch with this creative Talent Acquisition Marketing Our Marketing Milestones And Calculating The Return On Lead Generation Inspiration PDF bundle. Topics like Advertising Broadcast, Lender Partnerships, Referrals Personal can be discussed with this completely editable template. It is available for immediate download depending on the needs and requirements of the user.

Our Marketing Milestones And Calculating The Return On Lead Generation Brochure PDF
This slide covers methods of lead generation such as website, advertising, print, TV, local radio, monthly bulletins, referrals, online pay per click etc. along with KPIs such as leads generation per year, average close rate, average selling price, avg. commission etc.Deliver an awe inspiring pitch with this creative Our Marketing Milestones And Calculating The Return On Lead Generation Brochure PDF bundle. Topics like Average Commission, Average Close, Average Selling can be discussed with this completely editable template. It is available for immediate download depending on the needs and requirements of the user.
Inbound Recruiting Methodology Our Marketing Milestones And Calculating The Return On Lead Generation Icons PDF
This slide covers methods of lead generation such as website, advertising, print, TV, local radio, monthly bulletins, referrals, online pay per click etc. along with KPIs such as leads generation per year, average close rate, average selling price, avg. commission etc. Deliver and pitch your topic in the best possible manner with this Inbound Recruiting Methodology Our Marketing Milestones And Calculating The Return On Lead Generation Icons PDF. Use them to share invaluable insights on Average Commission, Advertising, Resource and impress your audience. This template can be altered and modified as per your expectations. So, grab it now.

Our Marketing Milestones And Calculating The Return On Lead Generation Microsoft PDF
This slide covers methods of lead generation such as website, advertising, print, TV, local radio, monthly bulletins, referrals, online pay per click etc. along with KPIs such as leads generation per year, average close rate, average selling price, avg. commission etc.Deliver and pitch your topic in the best possible manner with this Our Marketing Milestones And Calculating The Return On Lead Generation Microsoft PDF. Use them to share invaluable insights on Generates Leads, Average Close, Average Selling and impress your audience. This template can be altered and modified as per your expectations. So, grab it now.

AI And ML Driving Monetary Value For Organization AI Based IT Operations Workflow Prediction Inspiration PDF
Following slide covers artificial intelligence-based IT operations workflow. It includes information about data sources, build phase, operational phase and outcomes. Deliver and pitch your topic in the best possible manner with this ai and ml driving monetary value for organization ai based it operations workflow prediction inspiration pdf. Use them to share invaluable insights on data source, infrastructure sensors, outcomes, capacity planning, resource optimization and impress your audience. This template can be altered and modified as per your expectations. So, grab it now.

Assessing Debt And Equity Fundraising Alternatives For Business Growth Financial Dashboard To Evaluate Internal Designs PDF
This slide showcases dashboard that can help organization to calculate the internal rate of return on invested capital. Company can use it to communicate the return on investment to investors. Create an editable Assessing Debt And Equity Fundraising Alternatives For Business Growth Financial Dashboard To Evaluate Internal Designs PDF that communicates your idea and engages your audience. Whether you are presenting a business or an educational presentation, pre designed presentation templates help save time.Assessing Debt And Equity Fundraising Alternatives For Business Growth Financial Dashboard To Evaluate Internal Designs PDF is highly customizable and very easy to edit, covering many different styles from creative to business presentations. Slidegeeks has creative team members who have crafted amazing templates. So, go and get them without any delay.
Essential Retail Store Activities Tracking Dashboard Buyers Preference Management Playbook Background PDF
This slide provides details regarding the dashboard for tracking retail store activities in terms of sales, conversion rate, traffic, average transaction value, recommendations, etc. Deliver and pitch your topic in the best possible manner with this Essential Retail Store Activities Tracking Dashboard Buyers Preference Management Playbook Background PDF. Use them to share invaluable insights on Ensure Staff, Predicted Power, Traffic Today and impress your audience. This template can be altered and modified as per your expectations. So, grab it now.

Annual Cycle For Business Planning Management Information PDF
This slide represents an annual cycle for business planning. It covers strategy alignment, operational planning, financial forecasting etc.Persuade your audience using this Annual Cycle For Business Planning Management Information PDF. This PPT design covers four stages, thus making it a great tool to use. It also caters to a variety of topics including Strategy Alignment, Operational Planning, Financial Forecasting. Download this PPT design now to present a convincing pitch that not only emphasizes the topic but also showcases your presentation skills.
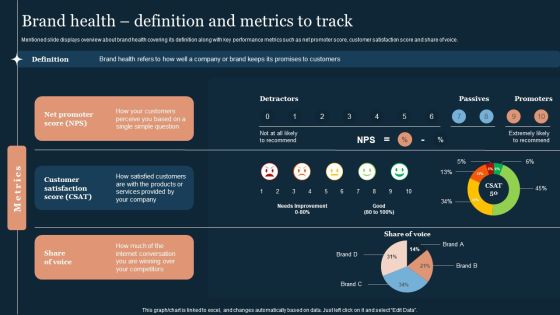
Guide To Develop And Estimate Brand Value Brand Health Definition And Metrics To Track Elements PDF
Mentioned slide displays overview about brand health covering its definition along with key performance metrics such as net promoter score, customer satisfaction score and share of voice.Whether you have daily or monthly meetings, a brilliant presentation is necessary. Guide To Develop And Estimate Brand Value Brand Health Definition And Metrics To Track Elements PDF can be your best option for delivering a presentation. Represent everything in detail using Guide To Develop And Estimate Brand Value Brand Health Definition And Metrics To Track Elements PDF and make yourself stand out in meetings. The template is versatile and follows a structure that will cater to your requirements. All the templates prepared by Slidegeeks are easy to download and edit. Our research experts have taken care of the corporate themes as well. So, give it a try and see the results.

Brand Health Definition And Metrics To Track Brand Value Estimation Guide Mockup PDF
Following slide provides an overview about brand equity by covering its definition and key components such as brand loyalty, awareness, quality, association and experience.Present like a pro with Brand Health Definition And Metrics To Track Brand Value Estimation Guide Mockup PDF Create beautiful presentations together with your team, using our easy-to-use presentation slides. Share your ideas in real-time and make changes on the fly by downloading our templates. So whether you are in the office, on the go, or in a remote location, you can stay in sync with your team and present your ideas with confidence. With Slidegeeks presentation got a whole lot easier. Grab these presentations today.

Budgeting Template 2 Ppt PowerPoint Presentation Portfolio Infographics
This is a budgeting template 2 ppt powerpoint presentation portfolio infographics. This is a three stage process. The stages in this process are table, cost, table, management, analysis.

Product Marketing Performance Assessment Dashboard With Cost Per Conversion Professional PDF
This slide showcases dashboard that can help organization to calculate the return of investment from advertising campaigns. Its key components are top performing advertisement, top performing campaigns, conversion rate, conversion value, click through rate, cost per click and cost per conversion. Showcasing this set of slides titled Product Marketing Performance Assessment Dashboard With Cost Per Conversion Professional PDF. The topics addressed in these templates are Top Performing Advertisement, Top Performing Campaigns, AdWords Conversions. All the content presented in this PPT design is completely editable. Download it and make adjustments in color, background, font etc. as per your unique business setting.
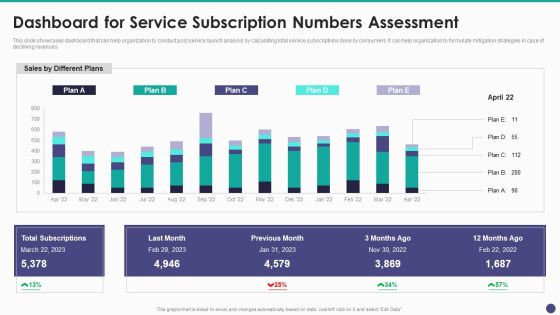
New Service Launch And Development Strategy To Gain Market Share Dashboard For Service Subscription Summary PDF
This slide showcases dashboard that can help organization to conduct post service launch analysis by calculating total service subscriptions done by consumers. It can help organization to formulate mitigation strategies in case of declining revenues.Deliver and pitch your topic in the best possible manner with this New Service Launch And Development Strategy To Gain Market Share Dashboard For Service Subscription Summary PDF Use them to share invaluable insights on Total Subscriptions, Previous Month, Different Plans and impress your audience. This template can be altered and modified as per your expectations. So, grab it now.
Social Media Budget Template Ppt PowerPoint Presentation Icon Mockup
This is a social media budget template ppt powerpoint presentation icon mockup. This is a five stage process. The stages in this process are budget category, in house expense, outsource expense, total category.

Social Media Budget Template Ppt PowerPoint Presentation Layouts Deck
This is a social media budget template ppt powerpoint presentation layouts deck. This is a four stage process. The stages in this process are budget category, writing, graphics, video, outsource expense, total category.

Recruitment Budget Ppt PowerPoint Presentation Infographic Template Brochure
This is a recruitment budget ppt powerpoint presentation infographic template brochure. This is a three stage process. The stages in this process are years of experience, fresher, salary budget, no of employees.
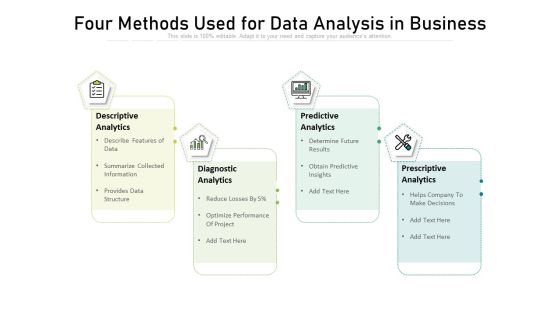
Four Methods Used For Data Analysis In Business Portrait PDF
Persuade your audience using this four methods used for data analysis in business portrait pdf.This PPT design covers four stages, thus making it a great tool to use. It also caters to a variety of topics including descriptive analytics, diagnostic analytics, predictive analytics, prescriptive analytics. Download this PPT design now to present a convincing pitch that not only emphasizes the topic but also showcases your presentation skills.

Data Analytics Management Budget Planning For Big Data Strategy Guidelines PDF
This slide depicts the budget planning for big data and spending on IT solutions, existing staff, hiring process, external technical consulting, and spending on a line of business.Deliver an awe inspiring pitch with this creative Data Analytics Management Budget Planning For Big Data Strategy Guidelines PDF bundle. Topics like Increased Budget, Training Of Existing, Increase Creation can be discussed with this completely editable template. It is available for immediate download depending on the needs and requirements of the user.
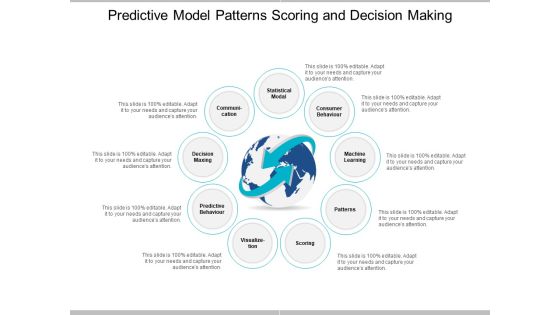
Predictive Model Patterns Scoring And Decision Making Ppt PowerPoint Presentation Pictures Layouts
This is a predictive model patterns scoring and decision making ppt powerpoint presentation pictures layouts. This is a nine stage process. The stages in this process are predictive model, predictive framework, predictive structure.

Business Planning Dashboard In Power Business Intelligence Ppt PowerPoint Presentation File Format Ideas PDF
Presenting this set of slides with name business planning dashboard in power business intelligence ppt powerpoint presentation file format ideas pdf. The topics discussed in these slides are cost, budgets, finance. This is a completely editable PowerPoint presentation and is available for immediate download. Download now and impress your audience.
Integrating AI To Enhance Dashboard For Tracking Impact Of Procurement Process Slides PDF
This slide covers the dashboard for analysing procurement performance after automation. It include KPIs such as on-time delivery, percentage of returns, compliance index percentage, procurement ROI, cost-saving, budget spent on training, etc. Slidegeeks is here to make your presentations a breeze with Integrating AI To Enhance Dashboard For Tracking Impact Of Procurement Process Slides PDF With our easy-to-use and customizable templates, you can focus on delivering your ideas rather than worrying about formatting. With a variety of designs to choose from, youre sure to find one that suits your needs. And with animations and unique photos, illustrations, and fonts, you can make your presentation pop. So whether youre giving a sales pitch or presenting to the board, make sure to check out Slidegeeks first.

Data Automation Procedure Flow For Integrating Platform Ppt PowerPoint Presentation Infographic Template Vector PDF
This slide represents data automation process flow for integration platform which contains user interface and control, identify and extract, calculation, documentation, analyzing and reporting. It can be referred by IT teams to streamlining the processing methods and bring efficiency.Pitch your topic with ease and precision using this Data Automation Procedure Flow For Integrating Platform Ppt PowerPoint Presentation Infographic Template Vector PDF. This layout presents information on Recognizing Device, Component Recognition, Documentation Analyzing. It is also available for immediate download and adjustment. So, changes can be made in the color, design, graphics or any other component to create a unique layout.

Omnichannel Banking Services Platform Dashboard To Track Customers Account Statements Pictures PDF
This slide covers overview of customers account based on different bank products used by customers. It includes elements such as statements for cash and loan accounts, credit cards, expense and budget analysis, bill payments, etc. Want to ace your presentation in front of a live audience Our Omnichannel Banking Services Platform Dashboard To Track Customers Account Statements Pictures PDF can help you do that by engaging all the users towards you. Slidegeeks experts have put their efforts and expertise into creating these impeccable powerpoint presentations so that you can communicate your ideas clearly. Moreover, all the templates are customizable, and easy to edit and downloadable. Use these for both personal and commercial use.

Budgeting Plan Ppt PowerPoint Presentation Show Slide Download
This is a budgeting plan ppt powerpoint presentation show slide download. This is a four stage process. The stages in this process are public relations, web marketing, advertising, press release development, review program.

Information Transformation Process Toolkit Data Analytics Software Features Ideas PDF
This slide represents the key features of predictive data analytics including data mining, data visualization, and modelling etc. This is a Information Transformation Process Toolkit Data Analytics Software Features Ideas PDF template with various stages. Focus and dispense information on eight stages using this creative set, that comes with editable features. It contains large content boxes to add your information on topics like Algorithms, Decision Management, Data Analysis, Data Visualization. You can also showcase facts, figures, and other relevant content using this PPT layout. Grab it now.

Strategic Brand Growth Plan For Market Leadership Market Penetration Rate Calculation Slides PDF
The following slide describes how to calculate market penetration rate of a specific industry to identify untapped market size for business growth. It showcases key components such as number of customers and total addressable market. Slidegeeks is here to make your presentations a breeze with Strategic Brand Growth Plan For Market Leadership Market Penetration Rate Calculation Slides PDF With our easy to use and customizable templates, you can focus on delivering your ideas rather than worrying about formatting. With a variety of designs to choose from, you are sure to find one that suits your needs. And with animations and unique photos, illustrations, and fonts, you can make your presentation pop. So whether you are giving a sales pitch or presenting to the board, make sure to check out Slidegeeks first.

Business Process Diagram Example 3d Men Sitting Around Table Discussion PowerPoint Templates
We present our business process diagram example 3d men sitting around table discussion PowerPoint templates.Use our People PowerPoint Templates because You can Connect the dots. Fan expectations as the whole picture emerges. Present our Leadership PowerPoint Templates because It is Aesthetically crafted by artistic young minds. Our PowerPoint Templates and Slides are designed to display your dexterity. Use our Shapes PowerPoint Templates because Our PowerPoint Templates and Slides help you pinpoint your timelines. Highlight the reasons for your deadlines with their use. Download our Success PowerPoint Templates because You can Stir your ideas in the cauldron of our PowerPoint Templates and Slides. Cast a magic spell on your audience. Download and present our Business PowerPoint Templates because You can Inspire your team with our PowerPoint Templates and Slides. Let the force of your ideas flow into their minds.Use these PowerPoint slides for presentations relating to 3d, armchair, boss, briefing, business, businessmen, cgi, communication, company, concept, conference, corporation, crew, discussion, employees, executive, grey, illustration, leader, manager, many, meeting, men, office, organization, partners, people, person, personnel, project, red, render, session, sitting, staff, strategy, success, table, talking, team, teamwork, tie, white, work, worker. The prominent colors used in the PowerPoint template are Blue, Yellow, Gray. PowerPoint presentation experts tell us our business process diagram example 3d men sitting around table discussion PowerPoint templates are the best it can get when it comes to presenting. Use our businessmen PowerPoint templates and PPT Slides have awesome images to get your point across. You can be sure our business process diagram example 3d men sitting around table discussion PowerPoint templates effectively help you save your valuable time. Presenters tell us our business PowerPoint templates and PPT Slides are aesthetically designed to attract attention. We guarantee that they will grab all the eyeballs you need. You can be sure our business process diagram example 3d men sitting around table discussion PowerPoint templates are visually appealing. Professionals tell us our company PowerPoint templates and PPT Slides provide you with a vast range of viable options. Select the appropriate ones and just fill in your text.

Coffee Shop Business Dashboard Executive Business Plan For Opening A Coffeehouse Ppt Ideas Format PDF
This slide shows the coffee shop business dashboard which includes profit by state, average sales by month, profit, sales by product type, etc. Deliver an awe inspiring pitch with this creative coffee shop business dashboard executive business plan for opening a coffeehouse ppt ideas format pdf bundle. Topics like executive, dashboard, sales, budgeted can be discussed with this completely editable template. It is available for immediate download depending on the needs and requirements of the user.

Stock Photo Backdrop Of Pine Trees PowerPoint Slide
To give more outlook of nature ,we have designed this image. In this image we have used graphic of pine trees which shows the nature theme. Use this image in nature and environment related presentations.
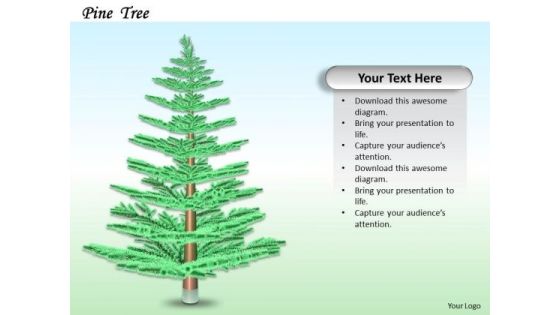
Stock Photo Creative Design Of Pine Tree PowerPoint Slide
To give more outlook of nature ,we have designed this image. In this image we have used graphic of pine tree which shows the nature theme. Use this image in nature and environment related presentations.

Stock Photo Illustration Of Pine Tree PowerPoint Slide
To give more outlook of nature ,we have designed this image. In this image we have used graphic of pine tree which shows the nature theme. Use this image in nature and environment related presentations.

Information Science Domains Where Data Science Is Creating Its Impression Ppt PowerPoint Presentation Icon Backgrounds PDF
This slide represents the data science impression in various domains such as marketing, upselling, social media, automation, travel, sales, credit and insurance, and healthcare.Deliver and pitch your topic in the best possible manner with this Information Science Domains Where Data Science Is Creating Its Impression Ppt PowerPoint Presentation Icon Backgrounds PDF. Use them to share invaluable insights on Disease Prediction, Medication Effectiveness, Demand Forecasting and impress your audience. This template can be altered and modified as per your expectations. So, grab it now.

Cost Estimation For Photo Exhibition Proposal One Pager Sample Example Document
Following slide displays the details of estimation cost proposed by the sender for organizing the exhibition event. Presenting you an exemplary Cost Estimation For Photo Exhibition Proposal One Pager Sample Example Document. Our one-pager comprises all the must-have essentials of an inclusive document. You can edit it with ease, as its layout is completely editable. With such freedom, you can tweak its design and other elements to your requirements. Download this Cost Estimation For Photo Exhibition Proposal One Pager Sample Example Document brilliant piece now.

Data Analytics In Healthcare Department Ppt Outline Demonstration
This slide depicts the role of data science in healthcare departments and its benefits in different ways, such as image analysis, drug discovery, genetics and Genomics, predictive diagnosis, and NLP. Presenting data analytics in healthcare department ppt outline demonstration to provide visual cues and insights. Share and navigate important information on five stages that need your due attention. This template can be used to pitch topics like data analytics in healthcare department. In addtion, this PPT design contains high resolution images, graphics, etc, that are easily editable and available for immediate download.

Employer Brand Marketing On Social Media Platform Our Marketing Milestones And Calculating Information PDF
This slide covers strategy and reasons to optimize the career sites pages such as to highlight company website, showcase culture by adding videos, adding recruitment hashtags etc. Slidegeeks is here to make your presentations a breeze with Employer Brand Marketing On Social Media Platform Our Marketing Milestones And Calculating Information PDF With our easy-to-use and customizable templates, you can focus on delivering your ideas rather than worrying about formatting. With a variety of designs to choose from, you are sure to find one that suits your needs. And with animations and unique photos, illustrations, and fonts, you can make your presentation pop. So whether you are giving a sales pitch or presenting to the board, make sure to check out Slidegeeks first.

Workplace Conflict Resolution Calculating The Total Cost Of Workplace Conflict Graphics PDF
The purpose of this slide is to outline the total cost incurred by the organization due to several conflicts. The slide provides information about major components such as person, team and organization. Slidegeeks is here to make your presentations a breeze with Workplace Conflict Resolution Calculating The Total Cost Of Workplace Conflict Graphics PDF With our easy-to-use and customizable templates, you can focus on delivering your ideas rather than worrying about formatting. With a variety of designs to choose from, youre sure to find one that suits your needs. And with animations and unique photos, illustrations, and fonts, you can make your presentation pop. So whether youre giving a sales pitch or presenting to the board, make sure to check out Slidegeeks first.

Assessment Of Amazon Brand Performance Dashboard To Track Amazon Web Guidelines PDF
This slide provides information regarding the dashboard to monitor AWS performance. The KPIs include tracking daily cost, hosting MTD, total vs. budget, on-demand vs. reservations, etc. Create an editable Assessment Of Amazon Brand Performance Dashboard To Track Amazon Web Guidelines PDF that communicates your idea and engages your audience. Whether you are presenting a business or an educational presentation, pre-designed presentation templates help save time. Assessment Of Amazon Brand Performance Dashboard To Track Amazon Web Guidelines PDF is highly customizable and very easy to edit, covering many different styles from creative to business presentations. Slidegeeks has creative team members who have crafted amazing templates. So, go and get them without any delay.

Key Metrics Hotel Administration Management Restaurant Business Startup Budget Diagrams PDF
Presenting this set of slides with name key metrics hotel administration management restaurant business startup budget diagrams pdf. This is a one stage process. The stages in this process are development, social media, market, costs, initial. This is a completely editable PowerPoint presentation and is available for immediate download. Download now and impress your audience.

Evolving Strategy For Financial Partnership Company Rules PDF
This slide depicts evolving strategy for financial institute illustrating reporter, controller, analyzer, influencer and strategic partner to create real value and financial planning.Presenting Evolving Strategy For Financial Partnership Company Rules PDF to dispense important information. This template comprises five stages. It also presents valuable insights into the topics including Historical Analysis, Reporting For Data Interpretation, Forecasting For Budget Preparation This is a completely customizable PowerPoint theme that can be put to use immediately. So, download it and address the topic impactfully.

Applications Of Big Data In Social Media Analytics Graphics PDF
This slide showcases use of big data in various fields and industries. This template focuses on connecting people and bringing them closer to one another through medium of social media. It includes information related to target audience, privacy concerns, etc. Showcasing this set of slides titled Applications Of Big Data In Social Media Analytics Graphics PDF Brochure. The topics addressed in these templates are Target Audience, Predictive Analysis, Performance Evaluation. All the content presented in this PPT design is completely editable. Download it and make adjustments in color, background, font etc. as per your unique business setting.
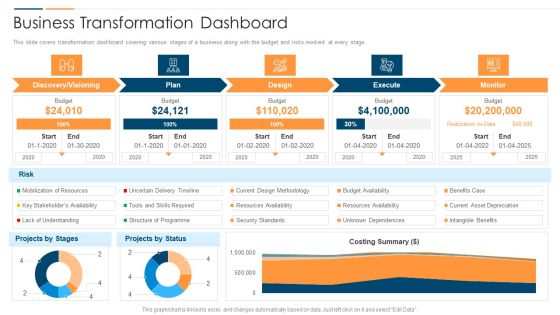
Revolution In Online Business Business Transformation Dashboard Ppt PowerPoint Presentation Gallery Structure PDF
This slide covers transformation dashboard covering various stages of a business along with the budget and risks involved at every stage. Deliver an awe inspiring pitch with this creative Revolution In Online Business Business Transformation Dashboard Ppt PowerPoint Presentation Gallery Structure PDF bundle. Topics like Discovery Visioning Plan, Design Execute Monitor can be discussed with this completely editable template. It is available for immediate download depending on the needs and requirements of the user.

Workflow Automation For Optimizing Organizational Processes Method To Estimate Organization Workflow Guidelines PDF
This slide illustrates the method to calculate organizational workflow efficiency and provide the current workflow efficiency of organization. It includes total cycle time, value added time, wasted activity time etc. The Workflow Automation For Optimizing Organizational Processes Method To Estimate Organization Workflow Guidelines PDF is a compilation of the most recent design trends as a series of slides. It is suitable for any subject or industry presentation, containing attractive visuals and photo spots for businesses to clearly express their messages. This template contains a variety of slides for the user to input data, such as structures to contrast two elements, bullet points, and slides for written information. Slidegeeks is prepared to create an impression.
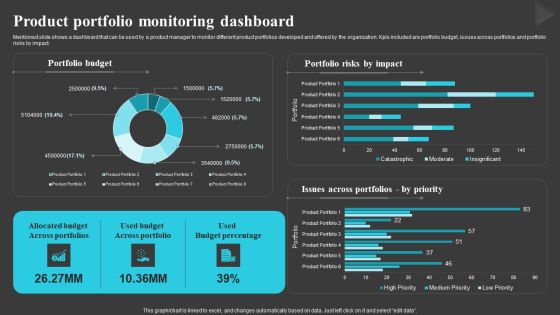
Product Portfolio Monitoring Dashboard Creating And Offering Multiple Product Ranges In New Business Diagrams PDF
Mentioned slide shows a dashboard that can be used by a product manager to monitor different product portfolios developed and offered by the organization. Kpis included are portfolio budget, issues across portfolios and portfolio risks by impact.Crafting an eye-catching presentation has never been more straightforward. Let your presentation shine with this tasteful yet straightforward Product Portfolio Monitoring Dashboard Creating And Offering Multiple Product Ranges In New Business Diagrams PDF template. It offers a minimalistic and classy look that is great for making a statement. The colors have been employed intelligently to add a bit of playfulness while still remaining professional. Construct the ideal Product Portfolio Monitoring Dashboard Creating And Offering Multiple Product Ranges In New Business Diagrams PDF that effortlessly grabs the attention of your audience Begin now and be certain to wow your customers.

Customer Relationship Strategy For Building Loyalty Business Revenue Dashboard Icons PDF
This slide highlights business dashboard with multiple statistics to estimate the revenue and profitability of company as a result of new customer intimacy strategy. Deliver an awe inspiring pitch with this creative customer relationship strategy for building loyalty business revenue dashboard icons pdf bundle. Topics like average revenue per customer, compared to previous year, customer acquisition cost, cac vs customer lifetime value, revenue can be discussed with this completely editable template. It is available for immediate download depending on the needs and requirements of the user.

Tactical Procedure For Increasing Customer Intimacy Business Revenue Dashboard Diagrams PDF
This slide highlights business dashboard with multiple statistics to estimate the revenue and profitability of company as a result of new customer intimacy strategy. Deliver an awe inspiring pitch with this creative tactical procedure for increasing customer intimacy business revenue dashboard diagrams pdf bundle. Topics like average revenue per customer, compared to previous year, customer acquisition cost, cac vs customer lifetime value, revenue can be discussed with this completely editable template. It is available for immediate download depending on the needs and requirements of the user.

Post Implementation Other Operation And Financial Kpis Summary PDF
The slide provides five years graphs 2022F to 2026F forecasted number of major KPIs key performance indicators, that might help to track the performance of ABC Railway. Covered KPIs include Revenue, Total Passengers, operating income, customer satisfaction rate etc.Deliver and pitch your topic in the best possible manner with this post implementation other operation and financial KPIs summary pdf. Use them to share invaluable insights on total passengers, operating income, revenue, 2022 to 2026 and impress your audience. This template can be altered and modified as per your expectations. So, grab it now.

Post Implementation Other Operation And Financial Kpis Inspiration PDF
The slide provides five years graphs 2022F-2026F forecasted number of major KPIs key performance indicators, that might help to track the performance of ABC Railway. Covered KPIs include Revenue, Total Passengers, operating income, customer satisfaction rate etc. Deliver and pitch your topic in the best possible manner with this post implementation other operation and financial kpis inspiration pdf. Use them to share invaluable insights on revenue, operating income, customer satisfaction and impress your audience. This template can be altered and modified as per your expectations. So, grab it now.

Maintenance Administration Budget Allocation For Production Plant Maintenance Pictures PDF
The purpose of this slide is to showcase the budget allocation details for production plant maintenance. It provides information regarding the budget allocated and estimated cost related to manufacturing plant building and machines repairs. Boost your pitch with our creative Maintenance Administration Budget Allocation For Production Plant Maintenance Pictures PDF. Deliver an awe-inspiring pitch that will mesmerize everyone. Using these presentation templates you will surely catch everyones attention. You can browse the ppts collection on our website. We have researchers who are experts at creating the right content for the templates. So you dont have to invest time in any additional work. Just grab the template now and use them.

Medical Inventory Management System Dashboard For Managing Patient Capacity And Beds Inspiration PDF
This slide shows the dashboard for managing patient capacity and beds which includes occupancy, alerts, etc, with total number of available beds, discharges, admissions and estimated ones.Deliver an awe inspiring pitch with this creative medical inventory management system dashboard for managing patient capacity and beds inspiration pdf bundle. Topics like dashboard for managing patient capacity and beds can be discussed with this completely editable template. It is available for immediate download depending on the needs and requirements of the user.
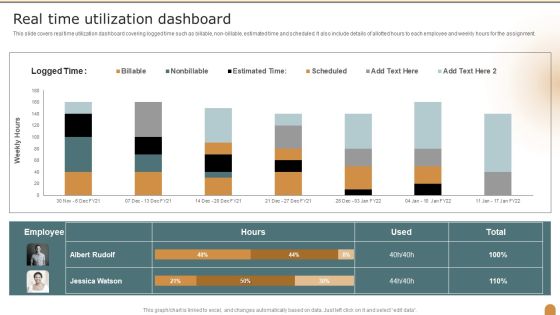
Real Time Utilization Dashboard Company Performance Evaluation Using KPI Clipart PDF
This slide covers real time utilization dashboard covering logged time such as billable, non-billable, estimated time and scheduled. It also include details of allotted hours to each employee and weekly hours for the assignment. Deliver an awe inspiring pitch with this creative Real Time Utilization Dashboard Company Performance Evaluation Using KPI Clipart PDF bundle. Topics like Real Time, Utilization Dashboard can be discussed with this completely editable template. It is available for immediate download depending on the needs and requirements of the user.

Types Of Big Data Analytics Procedure For Effective Decision Making Microsoft PDF
This slide illustrate four different types of big data analysis processes along with their tools used and business applications. It includes analysis such as descriptive, diagnostic, predictive and prescriptive Pitch your topic with ease and precision using this Types Of Big Data Analytics Procedure For Effective Decision Making Microsoft PDF. This layout presents information on Descriptive Analysis, Diagnostic Analysis, Predictive Analysis. It is also available for immediate download and adjustment. So, changes can be made in the color, design, graphics or any other component to create a unique layout.

Data Interpretation And Analysis Playbook How To Fix The Business Intelligence Problem Data Analytics Playbook Sample PDF
This template covers the solution for BI problems such as analytics transformation and business intelligence program. It also depicts that switching to next-generation analytics platform that gives business users data-driven insights. Presenting data interpretation and analysis playbook how to fix the business intelligence problem data analytics playbook sample pdf to provide visual cues and insights. Share and navigate important information on six stages that need your due attention. This template can be used to pitch topics like analytics, business intelligence, predictive analytics. In addtion, this PPT design contains high resolution images, graphics, etc, that are easily editable and available for immediate download.
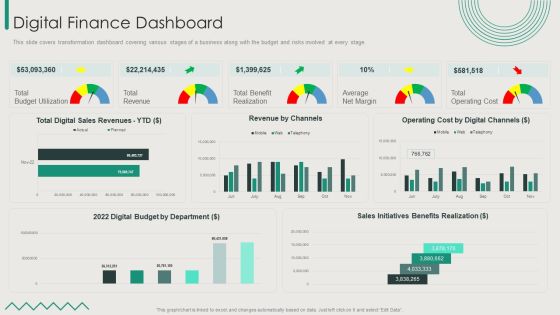
Organization Transition Digital Finance Dashboard Ppt PowerPoint Presentation File Good PDF
This slide covers transformation dashboard covering various stages of a business along with the budget and risks involved at every stage. Deliver and pitch your topic in the best possible manner with this Organization Transition Digital Finance Dashboard Ppt PowerPoint Presentation File Good PDF. Use them to share invaluable insights on Total Budget Utilization, Total Revenue, Total Benefit Realization and impress your audience. This template can be altered and modified as per your expectations. So, grab it now.

 Home
Home