Project Snapshot

Arrow With Word Business PowerPoint Templates Ppt Background For Slides 1112
We present our Arrow With Word Business PowerPoint Templates PPT Background For Slides 1112.Use our Signs PowerPoint Templates because, With the help of our Slides you can Illustrate these thoughts with this slide. Use our Business PowerPoint Templates because,Project your ideas to you colleagues and complete the full picture Use our Success PowerPoint Templates because,The choices you make today will determine the future growth of your enterprise. Use our Shapes PowerPoint Templates because,you can put it up there for all to see. Use our Arrows PowerPoint Templates because,They will Amplify your plans to have dedicated sub groups working on related but distinct tasks.Use these PowerPoint slides for presentations relating to Arrow with word business, arrows, shapes, success, business, signs. The prominent colors used in the PowerPoint template are Yellow, Green, Gray

Puzzle Linear Flow Process 8 Stages PowerPoint Transformer Templates
We present our puzzle linear flow process 8 stages PowerPoint transformer templates.Use our Business PowerPoint Templates because,Project your ideas to you colleagues and complete the full picture Use our Puzzles or Jigsaws PowerPoint Templates because,Using our templates for your colleagues will impart knowledge tofeed. Use our Communication PowerPoint Templates because,Your business and plans for its growth consist of processes that are highly co-related. Use our Shapes PowerPoint Templates because,There are so many different pieces to the puzzle. Use our Success PowerPoint Templates because,You know that the core of any organisation is the people who work for it.Use these PowerPoint slides for presentations relating to abstract, action, attach, box, business, center, chain, chart, communication, concept, connection, cube, cycle, data, diagram, flow, horizontal, illustration, individual, interaction, jigsaw, join, link, merge, puzzle, relation, relationship, search, shape, silhouette, success. The prominent colors used in the PowerPoint template are Purple, White, Gray
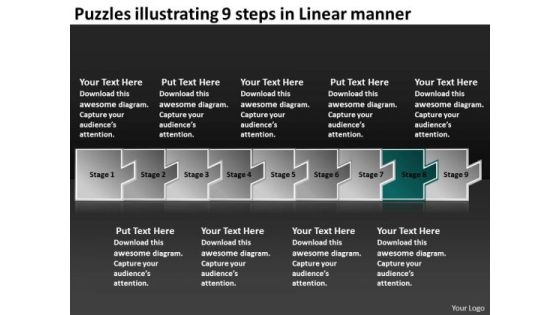
Puzzles Illustrating 9 Steps Linear Manner Flow Charting PowerPoint Templates
We present our puzzles illustrating 9 steps linear manner flow charting PowerPoint templates.Use our Business PowerPoint Templates because,Project your ideas to you colleagues and complete the full picture Use our Design PowerPoint Templates because, This is Aesthetically designed to make a great first impression this template highlights . Use our Marketing PowerPoint Templates because,It demonstrates the seeds of many of our successes. Use our Shapes PowerPoint Templates because, You are going along well but your foresight shows that it may need a slight change in plans or direction. Use our Metaphor PowerPoint Templates because,Readymade PowerPoint templates can prove best of your knowledge for your slides to show.Use these PowerPoint slides for presentations relating to abstract, arrow, arrows, business, chart, design, development, diagram, direction, element, flow, flowchart, graph, linear, management, model, motion, organization, plan, process, program, section, segment, set, sign, solution, strategy, symbol, technology. The prominent colors used in the PowerPoint template are Blue, White, Gray

Decentralization App Development Process Of Dapp Development Infographics PDF
This slide represents the five stages of DApp development which includes defining the environment, setting up the project, coding the app, deploying and testing, and finally launching the app. This modern and well arranged Decentralization App Development Process Of Dapp Development Infographics PDF provides lots of creative possibilities. It is very simple to customize and edit with the Powerpoint Software. Just drag and drop your pictures into the shapes. All facets of this template can be edited with Powerpoint no extra software is necessary. Add your own material, put your images in the places assigned for them, adjust the colors, and then you can show your slides to the world, with an animated slide included.
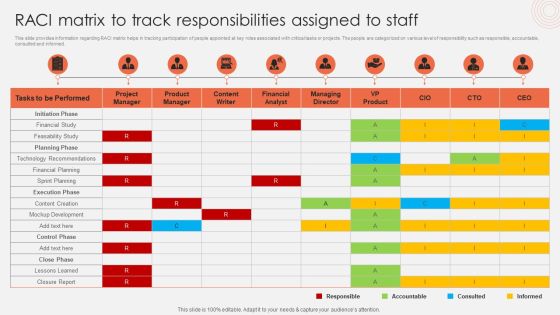
Raci Matrix To Track Responsibilities Assigned To Staff Slides PDF
This slide provides information regarding RACI matrix helps in tracking participation of people appointed at key roles associated with critical tasks or projects. The people are categorized on various level of responsibility such as responsible, accountable, consulted and informed. This modern and well arranged Raci Matrix To Track Responsibilities Assigned To Staff Slides PDF provides lots of creative possibilities. It is very simple to customize and edit with the Powerpoint Software. Just drag and drop your pictures into the shapes. All facets of this template can be edited with Powerpoint no extra software is necessary. Add your own material, put your images in the places assigned for them, adjust the colors, and then you can show your slides to the world, with an animated slide included.
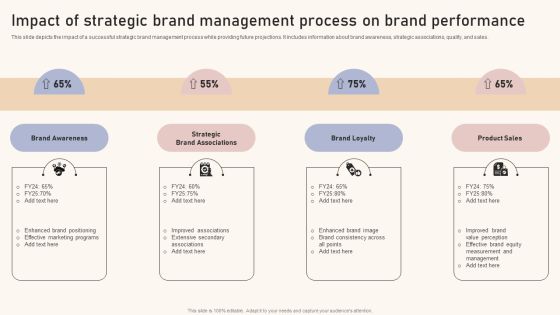
Optimizing Brand Equity Through Strategic Management Impact Of Strategic Brand Management Process Infographics PDF
This slide depicts the impact of a successful strategic brand management process while providing future projections. It includes information about brand awareness, strategic associations, quality, and sales. This modern and well-arranged Optimizing Brand Equity Through Strategic Management Impact Of Strategic Brand Management Process Infographics PDF provides lots of creative possibilities. It is very simple to customize and edit with the Powerpoint Software. Just drag and drop your pictures into the shapes. All facets of this template can be edited with Powerpoint, no extra software is necessary. Add your own material, put your images in the places assigned for them, adjust the colors, and then you can show your slides to the world, with an animated slide included.

CRM System Deployment Plan CRM Dashboard For Tracking Sales Pipeline Pictures PDF
This slide covers the CRM KPI dashboard for monitoring lead status in the sales funnel. It includes metrics such as open pipeline value, open pipeline by product package, pipeline value forecast, etc. Deliver an awe inspiring pitch with this creative CRM System Deployment Plan CRM Dashboard For Tracking Sales Pipeline Pictures PDF bundle. Topics like Pipeline Value Forecast, Open Pipeline Value, Branding can be discussed with this completely editable template. It is available for immediate download depending on the needs and requirements of the user.
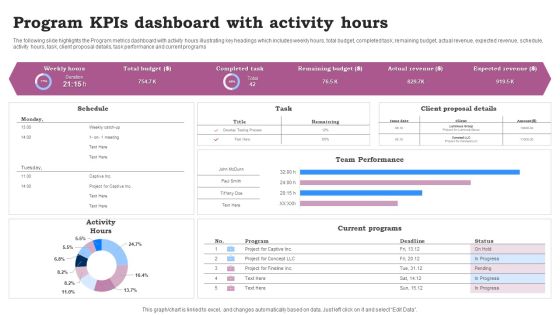
Program Kpis Dashboard With Activity Hours Ppt Infographics Clipart Images PDF
The following slide highlights the Program metrics dashboard with activity hours illustrating key headings which includes weekly hours, total budget, completed task, remaining budget, actual revenue, expected revenue, schedule, activity hours, task, client proposal details, task performance and current programs. Pitch your topic with ease and precision using this Program Kpis Dashboard With Activity Hours Ppt Infographics Clipart Images PDF. This layout presents information on Team Performance, Current Programs, Activity Hours. It is also available for immediate download and adjustment. So, changes can be made in the color, design, graphics or any other component to create a unique layout.
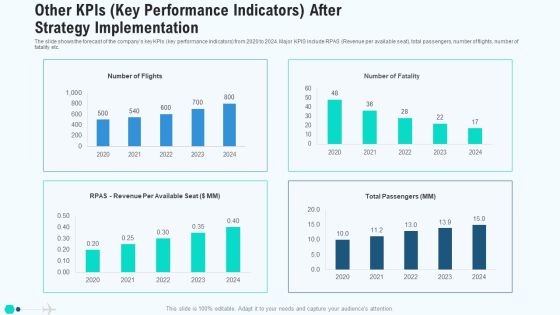
Other Kpis Key Performance Indicators After Strategy Implementation Mockup PDF
The slide shows the forecast of the companys key KPIs key performance indicators from 2020 to 2024. Major KPIS include RPAS Revenue per available seat, total passengers, number of flights, number of fatality etc. Deliver and pitch your topic in the best possible manner with this other kpis key performance indicators after strategy implementation mockup pdf. Use them to share invaluable insights on other kpis key performance indicators after strategy implementation and impress your audience. This template can be altered and modified as per your expectations. So, grab it now.
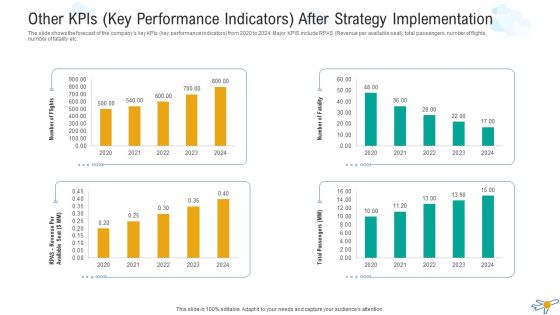
Other Kpis Key Performance Indicators After Strategy Implementation Microsoft PDF
The slide shows the forecast of the companys key KPIs key performance indicators from 2020 to 2024. Major KPIS include RPAS Revenue per available seat, total passengers, number of flights, number of fatality etc. Deliver and pitch your topic in the best possible manner with this other kpis key performance indicators after strategy implementation microsoft pdf. Use them to share invaluable insights on other kpis key performance indicators after strategy implementation and impress your audience. This template can be altered and modified as per your expectations. So, grab it now.

Other Kpis Key Performance Indicators After Strategy Implementation Infographics PDF
The slide shows the forecast of the companys key KPIs key performance indicators from 2020 to 2024. Major KPIS include RPAS Revenue per available seat, total passengers, number of flights, number of fatality etc. Deliver and pitch your topic in the best possible manner with this other kpis key performance indicators after strategy implementation infographics pdf. Use them to share invaluable insights on other kpis key performance indicators after strategy implementation and impress your audience. This template can be altered and modified as per your expectations. So, grab it now.

Predictive Data Model Time Series Model Of Predictive Analytics Infographics PDF
This slide talks about the time series model of predictive analytics that makes future outcome predictions by taking time as input. This model can be implemented in customer support services and healthcare industries to predict the expected number of queries or patients. Slidegeeks is here to make your presentations a breeze with Predictive Data Model Time Series Model Of Predictive Analytics Infographics PDF With our easy-to-use and customizable templates, you can focus on delivering your ideas rather than worrying about formatting. With a variety of designs to choose from, you are sure to find one that suits your needs. And with animations and unique photos, illustrations, and fonts, you can make your presentation pop. So whether you are giving a sales pitch or presenting to the board, make sure to check out Slidegeeks first
Employee Engagement Tools To Predict HR Attrition Elements PDF
Following slide provides the employee engagement tools which can be incorporated in company dashboard in order to track employee behavior. The tools covered are employee mood score, engagement trends, topic analysis, action planning and trend forecasting. Persuade your audience using this Employee Engagement Tools To Predict HR Attrition Elements PDF. This PPT design covers five stages, thus making it a great tool to use. It also caters to a variety of topics including Employee Mood Score, Engagement Trends, Topic Analysis. Download this PPT design now to present a convincing pitch that not only emphasizes the topic but also showcases your presentation skills.

Stock Photo Business Strategy Consulting Calculator With Piggy Bank Photos
Double Up Our stock photo business strategy consulting calculator with piggy bank stock photo photos Powerpoint Templates With Your Thoughts. They Will Make An Awesome Pair. When In Doubt Use Our finance Powerpoint Templates. The Way Ahead Will Become Crystal Clear.

Key Steps In Financial Planning Process Ppt Slide Show
This is a key steps in financial planning process ppt slide show. This is a six stage process. The stages in this process are review and report, implement the plan, create and present solution in a plan, define the relationship, gather data and agree goals, analysis and evaluation, the financial planning process.
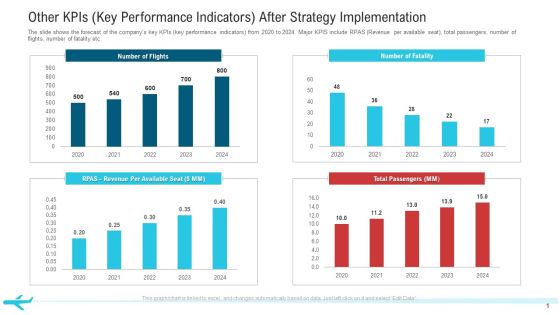
Other Kpis Key Performance Indicators After Strategy Implementation Professional PDF
The slide shows the forecast of the companys key KPIs key performance indicators from 2020 to 2024. Major KPIS include RPAS Revenue per available seat, total passengers, number of flights, number of fatality etc.Deliver and pitch your topic in the best possible manner with this other KPIs key performance indicators after strategy implementation professional pdf. Use them to share invaluable insights on total passengers, number of flights, 2020 to 2024 and impress your audience. This template can be altered and modified as per your expectations. So, grab it now.
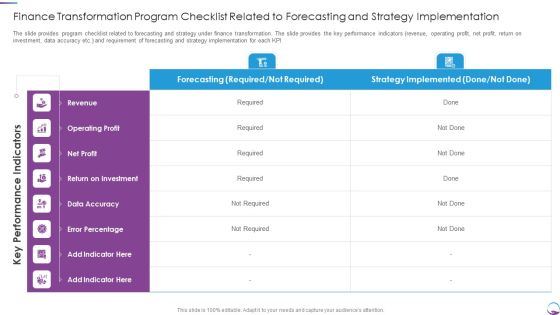
Finance Transformation Program Checklist Related To Forecasting And Strategy Implementation Pictures PDF
The slide provides program checklist related to forecasting and strategy under finance transformation. The slide provides the key performance indicators revenue, operating profit, net profit, return on investment, data accuracy etc. and requirement of forecasting and strategy implementation for each KPI. Deliver and pitch your topic in the best possible manner with this Finance Transformation Program Checklist Related To Forecasting And Strategy Implementation Pictures PDF. Use them to share invaluable insights on Finance Transformation Program Checklist Related To Forecasting And Strategy Implementation and impress your audience. This template can be altered and modified as per your expectations. So, grab it now.

Financial Forecast After Process Improvement Develop Organizational Productivity By Enhancing Business Process Brochure PDF
The slide provides the financial forecast of the company after the process improvement. Major KPIs key performance indicators covered in the slide are total revenue, interest income, number of customers, customer churn rate, online banking users, customer satisfaction rate etc. Deliver an awe inspiring pitch with this creative financial forecast after process improvement develop organizational productivity by enhancing business process brochure pdf bundle. Topics like revenue, interest income, performance indicator, actual, target can be discussed with this completely editable template. It is available for immediate download depending on the needs and requirements of the user.
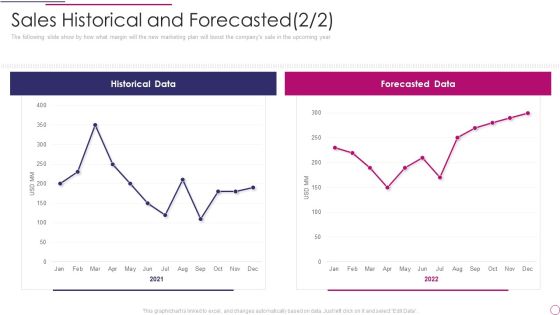
Performance Analysis Of New Product Development Sales Historical And Forecasted Data Rules PDF
The following slide show by how what margin will the new marketing plan will boost the companys sale in the upcoming year. Deliver and pitch your topic in the best possible manner with this performance analysis of new product development sales historical and forecasted data rules pdf. Use them to share invaluable insights on historical data, forecasted data and impress your audience. This template can be altered and modified as per your expectations. So, grab it now.
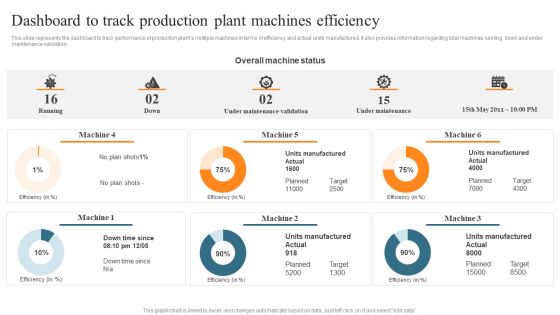
Leveraging Predictive Maintenance To Enhance Production Process Dashboard To Track Production Plant Machines Efficiency Template PDF
Do you have to make sure that everyone on your team knows about any specific topic I yes, then you should give Leveraging Predictive Maintenance To Enhance Production This slide presents a dashboard to showcase the existing operational efficiency of production plant by covering multiple KPIs such as throughput, inventory turns, scarp rate and production target attainment Process Dashboard To Track Production Plant Machines Efficiency Template PDF a try. Our experts have put a lot of knowledge and effort into creating this impeccable Leveraging Predictive Maintenance To Enhance Production Process Dashboard To Track Production Plant Machines Efficiency Template PDF. You can use this template for your upcoming presentations, as the slides are perfect to represent even the tiniest detail. You can download these templates from the Slidegeeks website and these are easy to edit. So grab these today.

Introduction To Predictive Analytics Technology Forward Looking Analysis IT Structure PDF
This slide represents the predictive analytics introduction that is used for forecasts action, behaviors, and trends using recent and past information. It performs the operations such as data mining, text analytics, statistics, and modeling on structured and unstructured data.Get a simple yet stunning designed Introduction To Predictive Analytics Technology Forward Looking Analysis IT Structure PDF. It is the best one to establish the tone in your meetings. It is an excellent way to make your presentations highly effective. So, download this PPT today from Slidegeeks and see the positive impacts. Our easy-to-edit Introduction To Predictive Analytics Technology Forward Looking Analysis IT Structure PDF can be your go-to option for all upcoming conferences and meetings. So, what are you waiting for Grab this template today.

Data Interpretation And Analysis Playbook Business Intelligence And Predictive Analytics Challenges Template PDF
This template covers the problems while implementing BI and predictive analytics in the organization. The challenges are undefined KPIs and metrics, and unable to hire right data science talent. Presenting data interpretation and analysis playbook business intelligence and predictive analytics challenges template pdf to provide visual cues and insights. Share and navigate important information on two stages that need your due attention. This template can be used to pitch topics like security vulnerabilities, operationalizing, perform analysis, deployed. In addtion, this PPT design contains high resolution images, graphics, etc, that are easily editable and available for immediate download.

Calculate Facebook Key Performance Indicator The Specific Campaign Details Introduction PDF
Showcasing this set of slides titled calculate facebook key performance indicator the specific campaign details introduction pdf. The topics addressed in these templates are calculate facebook key performance indicator the specific campaign details. All the content presented in this PPT design is completely editable. Download it and make adjustments in color, background, font etc. as per your unique business setting.

Administered Data And Analytic Quality Playbook Business Intelligence And Predictive Download PDF
This template covers the problems while implementing BI and predictive analytics in the organization. The challenges are undefined KPIs and metrics, and unable to hire right data science talent. Deliver and pitch your topic in the best possible manner with this Administered Data And Analytic Quality Playbook Business Intelligence And Predictive Download PDF Use them to share invaluable insights on Common Misconception, Operationalizing, Production Deployment and impress your audience. This template can be altered and modified as per your expectations. So, grab it now.

HR Budget Vs Actual KPI Dashboard Ppt PowerPoint Presentation File Structure PDF
The given below slide highlights the key metrics of HR budget to manage expense stream and take assist decision making. It includes KPAs such as month wise variations in budget, total amount allocated, actual expenditures etc. Pitch your topic with ease and precision using this HR Budget Vs Actual KPI Dashboard Ppt PowerPoint Presentation File Structure PDF. This layout presents information on Amount Allocated, Expenses by Heads, Budget Achieved. It is also available for immediate download and adjustment. So, changes can be made in the color, design, graphics or any other component to create a unique layout.
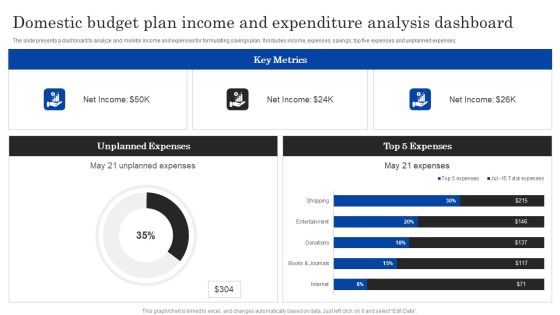
Domestic Budget Plan Income And Expenditure Analysis Dashboard Ppt PowerPoint Presentation Layouts Clipart Images PDF
The slide presents a dashboard to analyze and monitor income and expenses for formulating savings plan. It includes income, expenses, savings, top five expenses and unplanned expenses.Pitch your topic with ease and precision using this Domestic Budget Plan Income And Expenditure Analysis Dashboard Ppt PowerPoint Presentation Layouts Clipart Images PDF. This layout presents information on Unplanned Expenses, Expenses, Key Metrics. It is also available for immediate download and adjustment. So, changes can be made in the color, design, graphics or any other component to create a unique layout.
Expenditure Assessment Icon For Budget Planning Topics PDF
Presenting Expenditure Assessment Icon For Budget Planning Topics PDF to dispense important information. This template comprises Four stages. It also presents valuable insights into the topics including Expenditure Assessment, Icon For Budget Planning. This is a completely customizable PowerPoint theme that can be put to use immediately. So, download it and address the topic impactfully.

Business Operational Expenditure Monitoring Dashboard With Budget Analysis Icons PDF
This slide shows operating expenses OPEX monitoring dashboard with budget analysis assisting companies in evaluating funds useful until end of the year. It visually present the organizations operating expenses by time period and sector. Showcasing this set of slides titled Business Operational Expenditure Monitoring Dashboard With Budget Analysis Icons PDF. The topics addressed in these templates are Business Operational, Budget Analysis, Monitoring Dashboard. All the content presented in this PPT design is completely editable. Download it and make adjustments in color, background, font etc. as per your unique business setting.

ROI Calculation Ppt PowerPoint Presentation Complete Deck With Slides
This is a roi calculation ppt powerpoint presentation complete deck with slides. This is a one stage process. The stages in this process are business, planning, strategy, marketing, management.

Methods Of Data Clustering In Predictive Analytics Forward Looking Analysis IT Professional PDF
This slide outlines the two primary information clustering methods used in the predictive analytics clustering model. The methods include K-means and K-nearest neighbor clustering, including the working of both approaches.Slidegeeks is here to make your presentations a breeze with Methods Of Data Clustering In Predictive Analytics Forward Looking Analysis IT Professional PDF With our easy-to-use and customizable templates, you can focus on delivering your ideas rather than worrying about formatting. With a variety of designs to choose from, you are sure to find one that suits your needs. And with animations and unique photos, illustrations, and fonts, you can make your presentation pop. So whether you are giving a sales pitch or presenting to the board, make sure to check out Slidegeeks first.

Business Management Dashboards Budget Ppt Diagram Lists PDF
Deliver and pitch your topic in the best possible manner with this business management dashboards budget ppt diagram lists pdf. Use them to share invaluable insights on budget, income, expenses and impress your audience. This template can be altered and modified as per your expectations. So, grab it now.
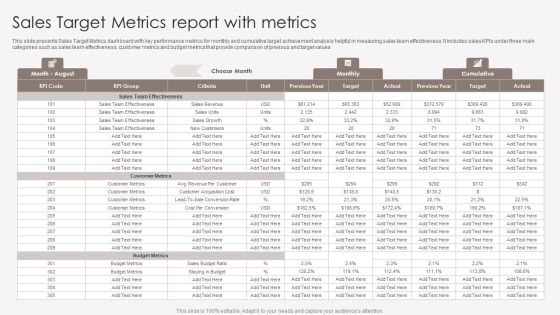
Sales Target Metrics Report With Metrics Introduction PDF
This slide presents Sales Target Metrics dashboard with key performance metrics for monthly and cumulative target achievement analysis helpful in measuring sales team effectiveness. It includes sales KPIs under three main categories such as sales team effectiveness, customer metrics and budget metrics that provide comparison of previous and target values. Pitch your topic with ease and precision using this Sales Target Metrics Report With Metrics Introduction PDF. This layout presents information on Sales Team Effectiveness, Customer Metrics, Budget Metrics. It is also available for immediate download and adjustment. So, changes can be made in the color, design, graphics or any other component to create a unique layout.
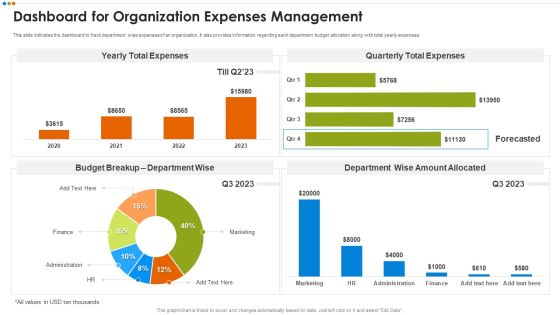
Quarterly Budget Analysis Of Business Organization Dashboard For Organization Expenses Microsoft PDF
This slide indicates the dashboard to track department wise expenses of an organization. It also provides information regarding each department budget allocation along with total yearly expenses.Deliver an awe inspiring pitch with this creative Quarterly Budget Analysis Of Business Organization Dashboard For Organization Expenses Microsoft PDF bundle. Topics like Budget Breakup, Quarterly Total Expenses, Department Wise Amount Allocated can be discussed with this completely editable template. It is available for immediate download depending on the needs and requirements of the user.

Dashboard For Organization Expenses Management Summary PDF
This slide indicates the dashboard to track department wise expenses of an organization. It also provides information regarding each department budget allocation along with total yearly expenses. Crafting an eye catching presentation has never been more straightforward. Let your presentation shine with this tasteful yet straightforward Dashboard For Organization Expenses Management Summary PDF template. It offers a minimalistic and classy look that is great for making a statement. The colors have been employed intelligently to add a bit of playfulness while still remaining professional. Construct the ideal Dashboard For Organization Expenses Management Summary PDF that effortlessly grabs the attention of your audience Begin now and be certain to wow your customers.
Predictive Data Analytics Ppt Powerpoint Presentation Infographics Master Slide Cpb
This is a predictive data analytics ppt powerpoint presentation infographics master slide cpb. This is a five stage process. The stages in this process are predictive data analytics.

Search Engine Marketing Estimated Campaign Performance Result Summary Designs PDF
The following slide depicts the forecasted campaign outcomes to assess potential earnings and spending. It includes key performance indicators such as monthly budget, cost per click, website traffic, conversion rate, average conversion value etc. Do you know about Slidesgeeks Search Engine Marketing Estimated Campaign Performance Result Summary Designs PDF These are perfect for delivering any kind od presentation. Using it, create PowerPoint presentations that communicate your ideas and engage audiences. Save time and effort by using our pre-designed presentation templates that are perfect for a wide range of topic. Our vast selection of designs covers a range of styles, from creative to business, and are all highly customizable and easy to edit. Download as a PowerPoint template or use them as Google Slides themes.

Estimated Campaign Performance Result Summary Ppt Slide PDF
The following slide depicts the forecasted campaign outcomes to assess potential earnings and spending. It includes key performance indicators such as monthly budget, cost per click, website traffic, conversion rate, average conversion value etc. Coming up with a presentation necessitates that the majority of the effort goes into the content and the message you intend to convey. The visuals of a PowerPoint presentation can only be effective if it supplements and supports the story that is being told. Keeping this in mind our experts created Estimated Campaign Performance Result Summary Ppt Slide PDF to reduce the time that goes into designing the presentation. This way, you can concentrate on the message while our designers take care of providing you with the right template for the situation.

Deploying Ai To Enhance Predictive Analytics Dashboard To Track Manufacturing Guidelines PDF
This slide depicts the predictive analytics dashboard to track manufacturing operations, including production volume, order volume, active machines, sales revenue, top five products, downtime causes, production volume by top five machines, and so on. This modern and well-arranged Deploying Ai To Enhance Predictive Analytics Dashboard To Track Manufacturing Guidelines PDF provides lots of creative possibilities. It is very simple to customize and edit with the Powerpoint Software. Just drag and drop your pictures into the shapes. All facets of this template can be edited with Powerpoint, no extra software is necessary. Add your own material, put your images in the places assigned for them, adjust the colors, and then you can show your slides to the world, with an animated slide included.

Predictive Data Model Predictive Analytics In Align Sales And Marketing Better Information PDF
This slide describes how predictive analytics can help align sales and marketing better. Predictive analytics can help get insights from sales and marketing teams that can help to improve several factors, including handing off leads, communication of promotions, and so on. Are you searching for a Predictive Data Model Predictive Analytics In Align Sales And Marketing Better Information PDF that is uncluttered, straightforward, and original Its easy to edit, and you can change the colors to suit your personal or business branding. For a presentation that expresses how much effort you have put in, this template is ideal With all of its features, including tables, diagrams, statistics, and lists, its perfect for a business plan presentation. Make your ideas more appealing with these professional slides. Download Predictive Data Model Predictive Analytics In Align Sales And Marketing Better Information PDF from Slidegeeks today.

Predictive Data Model Steps For Predictive Analytics Workflow Application Sample PDF
This slide represents the steps for predictive analytics workflow application in industries, and it includes accessing and exploring information, pre-processing information, developing predictive models, and integrating analytics with systems. Get a simple yet stunning designed Predictive Data Model Steps For Predictive Analytics Workflow Application Sample PDF. It is the best one to establish the tone in your meetings. It is an excellent way to make your presentations highly effective. So, download this PPT today from Slidegeeks and see the positive impacts. Our easy-to-edit Predictive Data Model Steps For Predictive Analytics Workflow Application Sample PDF can be your go-to option for all upcoming conferences and meetings. So, what are you waiting for Grab this template today.
MSW Management Waste Management Tracking Dashboard Rules PDF
This slide covers the key performance indicators for waste management including waste trucks tracker, green house gasses emissions, energy used and many more. Deliver an awe inspiring pitch with this creative MSW Management Waste Management Tracking Dashboard Rules Pdf bundle. Topics like waste management manpower budget can be discussed with this completely editable template. It is available for immediate download depending on the needs and requirements of the user.

Data Valuation And Monetization Predicting Customer Churn Probability Through Predictive Analytics Icons PDF
After deploying predictive analytics tool, the firm will become capable in predicting churn probability of various customers on basis of various attributes such as NPS, transaction usage, etc. that are retrieved from customer data.Deliver and pitch your topic in the best possible manner with this Data Valuation And Monetization Predicting Customer Churn Probability Through Predictive Analytics Icons PDF. Use them to share invaluable insights on Transaction, Churn Probability, Comments and impress your audience. This template can be altered and modified as per your expectations. So, grab it now.

Procedure Advancements Banking Department Financial Forecast After Process Improvement Template PDF
The slide provides the financial forecast of the company after the process improvement. Major KPIs key performance indicators covered in the slide are total revenue, interest income, number of customers, customer churn rate, online banking users, customer satisfaction rate etc. Deliver and pitch your topic in the best possible manner with this procedure advancements banking department financial forecast after process improvement template pdf. Use them to share invaluable insights on total revenue, interest income, customer satisfaction rate, customer churn rate, online banking users and impress your audience. This template can be altered and modified as per your expectations. So, grab it now.
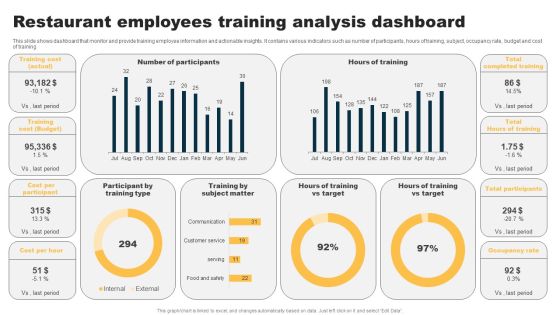
Restaurant Employees Training Analysis Dashboard Diagrams PDF
This slide shows dashboard that monitor and provide training employee information and actionable insights. It contains various indicators such as number of participants, hours of training, subject, occupancy rate, budget and cost of training. Showcasing this set of slides titled Restaurant Employees Training Analysis Dashboard Diagrams PDF. The topics addressed in these templates are Participant Training Type, Training Subject Matter, Hours Of Training Target. All the content presented in this PPT design is completely editable. Download it and make adjustments in color, background, font etc. as per your unique business setting.

Predictive Analytics In The Age Of Big Data Steps To Build Predictive Algorithm Models Sample PDF
This slide discusses the steps required to create predictive algorithm models for business processes. The steps include defining scope and scale, profile data, information collection, cleaning, and integrating, comprising analytics in business processes, and tracking models and business results. Create an editable Predictive Analytics In The Age Of Big Data Steps To Build Predictive Algorithm Models Sample PDF that communicates your idea and engages your audience. Whether youre presenting a business or an educational presentation, pre designed presentation templates help save time. Predictive Analytics In The Age Of Big Data Steps To Build Predictive Algorithm Models Sample PDF is highly customizable and very easy to edit, covering many different styles from creative to business presentations. Slidegeeks has creative team members who have crafted amazing templates. So, go and get them without any delay.

Predictive Data Model Roadmap For Predictive Analytics Model Development Clipart PDF
This slide represents the roadmap for predictive analytics model development, including the steps to be performed in the process, such as highlighting and formulating a problem, data preparation, information exploration, transforming and choosing, making, validating, and so on. Do you have to make sure that everyone on your team knows about any specific topic I yes, then you should give Predictive Data Model Roadmap For Predictive Analytics Model Development Clipart PDF a try. Our experts have put a lot of knowledge and effort into creating this impeccable Predictive Data Model Roadmap For Predictive Analytics Model Development Clipart PDF. You can use this template for your upcoming presentations, as the slides are perfect to represent even the tiniest detail. You can download these templates from the Slidegeeks website and these are easy to edit. So grab these today

Predictive Data Model Predictive Analytics To Understand Current Customers Needs Infographics PDF
This slide outlines how predictive analytics can help understand existing customers needs as many businesses depend on client retention and upsells. It also includes the factors impacting the marketing industry, including lead generation, new products or services, and improved referrals. Create an editable Predictive Data Model Predictive Analytics To Understand Current Customers Needs Infographics PDF that communicates your idea and engages your audience. Whether you are presenting a business or an educational presentation, pre-designed presentation templates help save time. Predictive Data Model Predictive Analytics To Understand Current Customers Needs Infographics PDF is highly customizable and very easy to edit, covering many different styles from creative to business presentations. Slidegeeks has creative team members who have crafted amazing templates. So, go and get them without any delay.

Predictive Data Model Training Program For Predictive Analytics Model Microsoft PDF
This slide represents the training program for the predictive analytics model, and it includes the name of teams, trainer names, modules to be covered in training, and the schedule and venue of the training. Find highly impressive Predictive Data Model Training Program For Predictive Analytics Model Microsoft PDF on Slidegeeks to deliver a meaningful presentation. You can save an ample amount of time using these presentation templates. No need to worry to prepare everything from scratch because Slidegeeks experts have already done a huge research and work for you. You need to download Predictive Data Model Training Program For Predictive Analytics Model Microsoft PDF for your upcoming presentation. All the presentation templates are 100 percent editable and you can change the color and personalize the content accordingly. Download now

Service Hourly Rate Calculation Stages Of Cost Allocation Procedure Pictures PDF
This slide covers the service hourly rate calculation including cost type, comments, annual budgeted cost, forecast billable hours and hourly rate. Crafting an eye-catching presentation has never been more straightforward. Let your presentation shine with this tasteful yet straightforward Service Hourly Rate Calculation Stages Of Cost Allocation Procedure Pictures PDF template. It offers a minimalistic and classy look that is great for making a statement. The colors have been employed intelligently to add a bit of playfulness while still remaining professional. Construct the ideal Service Hourly Rate Calculation Stages Of Cost Allocation Procedure Pictures PDF that effortlessly grabs the attention of your audience Begin now and be certain to wow your customers.

Transaction Data Overview Company Payout Dashboard Guidelines PDF
The slide highlights the payment dashboard to overview the transaction data for effectively managing finances. Various elements included are activities, statistics, card information, transaction history, and budget. Pitch your topic with ease and precision using this Transaction Data Overview Company Payout Dashboard Guidelines PDF. This layout presents information on Transaction History, Budget, Card Information, Statistics. It is also available for immediate download and adjustment. So, changes can be made in the color, design, graphics or any other component to create a unique layout.
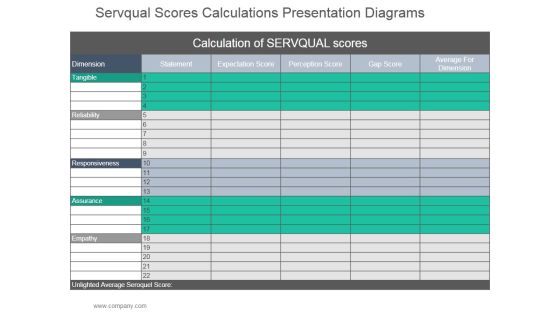
Servqual Scores Calculations Ppt PowerPoint Presentation Picture
This is a servqual scores calculations ppt powerpoint presentation picture. This is a five stage process. The stages in this process are calculation of servqual scores, dimension, statement, expectation score, perception score, gap score, average for dimension, tangible, reliability, responsiveness, assurance, empathy, unlighted average seroquel score.

Market Research Study Template Ppt Sample
This is a market research study template ppt sample. This is a four stage process. The stages in this process are market size estimation, market crack down and data triangulation, market forecast model, key data points.

Forecasted Policies And Claims Data After Successful Strategy Implementation Ppt Model Introduction PDF
This slide shows the forecasted policies and claims data after the successful implementation of the strategies which includes policies sold, GWP, average premium etc. This is a forecasted policies and claims data after successful strategy implementation ppt model introduction pdf template with various stages. Focus and dispense information on two stages using this creative set, that comes with editable features. It contains large content boxes to add your information on topics like average premium, paid claims ratio, 2021. You can also showcase facts, figures, and other relevant content using this PPT layout. Grab it now.

Budgeting Template Ppt PowerPoint Presentation Show Picture
This is a budgeting template ppt powerpoint presentation show picture. This is a three stage process. The stages in this process are business, marketing, strategy, budget, table.
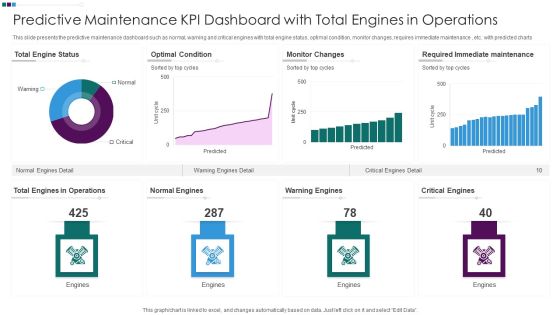
Predictive Maintenance KPI Dashboard With Total Engines In Operations Ppt Professional Inspiration PDF
This slide presents the predictive maintenance dashboard such as normal, warning and critical engines with total engine status, optimal condition, monitor changes, requires immediate maintenance , etc. with predicted charts. Pitch your topic with ease and precision using this Predictive Maintenance KPI Dashboard With Total Engines In Operations Ppt Professional Inspiration PDF. This layout presents information on Total Engine Status, Optimal Condition Monitor, Changes Warning Engines, Required Immediate Maintenance. It is also available for immediate download and adjustment. So, changes can be made in the color, design, graphics or any other component to create a unique layout.

Predictive Data Model Predictive Analytics In Banking And Finance Industry Introduction PDF
This slide represents the application of predictive analytics in the finance and banking sector as they deal with vast amounts of data. It helps these industries identify fraudulent transactions, generate credit score, monitor credit risks, and optimize cross-sell or up-sell possibilities. Retrieve professionally designed Predictive Data Model Predictive Analytics In Banking And Finance Industry Introduction PDF to effectively convey your message and captivate your listeners. Save time by selecting pre-made slideshows that are appropriate for various topics, from business to educational purposes. These themes come in many different styles, from creative to corporate, and all of them are easily adjustable and can be edited quickly. Access them as PowerPoint templates or as Google Slides themes. You do not have to go on a hunt for the perfect presentation because Slidegeeks got you covered from everywhere.

Predictive Data Model Checklist For Predictive Analytics Model Deployment Sample PDF
This slide talks about the checklist for predictive analytics deployment that is necessary for organizations before deploying it and avoiding possible mistakes. It includes defining objectives, building the right team, and planning the deployment. Present like a pro with Predictive Data Model Checklist For Predictive Analytics Model Deployment Sample PDF Create beautiful presentations together with your team, using our easy-to-use presentation slides. Share your ideas in real-time and make changes on the fly by downloading our templates. So whether you are in the office, on the go, or in a remote location, you can stay in sync with your team and present your ideas with confidence. With Slidegeeks presentation got a whole lot easier. Grab these presentations today.

Predictive Data Model Uses Of Predictive Analytics In Marketing Industry Themes PDF
This slide outlines the use of predictive analytics in the marketing industry, where active traders develop a new campaign based on customer behavior. The marketing use cases include understanding customer behavior, optimizing resources and spending, qualifying and prioritizing leads, and retaining customers. Are you in need of a template that can accommodate all of your creative concepts This one is crafted professionally and can be altered to fit any style. Use it with Google Slides or PowerPoint. Include striking photographs, symbols, depictions, and other visuals. Fill, move around, or remove text boxes as desired. Test out color palettes and font mixtures. Edit and save your work, or work with colleagues. Download Predictive Data Model Uses Of Predictive Analytics In Marketing Industry Themes PDF and observe how to make your presentation outstanding. Give an impeccable presentation to your group and make your presentation unforgettable.
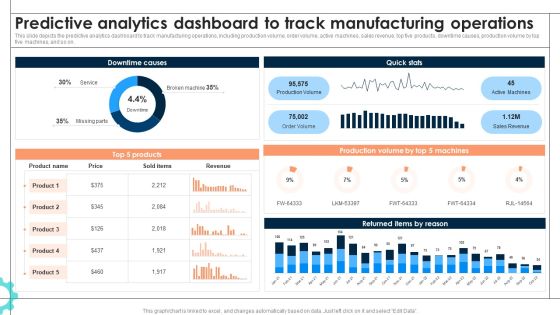
Intelligent Manufacturing Predictive Analytics Dashboard To Track Manufacturing Operations Information PDF
This slide depicts the predictive analytics dashboard to track manufacturing operations, including production volume, order volume, active machines, sales revenue, top five products, downtime causes, production volume by top five machines, and so on. If you are looking for a format to display your unique thoughts, then the professionally designed Intelligent Manufacturing Predictive Analytics Dashboard To Track Manufacturing Operations Information PDF is the one for you. You can use it as a Google Slides template or a PowerPoint template. Incorporate impressive visuals, symbols, images, and other charts. Modify or reorganize the text boxes as you desire. Experiment with shade schemes and font pairings. Alter, share or cooperate with other people on your work. Download Intelligent Manufacturing Predictive Analytics Dashboard To Track Manufacturing Operations Information PDF and find out how to give a successful presentation. Present a perfect display to your team and make your presentation unforgettable.

Iot Integration In Manufacturing Predictive Analytics Dashboard To Track Manufacturing Operations Background PDF
This slide depicts the predictive analytics dashboard to track manufacturing operations, including production volume, order volume, active machines, sales revenue, top five products, downtime causes, production volume by top five machines, and so on. If you are looking for a format to display your unique thoughts, then the professionally designed Iot Integration In Manufacturing Predictive Analytics Dashboard To Track Manufacturing Operations Background PDF is the one for you. You can use it as a Google Slides template or a PowerPoint template. Incorporate impressive visuals, symbols, images, and other charts. Modify or reorganize the text boxes as you desire. Experiment with shade schemes and font pairings. Alter, share or cooperate with other people on your work. Download Iot Integration In Manufacturing Predictive Analytics Dashboard To Track Manufacturing Operations Background PDF and find out how to give a successful presentation. Present a perfect display to your team and make your presentation unforgettable.

 Home
Home